Azure Contracts in the City of London

Microsoft Azure
Central London > City of London

The table below provides summary statistics for contract job vacancies advertised in the City of London requiring Azure skills. It includes a benchmarking guide to the contractor rates offered in vacancies that cited Azure over the 6 months leading up to 8 June 2025, comparing them to the same period in the previous two years.

6 months to
8 Jun 2025
Same period 2024 Same period 2023
Rank 4 4 4
Rank change year-on-year 0 0 +2
Contract jobs citing Azure 324 431 660
As % of all contract jobs advertised in the City of London 19.00% 19.77% 19.08%
As % of the Cloud Services category 44.32% 48.98% 48.74%
Number of daily rates quoted 202 292 393
10th Percentile £364 £400 £425
25th Percentile £480 £463 £500
Median daily rate (50th Percentile) £550 £550 £595
Median % change year-on-year - -7.56% +3.48%
75th Percentile £675 £675 £730
90th Percentile £750 £774 £819
Central London median daily rate £550 £550 £593
% change year-on-year - -7.17% +3.04%
Number of hourly rates quoted 3 0 2
10th Percentile £38.65 - £54.25
25th Percentile £56.50 - £58.75
Median hourly rate £87.50 - £67.50
75th Percentile £94.38 - £76.25
90th Percentile £97.75 - £80.75
Central London median hourly rate £58.00 - £67.50
% change year-on-year - - +22.73%

All Cloud Skills
City of London

Azure falls under the Cloud Services category. For comparison with the information above, the following table provides summary statistics for all contract job vacancies requiring cloud computing skills in the City of London.

Contract vacancies with a requirement for cloud computing skills 731 880 1,354
As % of all contract IT jobs advertised in the City of London 42.87% 40.37% 39.13%
Number of daily rates quoted 465 612 887
10th Percentile £363 £363 £313
25th Percentile £455 £447 £463
Median daily rate (50th Percentile) £550 £550 £600
Median % change year-on-year - -8.33% +4.35%
75th Percentile £675 £650 £700
90th Percentile £754 £750 £800
Central London median daily rate £550 £538 £594
% change year-on-year +2.33% -9.47% +3.26%
Number of hourly rates quoted 11 6 9
10th Percentile £23.75 £12.75 £30.45
25th Percentile £24.66 £14.88 £47.50
Median hourly rate £34.65 £22.50 £82.50
Median % change year-on-year +54.00% -72.73% +211.32%
75th Percentile £68.75 £26.19 £88.30
90th Percentile £100.00 £38.63 -
Central London median hourly rate £28.79 £22.50 £67.50
% change year-on-year +27.93% -66.67% +98.53%

Azure
Job Vacancy Trend in the City of London

Job postings citing Azure as a proportion of all IT jobs advertised in the City of London.
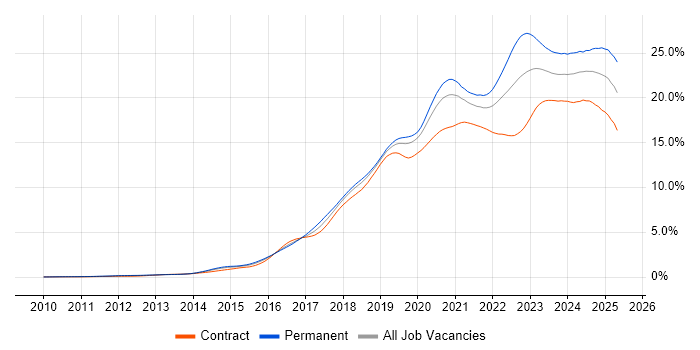
Job vacancy trend for Azure in the City of London

Azure
Contractor Daily Rate Trend in the City of London

3-month moving average daily rate quoted in jobs citing Azure in the City of London.

Daily rate trend for Azure in the City of London

Azure
Daily Rate Histogram in the City of London

Daily rate distribution for jobs citing Azure in the City of London over the 6 months to 8 June 2025.

Daily rate histogram for Azure in the City of London

Azure
Contractor Hourly Rate Trend in the City of London

3-month moving average hourly rates quoted in jobs citing Azure in the City of London.

Hourly rate trend for Azure in the City of London

Azure
Hourly Rate Histogram in the City of London

Hourly rate distribution of jobs citing Azure in the City of London over the 6 months to 8 June 2025.

Hourly rate histogram for Azure in the City of London

Azure
Contract Job Locations in the City of London

The table below looks at the demand and provides a guide to the median contractor rates quoted in IT jobs citing Azure within the City of London region over the 6 months to 8 June 2025. The 'Rank Change' column provides an indication of the change in demand within each location based on the same 6 month period last year.

Location Rank Change
on Same Period
Last Year
Matching
Contract
IT Job Ads
Median
Daily Rate
Past 6 Months
Median Daily Rate
% Change
on Same Period
Last Year
Live
Jobs
London Bridge - 5 - - 1
Azure
Central London

Azure
Co-occurring Skills and Capabilities in the City of London by Category

The follow tables expand on the table above by listing co-occurrences grouped by category. The same employment type, locality and period is covered with up to 20 co-occurrences shown in each of the following categories:

Application Platforms
1 16 (4.94%) SharePoint
2 15 (4.63%) Apache Spark
3 14 (4.32%) Confluence
4 9 (2.78%) Apache
4 9 (2.78%) Microsoft Exchange
5 8 (2.47%) Apache Airflow
6 4 (1.23%) Jupyter
7 2 (0.62%) CMS
7 2 (0.62%) Luigi
8 1 (0.31%) nginx
8 1 (0.31%) Oracle Workflow
8 1 (0.31%) SAS
Applications
1 8 (2.47%) Microsoft Office
2 7 (2.16%) Microsoft Excel
3 5 (1.54%) Microsoft Project
4 4 (1.23%) Microsoft PowerPoint
5 3 (0.93%) Trello
6 2 (0.62%) MS Visio
7 1 (0.31%) Spreadsheet
Business Applications
1 11 (3.40%) Endur
2 9 (2.78%) Dynamics CRM
3 3 (0.93%) SAP BPC
4 2 (0.62%) Oracle EBS
4 2 (0.62%) Unit4 Business World
5 1 (0.31%) Fidessa
5 1 (0.31%) Magento
5 1 (0.31%) SAP S/4HANA
Cloud Services
1 94 (29.01%) AWS
2 63 (19.44%) Azure DevOps
3 46 (14.20%) Microsoft 365
4 41 (12.65%) Power Platform
5 40 (12.35%) GCP
6 33 (10.19%) Entra ID
7 25 (7.72%) GitHub
8 24 (7.41%) Azure Data Factory
9 19 (5.86%) PaaS
10 16 (4.94%) SaaS
11 15 (4.63%) Azure AKS
11 15 (4.63%) Azure Monitor
11 15 (4.63%) Dynamics 365
11 15 (4.63%) IaaS
11 15 (4.63%) Serverless
12 12 (3.70%) Azure Sentinel
13 11 (3.40%) Azure Synapse Analytics
13 11 (3.40%) GitHub Actions
14 9 (2.78%) Azure ExpressRoute
15 8 (2.47%) PowerApps
Communications & Networking
1 37 (11.42%) Firewall
2 21 (6.48%) DNS
3 16 (4.94%) VPN
4 13 (4.01%) Network Security
5 8 (2.47%) NGFW
6 7 (2.16%) WAN
7 6 (1.85%) TCP/IP
8 4 (1.23%) LAN
8 4 (1.23%) SD-WAN
8 4 (1.23%) SSH
8 4 (1.23%) Wi-Fi
9 3 (0.93%) DHCP
9 3 (0.93%) HTTP
9 3 (0.93%) Internet
9 3 (0.93%) MPLS
9 3 (0.93%) SMTP
9 3 (0.93%) SSL
9 3 (0.93%) VLAN
10 2 (0.62%) Modbus
10 2 (0.62%) MQTT
Database & Business Intelligence
1 35 (10.80%) SQL Server
2 30 (9.26%) Power BI
3 22 (6.79%) Data Warehouse
4 18 (5.56%) Data Lake
5 16 (4.94%) Azure SQL Database
5 16 (4.94%) NoSQL
6 13 (4.01%) Big Data
6 13 (4.01%) Metadata
7 11 (3.40%) Delta Lake
8 10 (3.09%) SQL Server Integration Services
9 7 (2.16%) Apache Hive
9 7 (2.16%) BusinessObjects
9 7 (2.16%) Hadoop
9 7 (2.16%) Tableau
10 6 (1.85%) Crystal Reports
10 6 (1.85%) PostgreSQL
10 6 (1.85%) SQL Server Reporting Services
11 4 (1.23%) Data Mining
11 4 (1.23%) MongoDB
11 4 (1.23%) SAP Data Services
Development Applications
1 28 (8.64%) JIRA
2 19 (5.86%) Git
3 12 (3.70%) Jenkins
4 8 (2.47%) GitLab
5 4 (1.23%) RStudio
6 3 (0.93%) Postman
6 3 (0.93%) Selenium
6 3 (0.93%) TeamCity
7 2 (0.62%) JMeter
7 2 (0.62%) LoadRunner
7 2 (0.62%) MSI
7 2 (0.62%) REST Assured
7 2 (0.62%) SonarQube
7 2 (0.62%) Subversion
7 2 (0.62%) Visual Studio Team System
8 1 (0.31%) Crucible
8 1 (0.31%) eggPlant
8 1 (0.31%) git-flow
8 1 (0.31%) Terragrunt
8 1 (0.31%) Visual Studio Code
General
1 108 (33.33%) Finance
2 96 (29.63%) Social Skills
3 37 (11.42%) Analytical Skills
4 35 (10.80%) Banking
5 12 (3.70%) Public Sector
6 10 (3.09%) Documentation Skills
7 8 (2.47%) Inclusion and Diversity
7 8 (2.47%) Law
7 8 (2.47%) Legal
7 8 (2.47%) Retail
8 6 (1.85%) Organisational Skills
9 5 (1.54%) Financial Institution
9 5 (1.54%) Influencing Skills
9 5 (1.54%) Investment Banking
9 5 (1.54%) Presentation Skills
10 4 (1.23%) Police
11 3 (0.93%) Back Office
11 3 (0.93%) Marketing
12 2 (0.62%) Publishing
12 2 (0.62%) Telecoms
Job Titles
1 56 (17.28%) Architect
2 51 (15.74%) Developer
3 36 (11.11%) Data Engineer
4 32 (9.88%) Analyst
4 32 (9.88%) Solutions Architect
5 31 (9.57%) Azure Engineer
5 31 (9.57%) Senior
6 16 (4.94%) Azure Architect
6 16 (4.94%) Lead
6 16 (4.94%) Support Engineer
7 14 (4.32%) Business Analyst
8 13 (4.01%) Project Manager
9 11 (3.40%) Consultant
9 11 (3.40%) Senior Developer
10 10 (3.09%) DevOps Engineer
10 10 (3.09%) Network Engineer
11 9 (2.78%) Azure Data Engineer
11 9 (2.78%) Cloud Architect
11 9 (2.78%) Full-Stack Developer
11 9 (2.78%) Security Architect
Libraries, Frameworks & Software Standards
1 36 (11.11%) .NET
2 17 (5.25%) REST
3 15 (4.63%) Kafka
4 14 (4.32%) CSS
4 14 (4.32%) HTML
4 14 (4.32%) PySpark
5 12 (3.70%) ADO
6 9 (2.78%) AngularJS
6 9 (2.78%) Node.js
7 8 (2.47%) JSON
7 8 (2.47%) Web Services
8 7 (2.16%) Pandas
9 6 (1.85%) React
9 6 (1.85%) YAML
10 5 (1.54%) Middleware
10 5 (1.54%) NumPy
10 5 (1.54%) RESTful
11 4 (1.23%) ARM Templates
11 4 (1.23%) OpenTelemetry
11 4 (1.23%) Vue
Miscellaneous
1 16 (4.94%) Cloud Native
2 11 (3.40%) Product Ownership
3 10 (3.09%) Data Centre
4 7 (2.16%) Anti-Spyware
4 7 (2.16%) Legacy Systems
4 7 (2.16%) Public Cloud
5 6 (1.85%) Linux Command Line
6 5 (1.54%) Data Structures
6 5 (1.54%) Equities
6 5 (1.54%) Hybrid Cloud
6 5 (1.54%) Reference Data
6 5 (1.54%) Reinsurance
6 5 (1.54%) Self-Motivation
7 4 (1.23%) Clustering
7 4 (1.23%) Distributed Systems
7 4 (1.23%) Low-Code
8 3 (0.93%) Algorithms
8 3 (0.93%) Renewable Energy
8 3 (0.93%) Security Posture
8 3 (0.93%) Virtual Team
Operating Systems
1 40 (12.35%) Windows
2 21 (6.48%) Linux
3 20 (6.17%) Windows Server
4 10 (3.09%) Windows 10
5 3 (0.93%) Red Hat Enterprise Linux
5 3 (0.93%) Rocky
6 2 (0.62%) Solaris
7 1 (0.31%) Android
7 1 (0.31%) Apple iOS
7 1 (0.31%) Mac OS
7 1 (0.31%) Mac OS X
7 1 (0.31%) Unix
7 1 (0.31%) VMS
7 1 (0.31%) Windows 7
7 1 (0.31%) Windows Server 2016
7 1 (0.31%) Windows Server 2019
Processes & Methodologies
1 121 (37.35%) DevOps
2 94 (29.01%) Agile
3 71 (21.91%) CI/CD
4 59 (18.21%) Problem-Solving
5 41 (12.65%) Analytics
6 40 (12.35%) Migration
7 36 (11.11%) Infrastructure as Code
8 32 (9.88%) Data Modelling
9 30 (9.26%) ETL
9 30 (9.26%) Stakeholder Management
10 29 (8.95%) Data Engineering
11 26 (8.02%) Data Pipeline
11 26 (8.02%) Test Automation
12 25 (7.72%) Business Intelligence
12 25 (7.72%) Continuous Improvement
12 25 (7.72%) Decision-Making
12 25 (7.72%) Software Engineering
13 24 (7.41%) Microservices
14 22 (6.79%) Cloud Security
14 22 (6.79%) Data Science
Programming Languages
1 95 (29.32%) Python
2 86 (26.54%) SQL
3 39 (12.04%) C#
4 32 (9.88%) PowerShell
5 30 (9.26%) Java
5 30 (9.26%) JavaScript
6 13 (4.01%) Bash
7 11 (3.40%) Scala
8 9 (2.78%) Bicep
9 5 (1.54%) C++
9 5 (1.54%) Perl
10 4 (1.23%) Ruby
10 4 (1.23%) T-SQL
11 3 (0.93%) Go
11 3 (0.93%) PL/SQL
11 3 (0.93%) R
11 3 (0.93%) TypeScript
12 2 (0.62%) Groovy
12 2 (0.62%) VBA
12 2 (0.62%) VBScript
Qualifications
1 36 (11.11%) Degree
2 24 (7.41%) Security Cleared
3 20 (6.17%) Azure Certification
3 20 (6.17%) SC Cleared
4 7 (2.16%) CISSP
4 7 (2.16%) Computer Science Degree
4 7 (2.16%) PMI Certification
4 7 (2.16%) PMP
5 6 (1.85%) Cisco Certification
6 5 (1.54%) AWS Certification
6 5 (1.54%) CISM
6 5 (1.54%) ITIL Certification
6 5 (1.54%) Microsoft Certification
7 4 (1.23%) BPSS Clearance
7 4 (1.23%) CCNP
8 3 (0.93%) DV Cleared
9 2 (0.62%) AWS Certified Solutions Architect
9 2 (0.62%) CEH
9 2 (0.62%) TOGAF Certification
9 2 (0.62%) VMware Certified Professional (VCP)
Quality Assurance & Compliance
1 18 (5.56%) Data Quality
2 17 (5.25%) GDPR
3 14 (4.32%) QA
4 12 (3.70%) ISO/IEC 27001
4 12 (3.70%) NIST
5 6 (1.85%) Accessibility
6 5 (1.54%) SLA
7 3 (0.93%) California Consumer Privacy Act
7 3 (0.93%) PCI DSS
8 2 (0.62%) HIPAA
8 2 (0.62%) PMO
8 2 (0.62%) Sarbanes-Oxley
8 2 (0.62%) SOC 2
9 1 (0.31%) Cyber Essentials
9 1 (0.31%) EMIR
9 1 (0.31%) ISO 20022
9 1 (0.31%) MiFID
9 1 (0.31%) SEPA
System Software
1 37 (11.42%) Active Directory
2 18 (5.56%) Docker
3 7 (2.16%) VMware Infrastructure
4 5 (1.54%) Virtual Machines
5 3 (0.93%) VMware ESXi
6 2 (0.62%) Virtual Desktop
7 1 (0.31%) Hyper-V
7 1 (0.31%) NFS
7 1 (0.31%) OpenAM
7 1 (0.31%) OpenDJ
7 1 (0.31%) OpenIDM
7 1 (0.31%) Oracle RAC
7 1 (0.31%) Platform Symphony
7 1 (0.31%) Veritas File System
7 1 (0.31%) Veritas Volume Manager
7 1 (0.31%) VMware NSX
Systems Management
1 45 (13.89%) Terraform
2 40 (12.35%) Kubernetes
3 17 (5.25%) Microsoft Intune
4 14 (4.32%) Ansible
5 9 (2.78%) SCCM
6 7 (2.16%) ITRS Geneos
7 4 (1.23%) Grafana
8 3 (0.93%) Consul
8 3 (0.93%) Control-M
8 3 (0.93%) Istio
8 3 (0.93%) Prometheus
8 3 (0.93%) QRadar
9 2 (0.62%) AirWatch
9 2 (0.62%) Argo
9 2 (0.62%) FortiGate
9 2 (0.62%) HP ALM
9 2 (0.62%) Kibana
9 2 (0.62%) Progress Chef
9 2 (0.62%) Symantec Enterprise Vault
9 2 (0.62%) Tivoli
Vendors
1 98 (30.25%) Microsoft
2 43 (13.27%) Databricks
3 15 (4.63%) Palo Alto
3 15 (4.63%) SAP
4 13 (4.01%) ServiceNow
5 12 (3.70%) Cisco
5 12 (3.70%) Oracle
6 10 (3.09%) VMware
7 9 (2.78%) CheckPoint
8 8 (2.47%) Google
8 8 (2.47%) Informatica
9 7 (2.16%) Fortinet
9 7 (2.16%) Infoblox
10 6 (1.85%) IBM
11 5 (1.54%) Citrix
11 5 (1.54%) CyberArk
11 5 (1.54%) OpenLink
12 4 (1.23%) Bloomberg
12 4 (1.23%) Splunk
13 3 (0.93%) Red Hat