Confluence Contract Job Trends in London

Confluence
England > London

The table below provides summary statistics and contractor rates for jobs advertised in London requiring Confluence skills. It covers contract job vacancies from the 6 months leading up to 23 November 2025, with comparisons to the same periods in the previous two years.

6 months to
23 Nov 2025
Same period 2024 Same period 2023
Rank 87 114 101
Rank change year-on-year +27 -13 -7
Contract jobs citing Confluence 446 364 480
As % of all contract jobs in London 3.17% 2.29% 2.40%
As % of the Application Platforms category 27.75% 18.85% 22.22%
Number of daily rates quoted 336 236 318
10th Percentile £350 £301 £380
25th Percentile £450 £413 £463
Median daily rate (50th Percentile) £550 £550 £550
Median % change year-on-year - - -4.35%
75th Percentile £652 £675 £671
90th Percentile £741 £810 £810
England median daily rate £525 £525 £550
% change year-on-year - -4.55% +0.36%
Number of hourly rates quoted 2 0 3
10th Percentile £47.33 - £35.50
25th Percentile £53.81 - £41.88
Median hourly rate £65.25 - £55.00
75th Percentile £77.31 - £61.25
90th Percentile £84.18 - £63.50
England median hourly rate £63.40 £67.50 £66.13
% change year-on-year -6.07% +2.07% +32.27%

All Application Platform Skills
London

Confluence falls under the Application Platforms category. For comparison with the information above, the following table provides summary statistics for all contract job vacancies requiring application platform skills in London.

Contract vacancies with a requirement for application platform skills 1,607 1,931 2,160
As % of all contract IT jobs advertised in London 11.42% 12.14% 10.79%
Number of daily rates quoted 1,106 1,280 1,496
10th Percentile £321 £305 £300
25th Percentile £413 £413 £410
Median daily rate (50th Percentile) £525 £550 £525
Median % change year-on-year -4.55% +4.76% -4.55%
75th Percentile £638 £713 £650
90th Percentile £760 £850 £775
England median daily rate £500 £513 £500
% change year-on-year -2.44% +2.50% -4.76%
Number of hourly rates quoted 29 21 25
10th Percentile - £18.00 £18.60
25th Percentile £17.50 £23.80 £21.50
Median hourly rate £26.00 £33.07 £27.50
Median % change year-on-year -21.38% +20.25% +17.95%
75th Percentile £46.00 £39.00 £44.54
90th Percentile £87.75 £63.75 £64.50
England median hourly rate £37.50 £41.00 £25.00
% change year-on-year -8.54% +64.00% +28.21%

Confluence
Job Vacancy Trend in London

Historical trend showing the proportion of contract IT job postings citing Confluence relative to all contract IT jobs advertised in London.
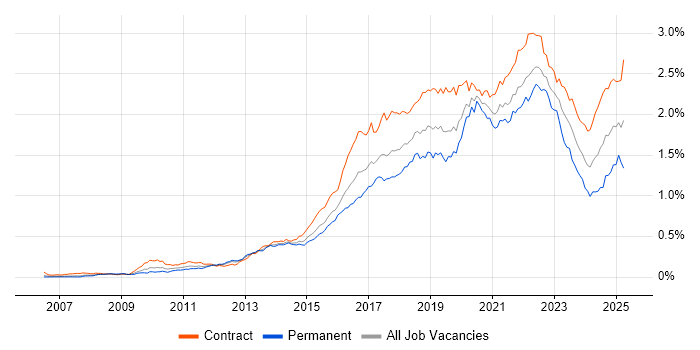
Confluence job vacancy trend in London

Confluence
Daily Rate Trend in London

Contractor daily rate distribution trend for jobs in London citing Confluence.

Contractor daily rate distribution trend for jobs in London citing Confluence

Confluence
Daily Rate Histogram in London

Daily rate distribution for jobs citing Confluence in London over the 6 months to 23 November 2025.

Daily rate histogram for Confluence in London

Confluence
Hourly Rate Trend in London

Contractor hourly rate distribution trend for jobs in London citing Confluence.

Contractor hourly rate distribution trend for jobs in London citing Confluence

Confluence
Hourly Rate Histogram in London

Hourly rate distribution of jobs citing Confluence in London over the 6 months to 23 November 2025.

Hourly rate histogram for Confluence in London

Confluence
Contract Job Locations in London

The table below looks at the demand and provides a guide to the median contractor rates quoted in IT jobs citing Confluence within the London region over the 6 months to 23 November 2025. The 'Rank Change' column provides an indication of the change in demand within each location based on the same 6 month period last year.

Location Rank Change
on Same Period
Last Year
Matching
Contract
IT Job Ads
Median
Daily Rate
Past 6 Months
Median Daily Rate
% Change
on Same Period
Last Year
Live
Jobs
Central London +26 69 £500 -9.09% 9
South London +9 21 £582 +22.47% 2
West London -12 6 £415 -17.00% 2
East London +4 1 £520 -5.45% 2
Confluence
England

Confluence
Co-Occurring Skills & Capabilities in London by Category

The following tables expand on the one above by listing co-occurrences grouped by category. They cover the same employment type, locality and period, with up to 20 co-occurrences shown in each category:

Application Platforms
1 38 (8.52%) nginx
2 25 (5.61%) SharePoint
3 13 (2.91%) Apache
4 4 (0.90%) CMS
5 3 (0.67%) Apache Spark
5 3 (0.67%) Oracle SOA Suite
5 3 (0.67%) Traefik
6 2 (0.45%) Camunda
7 1 (0.22%) Apache Airflow
7 1 (0.22%) Appian
7 1 (0.22%) CICS
7 1 (0.22%) Cloud Foundry
7 1 (0.22%) IIS
7 1 (0.22%) JBoss
7 1 (0.22%) Microsoft Exchange
7 1 (0.22%) WordPress
Applications
1 44 (9.87%) Microsoft Excel
2 34 (7.62%) MS Visio
3 30 (6.73%) Microsoft Project
4 25 (5.61%) Microsoft PowerPoint
5 17 (3.81%) Microsoft Office
6 10 (2.24%) Mozilla Thunderbird
6 10 (2.24%) Trello
7 2 (0.45%) Adobe After Effects
7 2 (0.45%) Adobe Creative Suite
7 2 (0.45%) Adobe Illustrator
7 2 (0.45%) InDesign
7 2 (0.45%) Photoshop
8 1 (0.22%) Adobe XD
8 1 (0.22%) EPLAN
8 1 (0.22%) Notion
8 1 (0.22%) OmniGraffle
Business Applications
1 12 (2.69%) Remedy ITSM
2 4 (0.90%) Fidessa
3 3 (0.67%) Aladdin
3 3 (0.67%) NetSuite
3 3 (0.67%) Oracle BPM
3 3 (0.67%) SAP ERP
4 2 (0.45%) Salesforce CRM
4 2 (0.45%) SAP S/4HANA
4 2 (0.45%) Shopify
5 1 (0.22%) Endur
5 1 (0.22%) Oracle Cash Management
5 1 (0.22%) Oracle Financials
5 1 (0.22%) Oracle Payables
5 1 (0.22%) Oracle Receivables
5 1 (0.22%) Oracle Subledger Accounting
Cloud Services
1 111 (24.89%) AWS
2 72 (16.14%) Azure
3 49 (10.99%) GitHub
4 30 (6.73%) Azure DevOps
5 27 (6.05%) Power Platform
6 26 (5.83%) Amazon S3
7 25 (5.61%) Amazon EC2
8 23 (5.16%) AWS CloudFormation
9 22 (4.93%) GCP
10 21 (4.71%) Amazon CloudWatch
11 20 (4.48%) Serverless
12 18 (4.04%) Miro
13 16 (3.59%) SaaS
13 16 (3.59%) Slack
14 15 (3.36%) Microsoft 365
15 14 (3.14%) Amazon ECS
16 13 (2.91%) Virtual Private Cloud
17 11 (2.47%) AWS Lambda
18 10 (2.24%) Amazon ELB
18 10 (2.24%) GitHub Actions
Communications & Networking
1 21 (4.71%) Firewall
2 17 (3.81%) DNS
3 16 (3.59%) SSH
4 15 (3.36%) OpenLDAP
4 15 (3.36%) SSL
5 13 (2.91%) FTP
6 12 (2.69%) HTTP
7 11 (2.47%) SMTP
8 10 (2.24%) IMAP
9 9 (2.02%) VPN
10 7 (1.57%) WAN
11 6 (1.35%) SD-WAN
12 4 (0.90%) Network Security
13 3 (0.67%) DHCP
14 2 (0.45%) BIG-IP
14 2 (0.45%) Calico
14 2 (0.45%) Ethernet
14 2 (0.45%) F5 BIG-IP GTM
14 2 (0.45%) F5 BIG-IP LTM
14 2 (0.45%) LAN
Database & Business Intelligence
1 31 (6.95%) PostgreSQL
2 26 (5.83%) Power BI
3 20 (4.48%) Tableau
4 17 (3.81%) SQL Server
5 16 (3.59%) Hadoop
6 15 (3.36%) Elasticsearch
7 13 (2.91%) Amazon RDS
7 13 (2.91%) Big Data
8 12 (2.69%) Amazon Aurora
9 10 (2.24%) Data Warehouse
9 10 (2.24%) NoSQL
10 7 (1.57%) Metadata
11 5 (1.12%) BigQuery
11 5 (1.12%) Data Lake
11 5 (1.12%) Oracle Database
12 4 (0.90%) DB2
12 4 (0.90%) Tick Data
13 3 (0.67%) Delta Lake
13 3 (0.67%) MongoDB
13 3 (0.67%) MySQL
Development Applications
1 412 (92.38%) JIRA
2 67 (15.02%) Git
3 55 (12.33%) Jenkins
4 30 (6.73%) GitLab
5 25 (5.61%) Bitbucket
6 15 (3.36%) Selenium
7 13 (2.91%) Cucumber
7 13 (2.91%) SonarQube
8 11 (2.47%) Postman
8 11 (2.47%) Vagrant
9 9 (2.02%) JUnit
10 8 (1.79%) Sonatype Nexus
10 8 (1.79%) SpecFlow
11 7 (1.57%) Zephyr
12 6 (1.35%) Cypress.io
13 5 (1.12%) Android Studio
13 5 (1.12%) Maven
13 5 (1.12%) ScriptRunner
14 4 (0.90%) TeamCity
15 3 (0.67%) Atlassian Bamboo
General
1 200 (44.84%) Social Skills
2 124 (27.80%) Finance
3 70 (15.70%) Banking
4 69 (15.47%) Analytical Skills
5 53 (11.88%) Public Sector
6 19 (4.26%) Documentation Skills
6 19 (4.26%) Front Office
6 19 (4.26%) Investment Banking
7 18 (4.04%) Presentation Skills
8 15 (3.36%) Organisational Skills
9 14 (3.14%) Retail
10 11 (2.47%) Telecoms
11 8 (1.79%) Back Office
11 8 (1.79%) Influencing Skills
11 8 (1.79%) Legal
12 7 (1.57%) Marketing
13 6 (1.35%) Inclusion and Diversity
14 5 (1.12%) Electronics
14 5 (1.12%) Manufacturing
15 4 (0.90%) Financial Institution
Job Titles
1 87 (19.51%) Analyst
2 75 (16.82%) Business Analyst
3 51 (11.43%) Senior
4 36 (8.07%) Developer
4 36 (8.07%) Project Manager
5 34 (7.62%) Architect
6 33 (7.40%) Lead
7 21 (4.71%) Product Owner
8 19 (4.26%) DevOps Engineer
9 18 (4.04%) Solutions Architect
10 16 (3.59%) Platform Engineer
10 16 (3.59%) Scrum Master
11 15 (3.36%) AWS Engineer
11 15 (3.36%) Technical Analyst
11 15 (3.36%) Technical Business Analyst
12 14 (3.14%) Administrator
12 14 (3.14%) Consultant
12 14 (3.14%) Data Engineer
13 13 (2.91%) AWS DevOps
14 12 (2.69%) AWS DevOps Engineer
Libraries, Frameworks & Software Standards
1 37 (8.30%) REST
2 31 (6.95%) AngularJS
3 30 (6.73%) LDAP
4 25 (5.61%) .NET
5 24 (5.38%) Kafka
6 23 (5.16%) HTML
6 23 (5.16%) JSON
7 22 (4.93%) RabbitMQ
7 22 (4.93%) Web Services
8 21 (4.71%) SOAP
9 20 (4.48%) React
10 15 (3.36%) Apache NiFi
10 15 (3.36%) HTML5
11 13 (2.91%) SAML
12 12 (2.69%) Apache Camel
12 12 (2.69%) JDBC
12 12 (2.69%) jQuery
12 12 (2.69%) ODBC
13 11 (2.47%) CSS
13 11 (2.47%) RESTful
Miscellaneous
1 50 (11.21%) Product Ownership
2 21 (4.71%) Onboarding
3 15 (3.36%) Management Information System
4 14 (3.14%) Cloud Native
4 14 (3.14%) Replication
5 12 (2.69%) Data Centre
6 11 (2.47%) Equities
7 10 (2.24%) Analytical Mindset
7 10 (2.24%) Derivative
8 9 (2.02%) NHS
9 8 (1.79%) Data Protection Act
9 8 (1.79%) PMI
10 7 (1.57%) Fixed Income
10 7 (1.57%) Legacy Systems
11 6 (1.35%) Enterprise Software
11 6 (1.35%) Foreign Exchange (FX)
11 6 (1.35%) Mobile App
11 6 (1.35%) PKI
11 6 (1.35%) SWIFT Messaging Network
11 6 (1.35%) Virtual Team
Operating Systems
1 56 (12.56%) Linux
2 28 (6.28%) Windows
3 20 (4.48%) Unix
4 13 (2.91%) VMS
5 11 (2.47%) Ubuntu
6 10 (2.24%) Amazon Linux
7 6 (1.35%) Android
8 2 (0.45%) Apple iOS
8 2 (0.45%) Windows Server
9 1 (0.22%) CentOS
9 1 (0.22%) Debian
9 1 (0.22%) FreeRTOS
9 1 (0.22%) Mac OS
9 1 (0.22%) Red Hat Enterprise Linux
9 1 (0.22%) zOS
Processes & Methodologies
1 303 (67.94%) Agile
2 135 (30.27%) Scrum
3 109 (24.44%) DevOps
4 94 (21.08%) Problem-Solving
5 91 (20.40%) Stakeholder Management
6 78 (17.49%) CI/CD
7 67 (15.02%) Stakeholder Engagement
8 64 (14.35%) User Stories
9 62 (13.90%) Continuous Improvement
10 61 (13.68%) Roadmaps
11 55 (12.33%) Project Management
12 54 (12.11%) Microservices
13 52 (11.66%) Change Management
13 52 (11.66%) Migration
14 47 (10.54%) User Acceptance Testing
15 39 (8.74%) Workshop Facilitation
16 38 (8.52%) Kanban
16 38 (8.52%) Risk Management
17 37 (8.30%) SDLC
17 37 (8.30%) Test Automation
Programming Languages
1 75 (16.82%) Python
1 75 (16.82%) SQL
2 51 (11.43%) Java
3 33 (7.40%) JavaScript
4 18 (4.04%) TypeScript
5 16 (3.59%) PowerShell
6 13 (2.91%) C#
7 12 (2.69%) Bash
7 12 (2.69%) Go
8 11 (2.47%) Groovy
9 6 (1.35%) Kotlin
10 5 (1.12%) Apex Code
10 5 (1.12%) C++
11 2 (0.45%) C
11 2 (0.45%) Korn
11 2 (0.45%) PHP
11 2 (0.45%) R
12 1 (0.22%) VB.NET
12 1 (0.22%) VBA
12 1 (0.22%) XPath
Qualifications
1 126 (28.25%) Security Cleared
2 124 (27.80%) SC Cleared
3 68 (15.25%) Degree
4 22 (4.93%) PMI Certification
5 19 (4.26%) BPSS Clearance
6 17 (3.81%) DV Cleared
7 15 (3.36%) PMP
8 12 (2.69%) AWS Certification
8 12 (2.69%) CISSP
9 10 (2.24%) Azure Certification
10 9 (2.02%) Computer Science Degree
11 7 (1.57%) CBAP
11 7 (1.57%) ISTQB
12 6 (1.35%) CESG Certified Professional
12 6 (1.35%) CFA
12 6 (1.35%) CSPO
13 5 (1.12%) ISTQB Foundation Certification
14 3 (0.67%) Cisco Certification
14 3 (0.67%) ITIL Certification
14 3 (0.67%) Six Sigma Green Belt
Quality Assurance & Compliance
1 49 (10.99%) QA
2 15 (3.36%) GDPR
3 13 (2.91%) Accessibility
4 9 (2.02%) PMO
5 8 (1.79%) Data Quality
6 5 (1.12%) GRC
6 5 (1.12%) ISO/IEC 27001
6 5 (1.12%) SEPA
7 4 (0.90%) ISO 20022
7 4 (0.90%) NCSC
8 3 (0.67%) ITGC
8 3 (0.67%) PCI DSS
8 3 (0.67%) PSD2
8 3 (0.67%) Solvency II
8 3 (0.67%) WCAG
9 2 (0.45%) FIPS 140-2
9 2 (0.45%) MiFID
9 2 (0.45%) NIST
10 1 (0.22%) Cyber Essentials
10 1 (0.22%) Software Quality Assurance
System Software
1 55 (12.33%) Docker
2 12 (2.69%) Active Directory
3 10 (2.24%) DFS Replication
3 10 (2.24%) Dovecot
3 10 (2.24%) Postfix
3 10 (2.24%) Squid
4 6 (1.35%) VMware Infrastructure
5 3 (0.67%) Microsoft App-V
6 2 (0.45%) vSphere
7 1 (0.22%) Embedded Firmware
7 1 (0.22%) etcd
7 1 (0.22%) Firmware
7 1 (0.22%) Virtual Desktop
7 1 (0.22%) Virtual Machines
7 1 (0.22%) VirtualBox
7 1 (0.22%) VMware NSX
Systems Management
1 49 (10.99%) Kubernetes
1 49 (10.99%) Terraform
2 22 (4.93%) Packer
3 21 (4.71%) Consul
4 18 (4.04%) Grafana
5 16 (3.59%) Ansible
6 14 (3.14%) Single Sign-On
7 13 (2.91%) Prometheus
8 10 (2.24%) Nessus
8 10 (2.24%) Proxmox
9 4 (0.90%) Puppet
10 3 (0.67%) Ambari
10 3 (0.67%) HP ALM
10 3 (0.67%) Istio
10 3 (0.67%) RSA Archer
10 3 (0.67%) ZABBIX
11 2 (0.45%) Argo
12 1 (0.22%) ITRS Geneos
12 1 (0.22%) Opsgenie
12 1 (0.22%) Progress Chef
Vendors
1 48 (10.76%) Microsoft
2 47 (10.54%) ServiceNow
3 30 (6.73%) Atlassian
4 24 (5.38%) Salesforce
5 15 (3.36%) HP
5 15 (3.36%) Oracle
6 14 (3.14%) Remedy
7 13 (2.91%) Cloudera
7 13 (2.91%) Foundry
7 13 (2.91%) Google
7 13 (2.91%) Palantir
8 12 (2.69%) BMC
8 12 (2.69%) Ivanti
8 12 (2.69%) SAP
9 10 (2.24%) Jaspersoft
10 9 (2.02%) Splunk
11 7 (1.57%) Adobe
11 7 (1.57%) DocuSign
11 7 (1.57%) Duck Creek
11 7 (1.57%) VMware