Stakeholder Management Contract Job Trends in London

Stakeholder Management
England > London

The table below provides summary statistics and contractor rates for jobs advertised in London requiring Stakeholder Management skills. It covers contract job vacancies from the 6 months leading up to 26 November 2025, with comparisons to the same periods in the previous two years.

6 months to
26 Nov 2025
Same period 2024 Same period 2023
Rank 16 24 19
Rank change year-on-year +8 -5 -2
Contract jobs citing Stakeholder Management 1,735 1,252 1,696
As % of all contract jobs in London 12.22% 7.92% 8.62%
As % of the Processes & Methodologies category 13.25% 8.84% 9.60%
Number of daily rates quoted 1,171 793 1,225
10th Percentile £380 £400 £407
25th Percentile £462 £463 £495
Median daily rate (50th Percentile) £550 £550 £575
Median % change year-on-year - -4.35% -
75th Percentile £675 £650 £688
90th Percentile £775 £775 £785
England median daily rate £531 £550 £550
% change year-on-year -3.41% - -
Number of hourly rates quoted 22 17 12
10th Percentile £17.32 £31.40 £25.54
25th Percentile £23.94 - £39.86
Median hourly rate £34.00 £35.00 £57.50
Median % change year-on-year -2.86% -39.13% -7.26%
75th Percentile £41.92 £39.04 £65.03
90th Percentile £72.25 £62.25 £71.76
England median hourly rate £47.50 £57.50 £51.24
% change year-on-year -17.39% +12.22% -4.57%

All Process and Methodology Skills
London

Stakeholder Management falls under the Processes and Methodologies category. For comparison with the information above, the following table provides summary statistics for all contract job vacancies requiring process or methodology skills in London.

Contract vacancies with a requirement for process or methodology skills 13,095 14,155 17,663
As % of all contract IT jobs advertised in London 92.23% 89.55% 89.72%
Number of daily rates quoted 8,599 9,136 12,670
10th Percentile £335 £350 £355
25th Percentile £425 £450 £460
Median daily rate (50th Percentile) £530 £550 £568
Median % change year-on-year -3.64% -3.08% -3.81%
75th Percentile £650 £675 £688
90th Percentile £775 £799 £799
England median daily rate £505 £525 £545
% change year-on-year -3.81% -3.67% -0.91%
Number of hourly rates quoted 255 171 240
10th Percentile £18.09 £17.25 £18.56
25th Percentile £24.50 £24.15 £21.50
Median hourly rate £29.50 £37.50 £35.96
Median % change year-on-year -21.33% +4.30% -7.81%
75th Percentile £47.63 £55.88 £60.00
90th Percentile £68.62 £80.75 £75.13
England median hourly rate £25.15 £36.00 £45.00
% change year-on-year -30.14% -20.00% +25.00%

Stakeholder Management
Job Vacancy Trend in London

Historical trend showing the proportion of contract IT job postings citing Stakeholder Management relative to all contract IT jobs advertised in London.
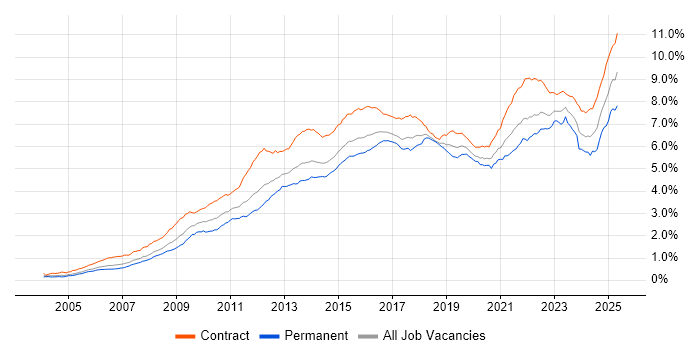
Stakeholder Management job vacancy trend in London

Stakeholder Management
Daily Rate Trend in London

Contractor daily rate distribution trend for jobs in London citing Stakeholder Management.

Contractor daily rate distribution trend for jobs in London citing Stakeholder Management

Stakeholder Management
Daily Rate Histogram in London

Daily rate distribution for jobs citing Stakeholder Management in London over the 6 months to 26 November 2025.

Daily rate histogram for Stakeholder Management in London

Stakeholder Management
Hourly Rate Trend in London

Contractor hourly rate distribution trend for jobs in London citing Stakeholder Management.

Contractor hourly rate distribution trend for jobs in London citing Stakeholder Management

Stakeholder Management
Hourly Rate Histogram in London

Hourly rate distribution of jobs citing Stakeholder Management in London over the 6 months to 26 November 2025.

Hourly rate histogram for Stakeholder Management in London

Stakeholder Management
Contract Job Locations in London

The table below looks at the demand and provides a guide to the median contractor rates quoted in IT jobs citing Stakeholder Management within the London region over the 6 months to 26 November 2025. The 'Rank Change' column provides an indication of the change in demand within each location based on the same 6 month period last year.

Location Rank Change
on Same Period
Last Year
Matching
Contract
IT Job Ads
Median
Daily Rate
Past 6 Months
Median Daily Rate
% Change
on Same Period
Last Year
Live
Jobs
Central London +10 252 £550 -8.33% 96
West London +7 26 £500 +7.53% 15
South London -24 10 £566 -5.75% 7
East London +13 9 £675 +37.06% 13
North London +2 3 £700 +72.84% 2
Stakeholder Management
England

Stakeholder Management
Co-Occurring Skills & Capabilities in London by Category

The following tables expand on the one above by listing co-occurrences grouped by category. They cover the same employment type, locality and period, with up to 20 co-occurrences shown in each category:

Application Platforms
1 92 (5.30%) Confluence
2 41 (2.36%) SharePoint
3 19 (1.10%) CMS
4 9 (0.52%) Microsoft Exchange
5 6 (0.35%) Anypoint
6 4 (0.23%) Apache Airflow
6 4 (0.23%) Apache Spark
6 4 (0.23%) Appian
6 4 (0.23%) Camunda
7 3 (0.17%) Adobe Experience Manager
7 3 (0.17%) Jupyter
7 3 (0.17%) NServiceBus
8 2 (0.12%) Apache
8 2 (0.12%) Drupal
8 2 (0.12%) Headless CMS
8 2 (0.12%) nginx
8 2 (0.12%) SAS
8 2 (0.12%) Tomcat
8 2 (0.12%) WordPress
9 1 (0.058%) WebSphere
Applications
1 79 (4.55%) Microsoft Excel
2 41 (2.36%) Microsoft Office
3 39 (2.25%) Microsoft Project
4 38 (2.19%) Microsoft PowerPoint
5 34 (1.96%) MS Visio
6 11 (0.63%) Trello
7 7 (0.40%) Adobe XD
7 7 (0.40%) Chatbot
7 7 (0.40%) Sketch
8 6 (0.35%) Spreadsheet
9 1 (0.058%) Adobe After Effects
9 1 (0.058%) Autodesk Smoke
9 1 (0.058%) EPLAN
9 1 (0.058%) GNU Octave
9 1 (0.058%) InVision
9 1 (0.058%) Notion
Business Applications
1 78 (4.50%) SAP S/4HANA
2 26 (1.50%) Dynamics CRM
2 26 (1.50%) Endur
3 12 (0.69%) Aladdin
4 7 (0.40%) Loan IQ
4 7 (0.40%) Workday HCM
5 6 (0.35%) Oracle Payables
6 5 (0.29%) SAP ERP
6 5 (0.29%) Shopify
7 4 (0.23%) Remedy ITSM
7 4 (0.23%) Salesforce CRM
7 4 (0.23%) SAP HCM
7 4 (0.23%) SAP HR
7 4 (0.23%) SAP IBP
7 4 (0.23%) SAP MDG
7 4 (0.23%) SAP Oil and Gas
7 4 (0.23%) Workfront
8 3 (0.17%) Oracle Financials
8 3 (0.17%) Oracle Procure-to-Pay
8 3 (0.17%) Oracle Receivables
Cloud Services
1 245 (14.12%) Azure
2 154 (8.88%) AWS
3 146 (8.41%) Power Platform
4 60 (3.46%) GCP
4 60 (3.46%) SaaS
5 49 (2.82%) Azure DevOps
6 40 (2.31%) Microsoft 365
7 33 (1.90%) Dynamics 365
8 25 (1.44%) Power Automate
9 24 (1.38%) Snowflake
10 23 (1.33%) Entra ID
11 22 (1.27%) PowerApps
12 19 (1.10%) Serverless
13 16 (0.92%) Azure Data Factory
13 16 (0.92%) GitHub
14 15 (0.86%) SuccessFactors
15 14 (0.81%) Microsoft Copilot
16 13 (0.75%) Collibra
17 12 (0.69%) Microsoft Purview
18 11 (0.63%) Azure Synapse Analytics
Communications & Networking
1 37 (2.13%) Firewall
2 15 (0.86%) WAN
3 13 (0.75%) Network Security
4 11 (0.63%) LAN
4 11 (0.63%) SD-WAN
5 9 (0.52%) VPN
6 8 (0.46%) Wi-Fi
7 7 (0.40%) DNS
7 7 (0.40%) VoIP
8 6 (0.35%) DHCP
8 6 (0.35%) Internet
9 5 (0.29%) BGP
9 5 (0.29%) CTI
10 4 (0.23%) 5G
10 4 (0.23%) Broadband
10 4 (0.23%) Cisco ASA
10 4 (0.23%) OSPF
11 3 (0.17%) Cisco IOS
11 3 (0.17%) Cisco IPT
11 3 (0.17%) NX-OS
Database & Business Intelligence
1 127 (7.32%) Power BI
2 36 (2.07%) Data Warehouse
2 36 (2.07%) Tableau
3 28 (1.61%) Metadata
4 20 (1.15%) Data Lake
5 13 (0.75%) BigQuery
6 12 (0.69%) Big Data
7 10 (0.58%) Relational Database
8 8 (0.46%) SQL Server
9 6 (0.35%) Amazon Athena
10 5 (0.29%) Amazon RDS
10 5 (0.29%) Amazon Redshift
10 5 (0.29%) NoSQL
10 5 (0.29%) Power Query
10 5 (0.29%) SAP BW
11 4 (0.23%) Azure SQL Database
11 4 (0.23%) DB2
11 4 (0.23%) DynamoDB
11 4 (0.23%) Mixpanel
12 3 (0.17%) Tableau Server
Development Applications
1 181 (10.43%) JIRA
2 18 (1.04%) GitLab
3 15 (0.86%) Git
3 15 (0.86%) Jenkins
4 8 (0.46%) Selenium
5 7 (0.40%) Axure RP
5 7 (0.40%) SonarQube
6 6 (0.35%) MLflow
7 5 (0.29%) Gradle
7 5 (0.29%) Maven
8 4 (0.23%) Appium
8 4 (0.23%) SpecFlow
9 3 (0.17%) Atlassian Bamboo
9 3 (0.17%) REST Assured
9 3 (0.17%) TestRail
10 2 (0.12%) Cypress.io
10 2 (0.12%) GCC
10 2 (0.12%) JUnit
10 2 (0.12%) Mockito
10 2 (0.12%) NUnit
General
1 914 (52.68%) Social Skills
2 646 (37.23%) Finance
3 284 (16.37%) Analytical Skills
4 183 (10.55%) Banking
5 145 (8.36%) Public Sector
6 103 (5.94%) Marketing
7 92 (5.30%) Retail
8 86 (4.96%) Legal
9 75 (4.32%) Front Office
10 69 (3.98%) Influencing Skills
11 52 (3.00%) Investment Banking
12 50 (2.88%) Organisational Skills
12 50 (2.88%) Presentation Skills
13 43 (2.48%) Telecoms
14 36 (2.07%) Inclusion and Diversity
15 35 (2.02%) Financial Institution
15 35 (2.02%) Manufacturing
16 34 (1.96%) Documentation Skills
16 34 (1.96%) Law
17 29 (1.67%) Back Office
Job Titles
1 375 (21.61%) Analyst
2 282 (16.25%) Business Analyst
3 262 (15.10%) Project Manager
4 181 (10.43%) Lead
5 168 (9.68%) Architect
6 155 (8.93%) Senior
7 120 (6.92%) Consultant
8 70 (4.03%) Solutions Architect
9 61 (3.52%) Senior Manager
10 60 (3.46%) Programme Manager
11 57 (3.29%) Developer
12 50 (2.88%) IT Manager
13 43 (2.48%) Data Analyst
13 43 (2.48%) Senior Analyst
14 42 (2.42%) Product Manager
15 41 (2.36%) Delivery Manager
16 35 (2.02%) Senior Business Analyst
16 35 (2.02%) Senior Project Manager
17 33 (1.90%) Product Owner
18 30 (1.73%) Change Manager
Libraries, Frameworks & Software Standards
1 25 (1.44%) REST
2 22 (1.27%) .NET
3 21 (1.21%) HTML
4 19 (1.10%) Kafka
5 16 (0.92%) Oracle Fusion
6 15 (0.86%) CSS
7 14 (0.81%) Middleware
8 9 (0.52%) AngularJS
9 8 (0.46%) JSON
9 8 (0.46%) OAuth
9 8 (0.46%) React
9 8 (0.46%) Web Services
10 7 (0.40%) Plotly
10 7 (0.40%) SOAP
11 6 (0.35%) Pandas
11 6 (0.35%) RESTful
11 6 (0.35%) SailPoint
12 5 (0.29%) HTML5 Canvas
12 5 (0.29%) OpenID
12 5 (0.29%) Vue
Miscellaneous
1 130 (7.49%) Product Ownership
2 63 (3.63%) Onboarding
3 55 (3.17%) Management Information System
4 42 (2.42%) Cloud Native
5 40 (2.31%) Analytical Mindset
5 40 (2.31%) Legacy Systems
6 35 (2.02%) Reinsurance
7 34 (1.96%) Data Centre
8 33 (1.90%) Data Protection Act
9 29 (1.67%) PMI
10 25 (1.44%) Fixed Income
11 22 (1.27%) Derivative
11 22 (1.27%) Hybrid Cloud
12 21 (1.21%) Greenfield Project
13 17 (0.98%) Foreign Exchange (FX)
13 17 (0.98%) Renewable Energy
14 16 (0.92%) Equities
15 15 (0.86%) Life Science
15 15 (0.86%) Marketing Technology
16 14 (0.81%) Enterprise Software
Operating Systems
1 37 (2.13%) Windows
2 14 (0.81%) Linux
3 13 (0.75%) Windows Server
4 9 (0.52%) Android
4 9 (0.52%) Unix
5 8 (0.46%) Apple iOS
6 5 (0.29%) Windows 10
7 3 (0.17%) VMS
8 1 (0.058%) Red Hat Enterprise Linux
8 1 (0.058%) Solaris
Processes & Methodologies
1 562 (32.39%) Agile
2 306 (17.64%) Problem-Solving
3 269 (15.50%) Project Management
4 225 (12.97%) Stakeholder Engagement
5 204 (11.76%) Continuous Improvement
5 204 (11.76%) Migration
6 201 (11.59%) Roadmaps
7 186 (10.72%) Project Delivery
8 180 (10.37%) Change Management
9 173 (9.97%) Risk Management
10 168 (9.68%) Analytics
11 146 (8.41%) Business Intelligence
11 146 (8.41%) Decision-Making
11 146 (8.41%) Requirements Gathering
12 138 (7.95%) Workshop Facilitation
13 134 (7.72%) DevOps
14 133 (7.67%) Scrum
15 130 (7.49%) AI
16 125 (7.20%) Business Analysis
17 122 (7.03%) User Acceptance Testing
Programming Languages
1 160 (9.22%) SQL
2 127 (7.32%) Python
3 42 (2.42%) Java
4 34 (1.96%) C#
5 29 (1.67%) JavaScript
6 26 (1.50%) PowerShell
7 16 (0.92%) R
8 13 (0.75%) TypeScript
9 10 (0.58%) Data Analysis Expressions
9 10 (0.58%) Korn
10 8 (0.46%) Bash
11 7 (0.40%) C++
12 6 (0.35%) VBA
13 5 (0.29%) Bicep
14 4 (0.23%) ABAP
14 4 (0.23%) PL/SQL
15 3 (0.17%) PHP
15 3 (0.17%) Shell Script
16 2 (0.12%) Perl
16 2 (0.12%) T-SQL
Qualifications
1 192 (11.07%) Security Cleared
2 164 (9.45%) Degree
3 147 (8.47%) SC Cleared
4 93 (5.36%) PMI Certification
5 77 (4.44%) PMP
6 34 (1.96%) Master's Degree
7 31 (1.79%) CISSP
8 23 (1.33%) Computer Science Degree
9 22 (1.27%) BPSS Clearance
10 21 (1.21%) DV Cleared
11 16 (0.92%) CISM
12 15 (0.86%) Azure Certification
13 13 (0.75%) CBAP
13 13 (0.75%) CIMA
13 13 (0.75%) ISTQB
13 13 (0.75%) ITIL Certification
14 12 (0.69%) ACCA
15 11 (0.63%) Microsoft Certification
16 10 (0.58%) Cisco Certification
16 10 (0.58%) FFIEC
Quality Assurance & Compliance
1 106 (6.11%) QA
2 94 (5.42%) GDPR
3 63 (3.63%) Data Quality
4 53 (3.05%) PMO
5 40 (2.31%) ISO/IEC 27001
6 32 (1.84%) NIST
7 28 (1.61%) Sarbanes-Oxley
8 26 (1.50%) Accessibility
8 26 (1.50%) GRC
9 20 (1.15%) MiFID
10 17 (0.98%) PCI DSS
11 16 (0.92%) IFRS
12 12 (0.69%) EMIR
12 12 (0.69%) SLA
13 10 (0.58%) NCSC
13 10 (0.58%) Solvency II
14 9 (0.52%) HIPAA
14 9 (0.52%) ISO/IEC 27005
15 8 (0.46%) Cyber Essentials
16 6 (0.35%) California Consumer Privacy Act
System Software
1 23 (1.33%) Docker
2 17 (0.98%) Active Directory
3 6 (0.35%) VMware Infrastructure
4 1 (0.058%) Firmware
4 1 (0.058%) IAG
4 1 (0.058%) Postfix
4 1 (0.058%) Virtual Desktop
4 1 (0.058%) Virtual Machines
Systems Management
1 33 (1.90%) Terraform
2 27 (1.56%) Kubernetes
3 8 (0.46%) Ansible
4 7 (0.40%) FortiGate
4 7 (0.40%) HP ALM
4 7 (0.40%) Microsoft Intune
4 7 (0.40%) Single Sign-On
5 4 (0.23%) Argo
5 4 (0.23%) Kubeflow
6 3 (0.17%) RSA Archer
7 2 (0.12%) Consul
7 2 (0.12%) Grafana
7 2 (0.12%) Packer
7 2 (0.12%) Prometheus
7 2 (0.12%) SCCM
8 1 (0.058%) NetBackup
8 1 (0.058%) SCOM
8 1 (0.058%) Thomson Reuters DACS
Vendors
1 214 (12.33%) Microsoft
2 158 (9.11%) SAP
3 72 (4.15%) Salesforce
4 71 (4.09%) Oracle
5 46 (2.65%) Workday
6 45 (2.59%) ServiceNow
7 36 (2.07%) Databricks
8 35 (2.02%) Google
9 23 (1.33%) Adobe
10 18 (1.04%) Ariba
11 16 (0.92%) MuleSoft
12 15 (0.86%) Cisco
13 14 (0.81%) Bloomberg
14 12 (0.69%) Fortinet
14 12 (0.69%) IBM
15 10 (0.58%) Informatica
15 10 (0.58%) Murex
15 10 (0.58%) OpenLink
16 9 (0.52%) CyberArk
16 9 (0.52%) OpenAI