Decision-Making Contract Job Trends in London

Decision-Making
England > London

The table below provides summary statistics and contractor rates for jobs advertised in London requiring Decision-Making skills. It covers contract job vacancies from the 6 months leading up to 7 November 2025, with comparisons to the same periods in the previous two years.

6 months to
7 Nov 2025
Same period 2024 Same period 2023
Rank 48 83 78
Rank change year-on-year +35 -5 +9
Contract jobs citing Decision-Making 708 473 576
As % of all contract jobs in London 5.09% 3.01% 2.85%
As % of the Processes & Methodologies category 5.50% 3.38% 3.17%
Number of daily rates quoted 466 294 406
10th Percentile £347 £363 £360
25th Percentile £425 £463 £451
Median daily rate (50th Percentile) £545 £588 £550
Median % change year-on-year -7.23% +6.82% -8.33%
75th Percentile £656 £689 £650
90th Percentile £773 £809 £749
England median daily rate £513 £550 £550
% change year-on-year -6.82% - -
Number of hourly rates quoted 16 8 15
10th Percentile - £29.90 £35.00
25th Percentile £18.25 £31.81 £35.44
Median hourly rate £31.49 £36.25 £43.86
Median % change year-on-year -13.13% -17.35% -16.45%
75th Percentile £36.35 £45.00 £61.88
90th Percentile £42.54 £52.35 £67.29
England median hourly rate £26.12 £36.25 £46.18
% change year-on-year -27.94% -21.50% +54.32%

All Process and Methodology Skills
London

Decision-Making falls under the Processes and Methodologies category. For comparison with the information above, the following table provides summary statistics for all contract job vacancies requiring process or methodology skills in London.

Contract vacancies with a requirement for process or methodology skills 12,862 13,995 18,142
As % of all contract IT jobs advertised in London 92.47% 89.11% 89.73%
Number of daily rates quoted 8,472 9,006 13,076
10th Percentile £331 £350 £358
25th Percentile £425 £450 £463
Median daily rate (50th Percentile) £540 £550 £575
Median % change year-on-year -1.82% -4.35% -2.13%
75th Percentile £663 £675 £688
90th Percentile £775 £799 £800
England median daily rate £509 £525 £550
% change year-on-year -3.05% -4.55% -
Number of hourly rates quoted 259 165 238
10th Percentile £17.98 £17.35 £18.50
25th Percentile £25.01 £25.00 £21.25
Median hourly rate £30.00 £38.07 £37.50
Median % change year-on-year -21.20% +1.52% -
75th Percentile £46.88 £58.75 £61.31
90th Percentile £65.00 £80.45 £77.50
England median hourly rate £25.15 £37.50 £44.50
% change year-on-year -32.93% -15.73% +27.14%

Decision-Making
Job Vacancy Trend in London

Historical trend showing the proportion of contract IT job postings citing Decision-Making relative to all contract IT jobs advertised in London.
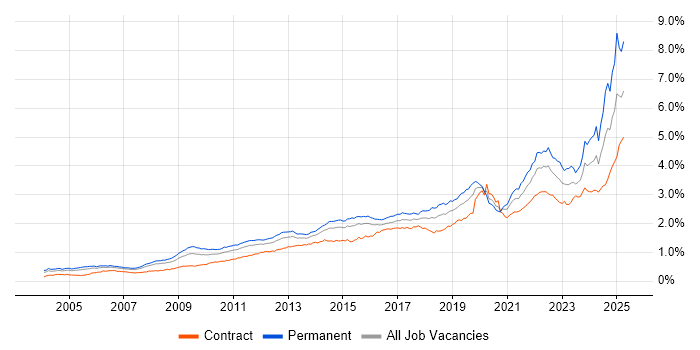
Decision-Making job vacancy trend in London

Decision-Making
Daily Rate Trend in London

Contractor daily rate distribution trend for jobs in London citing Decision-Making.

Contractor daily rate distribution trend for jobs in London citing Decision-Making

Decision-Making
Daily Rate Histogram in London

Daily rate distribution for jobs citing Decision-Making in London over the 6 months to 7 November 2025.

Daily rate histogram for Decision-Making in London

Decision-Making
Hourly Rate Trend in London

Contractor hourly rate distribution trend for jobs in London citing Decision-Making.

Contractor hourly rate distribution trend for jobs in London citing Decision-Making

Decision-Making
Hourly Rate Histogram in London

Hourly rate distribution of jobs citing Decision-Making in London over the 6 months to 7 November 2025.

Hourly rate histogram for Decision-Making in London

Decision-Making
Contract Job Locations in London

The table below looks at the demand and provides a guide to the median contractor rates quoted in IT jobs citing Decision-Making within the London region over the 6 months to 7 November 2025. The 'Rank Change' column provides an indication of the change in demand within each location based on the same 6 month period last year.

Location Rank Change
on Same Period
Last Year
Matching
Contract
IT Job Ads
Median
Daily Rate
Past 6 Months
Median Daily Rate
% Change
on Same Period
Last Year
Live
Jobs
Central London +5 92 £550 - 810
West London -4 13 £525 -15.15% 43
South London -19 3 £653 +8.75% 9
East London +3 2 £575 +72.93% 22
North London +3 1 £650 - 4
Decision-Making
England

Decision-Making
Co-Occurring Skills & Capabilities in London by Category

The following tables expand on the one above by listing co-occurrences grouped by category. They cover the same employment type, locality and period, with up to 20 co-occurrences shown in each category:

Application Platforms
1 31 (4.38%) Confluence
2 15 (2.12%) SharePoint
3 14 (1.98%) Apache Airflow
4 12 (1.69%) Apache Spark
5 7 (0.99%) CMS
6 4 (0.56%) Jupyter
7 3 (0.42%) Apache
7 3 (0.42%) Headless CMS
8 2 (0.28%) Appian
8 2 (0.28%) ArcGIS
8 2 (0.28%) nginx
8 2 (0.28%) SAS
9 1 (0.14%) Adobe Experience Manager
9 1 (0.14%) Apache Pig
9 1 (0.14%) Apache Superset
9 1 (0.14%) Camunda
9 1 (0.14%) Microsoft Exchange
9 1 (0.14%) Sitecore CMS
9 1 (0.14%) WebSphere
9 1 (0.14%) WebSphere Application Server
Applications
1 80 (11.30%) Microsoft Excel
2 27 (3.81%) Microsoft Office
3 25 (3.53%) Microsoft PowerPoint
4 18 (2.54%) Microsoft Project
5 10 (1.41%) MS Visio
6 4 (0.56%) Chatbot
7 3 (0.42%) Trello
8 2 (0.28%) Oracle Smart View
9 1 (0.14%) EPLAN
9 1 (0.14%) Notion
9 1 (0.14%) Sketch
9 1 (0.14%) SPSS
9 1 (0.14%) Zeplin
Business Applications
1 13 (1.84%) SAP S/4HANA
2 5 (0.71%) Oracle EBS
3 4 (0.56%) Oracle Payroll
3 4 (0.56%) SAP IBP
4 3 (0.42%) Dynamics CRM
4 3 (0.42%) Eloqua
4 3 (0.42%) NetSuite
4 3 (0.42%) SAP HR
5 2 (0.28%) Endur
5 2 (0.28%) Shopify
6 1 (0.14%) Dynamics AX
6 1 (0.14%) Markit EDM
6 1 (0.14%) Oracle Financials
6 1 (0.14%) Salesforce CRM
6 1 (0.14%) SAP CO
6 1 (0.14%) SAP FI
6 1 (0.14%) SAP FI/CO
6 1 (0.14%) SAP HCM
6 1 (0.14%) SAP Oil and Gas
6 1 (0.14%) SAP PS
Cloud Services
1 129 (18.22%) Power Platform
2 94 (13.28%) Azure
3 84 (11.86%) AWS
4 42 (5.93%) GCP
5 31 (4.38%) SaaS
6 24 (3.39%) Snowflake
7 23 (3.25%) GitHub
8 19 (2.68%) dbt
9 18 (2.54%) Microsoft 365
10 12 (1.69%) Azure Synapse Analytics
11 11 (1.55%) Azure Data Factory
11 11 (1.55%) GitHub Actions
12 10 (1.41%) Amazon S3
12 10 (1.41%) ChatGPT
13 9 (1.27%) Azure DevOps
13 9 (1.27%) GitHub Copilot
13 9 (1.27%) PaaS
14 8 (1.13%) Dynamics 365
15 7 (0.99%) Microsoft Copilot
15 7 (0.99%) Serverless
Communications & Networking
1 6 (0.85%) TCP/IP
2 5 (0.71%) Multicast
3 4 (0.56%) tcpdump
3 4 (0.56%) Wireshark
4 3 (0.42%) Firewall
5 2 (0.28%) 5G
5 2 (0.28%) Broadband
5 2 (0.28%) Internet
5 2 (0.28%) ISDN
5 2 (0.28%) PSTN
5 2 (0.28%) Softphone
5 2 (0.28%) SSL
5 2 (0.28%) VPN
5 2 (0.28%) Wireless
6 1 (0.14%) DHCP
6 1 (0.14%) DKIM
6 1 (0.14%) DMARC
6 1 (0.14%) NGFW
6 1 (0.14%) SMS
6 1 (0.14%) WAN
Database & Business Intelligence
1 124 (17.51%) Power BI
2 50 (7.06%) Data Warehouse
3 44 (6.21%) Tableau
4 25 (3.53%) Metadata
5 20 (2.82%) Relational Database
6 19 (2.68%) Big Data
6 19 (2.68%) PostgreSQL
7 18 (2.54%) Data Lake
8 17 (2.40%) SQL Server
9 16 (2.26%) Power Query
10 13 (1.84%) Looker
11 12 (1.69%) Hadoop
11 12 (1.69%) Star Schema
12 11 (1.55%) BigQuery
13 10 (1.41%) SQL Server Integration Services
14 9 (1.27%) Amazon Redshift
15 8 (1.13%) Apache Hive
15 8 (1.13%) Data Vault
15 8 (1.13%) Oracle Reports
16 7 (0.99%) Oracle Database
Development Applications
1 45 (6.36%) JIRA
2 25 (3.53%) Git
3 12 (1.69%) Jenkins
4 8 (1.13%) GitLab
5 6 (0.85%) SonarQube
6 5 (0.71%) TeamCity
7 4 (0.56%) Maven
8 3 (0.42%) Selenium
8 3 (0.42%) Sonatype Nexus
9 2 (0.28%) Cucumber
9 2 (0.28%) Robot Framework
9 2 (0.28%) Terragrunt
10 1 (0.14%) Bitbucket Server
10 1 (0.14%) DbUnit
10 1 (0.14%) jMock
10 1 (0.14%) Liquibase
10 1 (0.14%) MLflow
10 1 (0.14%) Mockito
10 1 (0.14%) Postman
10 1 (0.14%) Team Foundation Server
General
1 291 (41.10%) Social Skills
2 258 (36.44%) Finance
3 230 (32.49%) Analytical Skills
4 103 (14.55%) Banking
5 92 (12.99%) Public Sector
6 46 (6.50%) Marketing
7 37 (5.23%) Influencing Skills
8 32 (4.52%) Presentation Skills
9 29 (4.10%) Legal
10 28 (3.95%) Front Office
11 27 (3.81%) Financial Institution
11 27 (3.81%) Retail
12 23 (3.25%) Investment Banking
12 23 (3.25%) Publishing
13 21 (2.97%) Local Government
14 16 (2.26%) Organisational Skills
15 14 (1.98%) Back Office
15 14 (1.98%) Telecoms
16 12 (1.69%) Inclusion and Diversity
17 11 (1.55%) Pharmaceutical
Job Titles
1 160 (22.60%) Analyst
2 79 (11.16%) Business Analyst
3 76 (10.73%) Senior
4 67 (9.46%) Lead
5 60 (8.47%) Developer
6 49 (6.92%) Architect
7 44 (6.21%) Data Analyst
8 43 (6.07%) Project Manager
9 37 (5.23%) Data Engineer
10 22 (3.11%) Senior Analyst
11 19 (2.68%) Data Business Analyst
11 19 (2.68%) Data Scientist
12 18 (2.54%) Consultant
12 18 (2.54%) Senior Data Engineer
13 13 (1.84%) Data Architect
13 13 (1.84%) Product Manager
13 13 (1.84%) Senior Developer
13 13 (1.84%) Technical Analyst
14 12 (1.69%) Risk Analyst
15 11 (1.55%) Programme Manager
Libraries, Frameworks & Software Standards
1 23 (3.25%) AngularJS
2 21 (2.97%) React
3 20 (2.82%) Kafka
4 16 (2.26%) REST
5 13 (1.84%) Pandas
6 12 (1.69%) FIX Protocol
7 11 (1.55%) scikit-learn
7 11 (1.55%) XML
8 10 (1.41%) .NET
8 10 (1.41%) JSON
8 10 (1.41%) Plotly
8 10 (1.41%) RESTful
8 10 (1.41%) TensorFlow
9 9 (1.27%) NumPy
9 9 (1.27%) Oracle Fusion
9 9 (1.27%) Vue
10 8 (1.13%) PySpark
10 8 (1.13%) Ultra Messaging
11 7 (0.99%) CSS
11 7 (0.99%) Elastic Stack
Miscellaneous
1 45 (6.36%) Product Ownership
2 38 (5.37%) Management Information System
3 29 (4.10%) Analytical Mindset
4 26 (3.67%) Algorithms
5 25 (3.53%) Cloud Native
6 22 (3.11%) Self-Motivation
7 20 (2.82%) Onboarding
8 17 (2.40%) Foreign Exchange (FX)
9 15 (2.12%) Data Structures
10 13 (1.84%) Data Protection Act
10 13 (1.84%) Distributed Systems
10 13 (1.84%) Virtual Team
11 11 (1.55%) Legacy Systems
12 10 (1.41%) Reinsurance
13 9 (1.27%) Cyber Threat
13 9 (1.27%) Data Centre
13 9 (1.27%) Derivative
14 8 (1.13%) Equities
14 8 (1.13%) NHS
15 7 (0.99%) Replication
Operating Systems
1 27 (3.81%) Linux
2 15 (2.12%) Windows
3 4 (0.56%) Windows Server
4 1 (0.14%) Unix
4 1 (0.14%) Windows Server 2012
Processes & Methodologies
1 199 (28.11%) Agile
2 193 (27.26%) Problem-Solving
3 178 (25.14%) Analytics
4 142 (20.06%) Business Intelligence
5 134 (18.93%) Stakeholder Management
6 114 (16.10%) Data Analysis
7 107 (15.11%) Continuous Improvement
8 104 (14.69%) Visualisation
9 99 (13.98%) AI
9 99 (13.98%) Stakeholder Engagement
10 97 (13.70%) Data-Driven Decision Making
11 94 (13.28%) Data Modelling
12 91 (12.85%) Actionable Insight
13 86 (12.15%) Roadmaps
14 73 (10.31%) Project Management
15 68 (9.60%) Risk Management
16 63 (8.90%) Data Governance
16 63 (8.90%) Data Science
17 62 (8.76%) CI/CD
18 60 (8.47%) DevOps
Programming Languages
1 168 (23.73%) SQL
2 143 (20.20%) Python
3 27 (3.81%) Java
4 25 (3.53%) Data Analysis Expressions
5 17 (2.40%) TypeScript
6 14 (1.98%) Bash
7 13 (1.84%) C++
7 13 (1.84%) JavaScript
7 13 (1.84%) R
8 11 (1.55%) PowerShell
9 8 (1.13%) Scala
10 7 (0.99%) C#
11 6 (0.85%) Bicep
11 6 (0.85%) Korn
12 4 (0.56%) PL/SQL
12 4 (0.56%) T-SQL
13 3 (0.42%) Groovy
13 3 (0.42%) Kotlin
13 3 (0.42%) Kusto Query Language
13 3 (0.42%) Rust
Qualifications
1 87 (12.29%) Degree
2 82 (11.58%) Security Cleared
3 67 (9.46%) SC Cleared
4 22 (3.11%) Computer Science Degree
5 21 (2.97%) PMP
6 19 (2.68%) PMI Certification
7 14 (1.98%) Master's Degree
8 13 (1.84%) CIMA
9 12 (1.69%) ACCA
10 11 (1.55%) CISSP
11 6 (0.85%) CISM
12 5 (0.71%) BPSS Clearance
12 5 (0.71%) PhD
13 4 (0.56%) Azure Certification
13 4 (0.56%) MBA
13 4 (0.56%) MCP
13 4 (0.56%) Six Sigma Green Belt
14 3 (0.42%) CISA
14 3 (0.42%) DV Cleared
14 3 (0.42%) Microsoft Certification
Quality Assurance & Compliance
1 80 (11.30%) Data Quality
2 31 (4.38%) Accessibility
3 26 (3.67%) PMO
4 19 (2.68%) QA
5 18 (2.54%) GDPR
6 16 (2.26%) NIST
7 14 (1.98%) ISO/IEC 27001
8 9 (1.27%) GRC
9 7 (0.99%) EU AI Act
10 5 (0.71%) GMP
11 4 (0.56%) Actionable Recommendations
11 4 (0.56%) Cyber Essentials
12 3 (0.42%) ISO 31000
12 3 (0.42%) NCSC
12 3 (0.42%) Sarbanes-Oxley
13 2 (0.28%) COBIT
13 2 (0.28%) ISO/IEC 27005
13 2 (0.28%) PCI DSS
13 2 (0.28%) Solvency II
13 2 (0.28%) WCAG
System Software
1 28 (3.95%) Docker
2 8 (1.13%) Active Directory
3 5 (0.71%) HDFS
3 5 (0.71%) zsh
4 1 (0.14%) Postfix
Systems Management
1 31 (4.38%) Terraform
2 21 (2.97%) Kubernetes
3 13 (1.84%) Prometheus
4 12 (1.69%) ITRS Geneos
5 9 (1.27%) Grafana
6 4 (0.56%) Kibana
6 4 (0.56%) logstash
7 3 (0.42%) Ansible
7 3 (0.42%) Rancher
8 1 (0.14%) Consul
8 1 (0.14%) Microsoft Intune
8 1 (0.14%) Packer
8 1 (0.14%) RSA Archer
8 1 (0.14%) Single Sign-On
Vendors
1 83 (11.72%) Microsoft
2 35 (4.94%) SAP
3 28 (3.95%) Oracle
4 26 (3.67%) Google
5 17 (2.40%) Databricks
5 17 (2.40%) ServiceNow
6 16 (2.26%) Salesforce
7 12 (1.69%) Solace
8 9 (1.27%) TIBCO
9 8 (1.13%) Adobe
10 7 (0.99%) Dataiku
11 5 (0.71%) Foundry
11 5 (0.71%) OpenAI
12 4 (0.56%) Alteryx
12 4 (0.56%) Ariba
12 4 (0.56%) Bloomberg
12 4 (0.56%) Dynatrace
12 4 (0.56%) Informatica
12 4 (0.56%) Refinitiv
12 4 (0.56%) Xero