Configuration Management Contracts with Hybrid/Remote/WFH Options

Configuration Management
UK > Work from Home

The table below provides summary statistics for remote or hybrid contract work requiring Configuration Management skills. It includes a benchmarking guide to the contractor rates offered in vacancies that cited Configuration Management over the 6 months leading up to 3 May 2025, comparing them to the same period in the previous two years.

6 months to
3 May 2025
Same period 2024 Same period 2023
Rank 165 135 141
Rank change year-on-year -30 +6 +31
Contract jobs citing Configuration Management 142 247 446
As % of all contract jobs with a WFH option 1.43% 1.62% 1.74%
As % of the Processes & Methodologies category 1.57% 1.84% 1.94%
Number of daily rates quoted 91 179 328
10th Percentile £364 £372 £400
25th Percentile £413 £484 £463
Median daily rate (50th Percentile) £525 £550 £540
Median % change year-on-year -4.55% +1.85% -1.82%
75th Percentile £600 £609 £673
90th Percentile £653 £690 £745
UK median daily rate £525 £550 £550
% change year-on-year -4.55% - -
Number of hourly rates quoted 8 15 7
10th Percentile £55.50 £11.00 £38.73
25th Percentile £61.88 £25.66 £39.55
Median hourly rate £65.00 £60.00 £41.80
Median % change year-on-year +8.33% +43.54% -1.65%
75th Percentile £67.50 - £53.13
90th Percentile £69.00 - £66.76
UK median hourly rate £60.00 £50.00 £49.71
% change year-on-year +20.00% +0.58% +6.42%

All Process and Methodology Skills
Work from Home

Configuration Management falls under the Processes and Methodologies category. For comparison with the information above, the following table provides summary statistics for all contract job vacancies with remote or hybrid options requiring process or methodology skills.

Contract vacancies with a requirement for process or methodology skills 9,020 13,413 23,039
As % of all contract jobs with a WFH option 91.13% 87.92% 89.76%
Number of daily rates quoted 6,197 8,959 16,290
10th Percentile £340 £325 £363
25th Percentile £419 £425 £450
Median daily rate (50th Percentile) £525 £525 £540
Median % change year-on-year - -2.78% +2.86%
75th Percentile £638 £638 £650
90th Percentile £763 £750 £750
UK median daily rate £520 £525 £550
% change year-on-year -0.95% -4.55% +4.17%
Number of hourly rates quoted 221 580 529
10th Percentile £14.20 £15.17 £19.00
25th Percentile £19.75 £25.38 £30.54
Median hourly rate £39.00 £43.00 £55.00
Median % change year-on-year -9.30% -21.82% +57.14%
75th Percentile £66.50 £60.00 £68.75
90th Percentile £75.00 £75.25 £80.00
UK median hourly rate £29.00 £35.58 £36.00
% change year-on-year -18.48% -1.18% +44.00%

Configuration Management
Trend for Jobs with a WFH Option

Job vacancies with remote working options citing Configuration Management as a proportion of all IT jobs advertised.
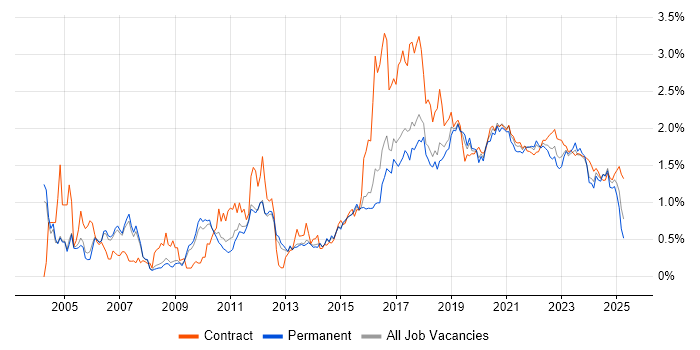
Configuration Management trend for jobs with Hybrid/Remote/WFH options

Configuration Management
Daily Rate Trend for Jobs with a WFH Option

3-month moving average daily rate quoted in job vacancies with remote working options citing Configuration Management.

Configuration Management daily rate for jobs with a WFH option

Configuration Management
Daily Rate Histogram for Jobs with a WFH Option

Daily rate distribution for jobs with remote working options citing Configuration Management over the 6 months to 3 May 2025.

Configuration Management daily rate histogram for jobs with a WFH option

Configuration Management
Hourly Rate Trend for Jobs with a WFH Option

3-month moving average hourly rate quoted in job vacancies with remote working options citing Configuration Management.

Configuration Management hourly rate for jobs with a WFH option

Configuration Management
Hourly Rate Histogram for Jobs with a WFH Option

Hourly rate distribution for jobs with remote working options citing Configuration Management over the 6 months to 3 May 2025.

Configuration Management hourly rate histogram for jobs with a WFH option

Configuration Management
Co-occurring Skills and Capabilities with WFH Options by Category

The follow tables expand on the table above by listing co-occurrences grouped by category. The same employment type, locality and period is covered with up to 20 co-occurrences shown in each of the following categories:

Application Platforms
1 2 (1.41%) JBoss
1 2 (1.41%) Microsoft Exchange
1 2 (1.41%) SharePoint
1 2 (1.41%) WebSphere
1 2 (1.41%) WebSphere Application Server
2 1 (0.70%) Apache
2 1 (0.70%) CMS
2 1 (0.70%) Confluence
2 1 (0.70%) IIS
2 1 (0.70%) nginx
2 1 (0.70%) Tomcat
Applications
1 6 (4.23%) Windchill
2 2 (1.41%) Microsoft Office
3 1 (0.70%) Chatbot
3 1 (0.70%) Microsoft Excel
3 1 (0.70%) Microsoft PowerPoint
Business Applications
1 4 (2.82%) Remedy ITSM
2 1 (0.70%) NetSuite
Cloud Services
1 48 (33.80%) AWS
1 48 (33.80%) Azure
2 17 (11.97%) AWS CloudFormation
3 15 (10.56%) GitHub
4 13 (9.15%) Amazon EKS
4 13 (9.15%) GCP
5 11 (7.75%) Amazon EC2
6 8 (5.63%) Azure DevOps
7 7 (4.93%) SaaS
8 5 (3.52%) Entra ID
8 5 (3.52%) GitHub Actions
8 5 (3.52%) Serverless
9 4 (2.82%) OpenShift
9 4 (2.82%) PaaS
10 3 (2.11%) AWS Control Tower
10 3 (2.11%) AWS Lambda
10 3 (2.11%) Azure AKS
10 3 (2.11%) Power Platform
10 3 (2.11%) PowerApps
10 3 (2.11%) Virtual Private Cloud
Communications & Networking
1 17 (11.97%) DNS
2 15 (10.56%) HTTP
3 13 (9.15%) TCP/IP
4 10 (7.04%) Firewall
5 7 (4.93%) Internet
6 5 (3.52%) DHCP
7 3 (2.11%) BGP
7 3 (2.11%) MPLS
7 3 (2.11%) SSH
8 2 (1.41%) EIGRP
8 2 (1.41%) IPv4
8 2 (1.41%) Kerberos
8 2 (1.41%) Network Security
8 2 (1.41%) NGFW
8 2 (1.41%) OSPF
8 2 (1.41%) SD-WAN
8 2 (1.41%) VPN
8 2 (1.41%) WAN
8 2 (1.41%) Wireless
9 1 (0.70%) IPv6
Database & Business Intelligence
1 10 (7.04%) Amazon RDS
2 9 (6.34%) Amazon Aurora
3 4 (2.82%) PostgreSQL
4 3 (2.11%) Big Data
5 2 (1.41%) CockroachDB
5 2 (1.41%) DB2
5 2 (1.41%) IMS/DB
5 2 (1.41%) MariaDB
5 2 (1.41%) MongoDB
5 2 (1.41%) MySQL
5 2 (1.41%) Relational Database
6 1 (0.70%) Amazon Athena
6 1 (0.70%) Apache Iceberg
6 1 (0.70%) BusinessObjects
6 1 (0.70%) Pentaho
6 1 (0.70%) Power BI
6 1 (0.70%) SQL Server
Development Applications
1 34 (23.94%) Jenkins
2 16 (11.27%) GitLab
3 13 (9.15%) JIRA
4 12 (8.45%) Git
5 8 (5.63%) SonarQube
6 7 (4.93%) Selenium
7 5 (3.52%) Cucumber
7 5 (3.52%) REST Assured
8 4 (2.82%) Bitbucket
9 3 (2.11%) CircleCI
10 2 (1.41%) Artifactory
10 2 (1.41%) JMeter
11 1 (0.70%) Atlassian Bamboo
11 1 (0.70%) Hudson
11 1 (0.70%) Octopus Deploy
11 1 (0.70%) Robot Framework
11 1 (0.70%) Sonatype Nexus
11 1 (0.70%) Travis CI
11 1 (0.70%) Vagrant
11 1 (0.70%) Visual Studio
General
1 42 (29.58%) Social Skills
2 28 (19.72%) Finance
3 25 (17.61%) Analytical Skills
4 12 (8.45%) Public Sector
5 10 (7.04%) Law
6 6 (4.23%) Banking
6 6 (4.23%) Telecoms
7 5 (3.52%) Police
7 5 (3.52%) Presentation Skills
8 3 (2.11%) Inclusion and Diversity
9 2 (1.41%) Back Office
9 2 (1.41%) Financial Institution
10 1 (0.70%) Automotive
10 1 (0.70%) Documentation Skills
10 1 (0.70%) Electronics
10 1 (0.70%) Organisational Skills
10 1 (0.70%) Retail
10 1 (0.70%) Retail Banking
Job Titles
1 33 (23.24%) DevOps Engineer
2 25 (17.61%) Senior
3 15 (10.56%) Senior DevOps
3 15 (10.56%) Senior DevOps Engineer
4 14 (9.86%) AWS Engineer
5 11 (7.75%) Architect
5 11 (7.75%) AWS DevOps
6 10 (7.04%) AWS DevOps Engineer
7 9 (6.34%) Configuration Manager
7 9 (6.34%) Platform Engineer
8 8 (5.63%) Linux Engineer
9 7 (4.93%) AWS Platform Engineer
9 7 (4.93%) Azure Engineer
9 7 (4.93%) Cloud Platform Engineer
9 7 (4.93%) Network Engineer
10 6 (4.23%) Developer
10 6 (4.23%) Infrastructure Engineer
10 6 (4.23%) Senior AWS DevOps Engineer
11 5 (3.52%) Analyst
11 5 (3.52%) ServiceNow Architect
Libraries, Frameworks & Software Standards
1 15 (10.56%) Elastic Stack
2 13 (9.15%) REST
3 9 (6.34%) SOAP
4 8 (5.63%) Web Services
5 7 (4.93%) XML
6 6 (4.23%) Ajax
6 6 (4.23%) ARM Templates
7 5 (3.52%) CSS
7 5 (3.52%) HTML
7 5 (3.52%) Java EE
8 3 (2.11%) DCOM
8 3 (2.11%) Kafka
8 3 (2.11%) LDAP
8 3 (2.11%) Middleware
9 2 (1.41%) AWS SAM
9 2 (1.41%) EJB
9 2 (1.41%) J2EE
9 2 (1.41%) JDBC
9 2 (1.41%) WebSphere MQ
9 2 (1.41%) XSLT
Miscellaneous
1 20 (14.08%) CMDB
2 8 (5.63%) Data Centre
3 6 (4.23%) Cloud Native
3 6 (4.23%) Management Information System
4 5 (3.52%) Onboarding
5 4 (2.82%) Private Cloud
6 3 (2.11%) Data Structures
6 3 (2.11%) Product Ownership
6 3 (2.11%) Public Cloud
6 3 (2.11%) Replication
6 3 (2.11%) Self-Motivation
7 2 (1.41%) Data Protection Act
7 2 (1.41%) Distributed Systems
7 2 (1.41%) Virtual Team
7 2 (1.41%) Wiki
8 1 (0.70%) Analytical Mindset
8 1 (0.70%) Distributed Architecture
8 1 (0.70%) Hybrid Cloud
8 1 (0.70%) Linux Command Line
8 1 (0.70%) Reinsurance
Operating Systems
1 43 (30.28%) Linux
2 27 (19.01%) Windows
3 13 (9.15%) Unix
4 11 (7.75%) Windows Server
5 7 (4.93%) Red Hat Enterprise Linux
6 6 (4.23%) Ubuntu
7 4 (2.82%) AIX
7 4 (2.82%) VMS
8 3 (2.11%) CentOS
9 2 (1.41%) SUSE
10 1 (0.70%) Android
10 1 (0.70%) Apple iOS
10 1 (0.70%) HPUX
10 1 (0.70%) Mac OS
10 1 (0.70%) Solaris
Processes & Methodologies
1 56 (39.44%) DevOps
2 36 (25.35%) Infrastructure as Code
3 34 (23.94%) Containerisation
3 34 (23.94%) Problem-Solving
4 32 (22.54%) ITIL
5 31 (21.83%) CI/CD
6 28 (19.72%) Agile
7 24 (16.90%) Continuous Integration
8 21 (14.79%) ITSM
8 21 (14.79%) Service Management
9 19 (13.38%) Deployment Automation
9 19 (13.38%) Problem Management
10 16 (11.27%) Change Management
11 15 (10.56%) Infrastructure Automation
12 14 (9.86%) Migration
13 13 (9.15%) High Availability
13 13 (9.15%) Incident Management
14 11 (7.75%) Continuous Improvement
14 11 (7.75%) Process Improvement
15 10 (7.04%) Test Automation
Programming Languages
1 44 (30.99%) Python
2 29 (20.42%) Bash
3 24 (16.90%) PowerShell
4 9 (6.34%) Java
5 8 (5.63%) SQL
6 6 (4.23%) Shell Script
7 4 (2.82%) JavaScript
7 4 (2.82%) Ruby
8 3 (2.11%) Go
8 3 (2.11%) Perl
9 2 (1.41%) PL/SQL
9 2 (1.41%) REXX
10 1 (0.70%) Bicep
10 1 (0.70%) C#
Qualifications
1 56 (39.44%) Security Cleared
2 52 (36.62%) SC Cleared
3 11 (7.75%) Degree
4 7 (4.93%) ITIL Certification
5 6 (4.23%) Cisco Certification
6 4 (2.82%) CCNP
6 4 (2.82%) DV Cleared
7 3 (2.11%) Computer Science Degree
7 3 (2.11%) VMware Certified Professional (VCP)
8 2 (1.41%) BPSS Clearance
8 2 (1.41%) CCNA
8 2 (1.41%) MCSA
8 2 (1.41%) MCSE
8 2 (1.41%) Microsoft Certification
8 2 (1.41%) OCA
8 2 (1.41%) Oracle Certification
9 1 (0.70%) CISM
9 1 (0.70%) CISSP
9 1 (0.70%) Network+ Certification
9 1 (0.70%) RHCE
Quality Assurance & Compliance
1 5 (3.52%) Def Stans
1 5 (3.52%) QA
2 4 (2.82%) NIST
3 1 (0.70%) Data Quality
3 1 (0.70%) Disclosure Scotland
System Software
1 37 (26.06%) Docker
2 9 (6.34%) VMware Infrastructure
3 7 (4.93%) Active Directory
4 4 (2.82%) Hyper-V
5 2 (1.41%) Virtual Desktop
6 1 (0.70%) BitLocker
6 1 (0.70%) Virtual Machines
6 1 (0.70%) VMware ESXi
Systems Management
1 62 (43.66%) Ansible
2 55 (38.73%) Terraform
3 45 (31.69%) Kubernetes
4 31 (21.83%) Puppet
5 29 (20.42%) Progress Chef
6 20 (14.08%) Grafana
7 17 (11.97%) Prometheus
8 12 (8.45%) SCCM
9 6 (4.23%) Microsoft Intune
10 5 (3.52%) Docker Swarm
10 5 (3.52%) Podman
11 4 (2.82%) Red Hat Satellite
12 2 (1.41%) Failover Clustering
12 2 (1.41%) vCenter Server
12 2 (1.41%) WSUS
13 1 (0.70%) Argo
13 1 (0.70%) Consul
13 1 (0.70%) Oracle ZFS
13 1 (0.70%) Packer
13 1 (0.70%) PowerCLI
Vendors
1 17 (11.97%) Red Hat
2 14 (9.86%) VMware
3 13 (9.15%) ServiceNow
4 11 (7.75%) Microsoft
5 7 (4.93%) Oracle
6 6 (4.23%) Cisco
7 5 (3.52%) BMC
7 5 (3.52%) PTC
7 5 (3.52%) Remedy
8 4 (2.82%) Databricks
9 3 (2.11%) Salesforce
9 3 (2.11%) Snow
9 3 (2.11%) Splunk
10 2 (1.41%) Dynatrace
10 2 (1.41%) Google
10 2 (1.41%) Huawei
10 2 (1.41%) LogicMonitor
10 2 (1.41%) MuleSoft
10 2 (1.41%) SolarWinds
10 2 (1.41%) Veeam