HTML Contracts with Work from Home Options

HTML (including XHTML, DHTML & HTML5)
UK > Work from Home

The table below provides summary statistics for contract job vacancies with an option to work from home (WFH) and a requirement for HTML skills. Included is a benchmarking guide to the contractor rates offered in vacancies that have cited HTML over the 6 months to 23 May 2024 with a comparison to the same period in the previous 2 years.

6 months to
23 May 2024
Same period 2023 Same period 2022
Rank 55 72 51
Rank change year-on-year +17 -21 -7
Contract jobs citing HTML 528 779 2,152
As % of all contract jobs with a WFH option 3.60% 3.19% 4.88%
As % of the Libraries, Frameworks & Software Standards category 14.51% 12.67% 16.42%
Number of daily rates quoted 277 572 1,481
10th Percentile £300 £313 £345
25th Percentile £415 £404 £413
Median daily rate (50th Percentile) £500 £480 £500
Median % change year-on-year +4.17% -4.00% +11.11%
75th Percentile £575 £575 £600
90th Percentile £675 £699 £694
UK median daily rate £500 £500 £525
% change year-on-year - -4.76% +16.67%
Number of hourly rates quoted 11 17 23
10th Percentile £26.25 - £22.50
25th Percentile £37.63 £21.00 £41.88
Median hourly rate £40.25 £45.00 £55.50
Median % change year-on-year -10.56% -18.92% +58.57%
75th Percentile £58.38 £63.75 £71.25
90th Percentile £63.75 £85.00 £77.17
UK median hourly rate £56.75 £45.00 £57.50
% change year-on-year +26.11% -21.74% +43.75%

All Software Libraries and Frameworks
Work from Home

HTML is in the Software Libraries and Frameworks category. The following table is for comparison with the above and provides summary statistics for all contract job vacancies with a WFH option and a requirement for technical specification, industry standards, software libraries and framework skills.

Contract vacancies with a requirement for technical specification, industry standards, software libraries and framework skills 3,640 6,146 13,107
As % of all contract jobs with a WFH option 24.84% 25.16% 29.72%
Number of daily rates quoted 2,563 4,576 9,697
10th Percentile £341 £400 £400
25th Percentile £431 £450 £450
Median daily rate (50th Percentile) £534 £543 £550
Median % change year-on-year -1.61% -1.32% +11.11%
75th Percentile £650 £663 £650
90th Percentile £800 £750 £738
UK median daily rate £535 £550 £550
% change year-on-year -2.73% - +10.00%
Number of hourly rates quoted 92 75 120
10th Percentile £24.23 £22.35 £21.90
25th Percentile - £45.00 £35.00
Median hourly rate £43.00 £62.50 £50.00
Median % change year-on-year -31.20% +25.00% +11.11%
75th Percentile £62.00 £75.00 £65.54
90th Percentile £72.50 £80.15 £75.92
UK median hourly rate £47.50 £65.00 £50.00
% change year-on-year -26.92% +30.00% +11.11%

HTML
Trend for Jobs with a WFH Option

Job vacancies with a work from home option citing HTML as a proportion of all IT jobs advertised.
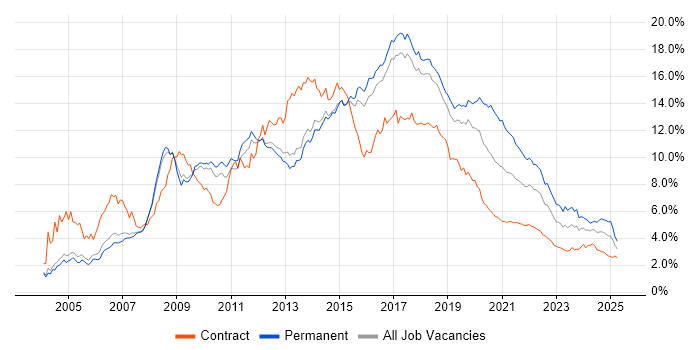
HTML trend for jobs with a WFH option

HTML
Daily Rate Trend for Jobs with a WFH Option

3-month moving average daily rate quoted in job vacancies with a work from home option citing HTML.

HTML daily rate for jobs with a WFH option

HTML
Daily Rate Histogram for Jobs with a WFH Option

Daily rate distribution for jobs with a work from home option citing HTML over the 6 months to 23 May 2024.

HTML daily rate histogram for jobs with a WFH option

HTML
Hourly Rate Trend for Jobs with a WFH Option

3-month moving average hourly rate quoted in job vacancies with a work from home option citing HTML.

HTML hourly rate for jobs with a WFH option

HTML
Hourly Rate Histogram for Jobs with a WFH Option

Hourly rate distribution for jobs with a work from home option citing HTML over the 6 months to 23 May 2024.

HTML hourly rate histogram for jobs with a WFH option

HTML
Co-occurring Skills and Capabilities with WFH Options by Category

The follow tables expand on the table above by listing co-occurrences grouped by category. The same employment type, locality and period is covered with up to 20 co-occurrences shown in each of the following categories:

Application Platforms
1 37 (7.01%) CMS
2 17 (3.22%) nginx
3 13 (2.46%) WordPress
4 12 (2.27%) Confluence
5 10 (1.89%) Headless CMS
6 8 (1.52%) Adobe Experience Manager
6 8 (1.52%) SharePoint
7 7 (1.33%) Apache
8 6 (1.14%) Kentico
9 4 (0.76%) Umbraco
10 3 (0.57%) Drupal
10 3 (0.57%) SharePoint 2010
10 3 (0.57%) SharePoint Server
10 3 (0.57%) Tomcat
11 1 (0.19%) EPiServer
11 1 (0.19%) Ethereum
11 1 (0.19%) GeoServer
11 1 (0.19%) Moodle
11 1 (0.19%) Sitecore CMS
11 1 (0.19%) WebSphere
Applications
1 122 (23.11%) Chatbot
2 8 (1.52%) Photoshop
3 7 (1.33%) Adobe Illustrator
4 6 (1.14%) Adobe After Effects
4 6 (1.14%) Microsoft Excel
5 5 (0.95%) Microsoft PowerPoint
6 4 (0.76%) Microsoft Office
7 3 (0.57%) MS Visio
8 2 (0.38%) Adobe Creative Suite
9 1 (0.19%) 3ds Max
9 1 (0.19%) Adobe XD
9 1 (0.19%) Blender
9 1 (0.19%) InDesign
9 1 (0.19%) MadCap Flare
Business Applications
1 4 (0.76%) Endur
2 3 (0.57%) RMDS
2 3 (0.57%) SAP Hybris
3 2 (0.38%) Adobe Campaign
3 2 (0.38%) Dynamics CRM
3 2 (0.38%) Eloqua
3 2 (0.38%) Magento
3 2 (0.38%) OpenLink RightAngle
3 2 (0.38%) Oracle Procure-to-Pay
4 1 (0.19%) SAP S/4HANA
Cloud Services
1 72 (13.64%) AWS
2 71 (13.45%) Azure
3 38 (7.20%) GitHub
4 29 (5.49%) Azure DevOps
5 26 (4.92%) GCP
6 17 (3.22%) AWS Elastic Beanstalk
7 12 (2.27%) Amazon S3
7 12 (2.27%) Azure Service Bus
7 12 (2.27%) Serverless
8 11 (2.08%) AWS Lambda
8 11 (2.08%) Figma
8 11 (2.08%) OpenShift
8 11 (2.08%) Power Platform
9 9 (1.70%) GitHub Actions
10 8 (1.52%) AWS CloudFormation
10 8 (1.52%) Azure Cosmos DB
10 8 (1.52%) npm
10 8 (1.52%) SaaS
11 7 (1.33%) SAP Commerce Cloud
12 6 (1.14%) Adobe Analytics
Communications & Networking
1 22 (4.17%) Intranet
2 12 (2.27%) HTTP
3 11 (2.08%) Firewall
4 10 (1.89%) VPN
5 2 (0.38%) TCP/IP
6 1 (0.19%) DHCP
6 1 (0.19%) DNS
6 1 (0.19%) FTP
6 1 (0.19%) HbbTV
6 1 (0.19%) Internet
6 1 (0.19%) SNMP
6 1 (0.19%) Software-Defined Radio
6 1 (0.19%) VLAN
Database & Business Intelligence
1 60 (11.36%) SQL Server
2 34 (6.44%) MySQL
3 23 (4.36%) PostgreSQL
4 17 (3.22%) Oracle Reports
5 16 (3.03%) Relational Database
6 14 (2.65%) NoSQL
7 11 (2.08%) Amazon Aurora
8 10 (1.89%) MongoDB
9 8 (1.52%) BigQuery
9 8 (1.52%) Power BI
10 7 (1.33%) Oracle Database
11 5 (0.95%) MariaDB
11 5 (0.95%) Redis
12 4 (0.76%) Amazon RDS
12 4 (0.76%) Elasticsearch
12 4 (0.76%) Looker
12 4 (0.76%) Metadata
12 4 (0.76%) SQL Server Reporting Services
12 4 (0.76%) Tableau
13 3 (0.57%) SAP HANA
Development Applications
1 49 (9.28%) Git
2 40 (7.58%) JIRA
3 19 (3.60%) Jenkins
4 16 (3.03%) webpack
5 12 (2.27%) GitLab
6 8 (1.52%) Storybook
7 7 (1.33%) Visual Studio Code
8 6 (1.14%) Cypress.io
8 6 (1.14%) Dreamweaver
9 5 (0.95%) Team Foundation Server
9 5 (0.95%) TeamCity
9 5 (0.95%) Visual Studio
10 4 (0.76%) Babel
10 4 (0.76%) Bitbucket
10 4 (0.76%) Postman
11 3 (0.57%) CircleCI
11 3 (0.57%) Subversion
11 3 (0.57%) VSS/SourceSafe
12 2 (0.38%) JMeter
12 2 (0.38%) Oracle APEX
General
1 73 (13.83%) Finance
2 69 (13.07%) Social Skills
3 55 (10.42%) Public Sector
4 40 (7.58%) Banking
5 26 (4.92%) Analytical Skills
6 17 (3.22%) Marketing
7 13 (2.46%) Financial Institution
8 11 (2.08%) Publishing
8 11 (2.08%) Retail
9 8 (1.52%) Telecoms
10 6 (1.14%) Front Office
11 5 (0.95%) Advertising
11 5 (0.95%) Tech for Good
12 4 (0.76%) Digital Healthcare
12 4 (0.76%) Investment Banking
12 4 (0.76%) Presentation Skills
13 3 (0.57%) Automotive
13 3 (0.57%) Back Office
13 3 (0.57%) Inclusion and Diversity
13 3 (0.57%) Manufacturing
Job Titles
1 390 (73.86%) Developer
2 137 (25.95%) Software Developer
3 51 (9.66%) Full Stack Developer
4 50 (9.47%) Senior
5 49 (9.28%) Front-End Developer (Client-Side Developer)
6 41 (7.77%) Senior Developer
7 36 (6.82%) React Developer
8 22 (4.17%) .NET Developer
9 21 (3.98%) JavaScript Developer
10 19 (3.60%) Designer
10 19 (3.60%) Technical Writer
11 17 (3.22%) Java Developer
11 17 (3.22%) Lead
12 15 (2.84%) Software Engineer
13 13 (2.46%) Consultant
13 13 (2.46%) Full Stack Engineer
13 13 (2.46%) Senior Front-End Developer
14 12 (2.27%) HTML Developer
15 11 (2.08%) Azure Developer
16 10 (1.89%) HTML CSS Developer
Libraries, Frameworks & Software Standards
1 347 (65.72%) CSS
2 143 (27.08%) React
3 78 (14.77%) Node.js
4 65 (12.31%) .NET
5 58 (10.98%) AngularJS
6 52 (9.85%) HTML5
6 52 (9.85%) REST
7 51 (9.66%) XML
8 49 (9.28%) Web Services
9 38 (7.20%) Vue
10 36 (6.82%) ASP.NET
10 36 (6.82%) jQuery
11 33 (6.25%) CSS3
11 33 (6.25%) RESTful
12 32 (6.06%) Sass
13 29 (5.49%) Laravel
14 24 (4.55%) GraphQL
14 24 (4.55%) SOAP
15 23 (4.36%) JSON
16 21 (3.98%) .NET Core
Miscellaneous
1 20 (3.79%) Onboarding
2 16 (3.03%) Product Ownership
3 11 (2.08%) Mobile App
4 9 (1.70%) Data Structures
4 9 (1.70%) Legacy Systems
5 8 (1.52%) Animation
5 8 (1.52%) Fixed Income
6 7 (1.33%) Foreign Exchange (FX)
6 7 (1.33%) Management Information System
7 6 (1.14%) Algorithms
8 5 (0.95%) Cloud Native
8 5 (0.95%) CMDB
8 5 (0.95%) Marketing Technology
9 4 (0.76%) Data Protection Act
9 4 (0.76%) Derivative
9 4 (0.76%) Enterprise Software
9 4 (0.76%) Hedge funds
10 3 (0.57%) Distributed Systems
10 3 (0.57%) Greenfield Project
10 3 (0.57%) Self-Motivation
Operating Systems
1 32 (6.06%) Linux
2 22 (4.17%) Unix
3 9 (1.70%) Windows
4 8 (1.52%) Android
4 8 (1.52%) Apple iOS
5 3 (0.57%) Red Hat Enterprise Linux
6 2 (0.38%) Windows Server
7 1 (0.19%) CentOS
7 1 (0.19%) Windows Server 2016
7 1 (0.19%) Windows Server 2019
Processes & Methodologies
1 175 (33.14%) Software Engineering
2 150 (28.41%) Code Quality
3 126 (23.86%) Artificial Intelligence
4 122 (23.11%) Conversational UI
5 108 (20.45%) Agile
6 91 (17.23%) Full Stack Development
7 79 (14.96%) User Experience
8 73 (13.83%) Front End Development
9 69 (13.07%) Web Development
10 66 (12.50%) DevOps
11 61 (11.55%) Problem-Solving
12 55 (10.42%) CI/CD
13 50 (9.47%) TDD
14 40 (7.58%) Test Automation
15 38 (7.20%) MVC
16 37 (7.01%) Microservices
16 37 (7.01%) UX Design
17 34 (6.44%) Computer Science
18 29 (5.49%) Scrum
19 28 (5.30%) Analytics
Programming Languages
1 427 (80.87%) JavaScript
2 202 (38.26%) SQL
3 179 (33.90%) C#
4 155 (29.36%) Python
5 105 (19.89%) TypeScript
6 81 (15.34%) Java
7 35 (6.63%) PHP
8 13 (2.46%) PowerShell
9 11 (2.08%) Bicep
10 8 (1.52%) C++
11 6 (1.14%) C
11 6 (1.14%) PL/SQL
11 6 (1.14%) Ruby
12 5 (0.95%) Bash
12 5 (0.95%) Shell Script
13 4 (0.76%) ABAP
14 3 (0.57%) Go
14 3 (0.57%) Scala
14 3 (0.57%) SPARQL
15 2 (0.38%) F#
Qualifications
1 156 (29.55%) Degree
2 44 (8.33%) Security Cleared
3 37 (7.01%) SC Cleared
4 22 (4.17%) Computer Science Degree
5 8 (1.52%) BPSS Clearance
6 4 (0.76%) CTC Cleared
7 3 (0.57%) Master's Degree
8 2 (0.38%) OCP
8 2 (0.38%) Oracle Certification
9 1 (0.19%) Numerate Degree
9 1 (0.19%) SANS
Quality Assurance & Compliance
1 54 (10.23%) Accessibility
2 26 (4.92%) QA
3 14 (2.65%) WCAG
4 2 (0.38%) Disclosure Scotland
4 2 (0.38%) GDPR
4 2 (0.38%) PMO
5 1 (0.19%) Data Quality
5 1 (0.19%) HIPAA
5 1 (0.19%) HL7
5 1 (0.19%) ISO 20022
5 1 (0.19%) NIST
System Software
1 27 (5.11%) Active Directory
2 25 (4.73%) Docker
3 17 (3.22%) IAG
4 16 (3.03%) ACF2
4 16 (3.03%) RACF
5 3 (0.57%) VMware Infrastructure
6 1 (0.19%) Firmware
Systems Management
1 19 (3.60%) Kubernetes
2 7 (1.33%) Terraform
3 5 (0.95%) Grafana
4 3 (0.57%) Ansible
4 3 (0.57%) Kibana
5 2 (0.38%) logstash
5 2 (0.38%) Opsgenie
5 2 (0.38%) Single Sign-On
6 1 (0.19%) Progress Chef
6 1 (0.19%) Prometheus
6 1 (0.19%) Puppet
Vendors
1 121 (22.92%) PayPal
2 31 (5.87%) Microsoft
3 29 (5.49%) Oracle
3 29 (5.49%) ServiceNow
4 26 (4.92%) Adobe
5 16 (3.03%) Sybase
6 14 (2.65%) Google
7 12 (2.27%) SAP
8 7 (1.33%) Optimizely
9 6 (1.14%) dotdigital
9 6 (1.14%) Salesforce
10 5 (0.95%) Dynatrace
11 4 (0.76%) Atlassian
11 4 (0.76%) Ensighten
11 4 (0.76%) Monetate
11 4 (0.76%) Omniture
11 4 (0.76%) Splunk
11 4 (0.76%) Tealium
11 4 (0.76%) Xamarin
12 3 (0.57%) Salesforce Marketing Cloud