Relational Database Jobs with Hybrid/Remote/WFH Options

Relational Database
UK > Work from Home

The table below provides summary statistics for permanent remote or hybrid work requiring Relational Database skills. It includes a benchmarking guide to the annual salaries offered in vacancies that cited Relational Database over the 6 months leading up to 14 June 2025, comparing them to the same period in the previous two years.

6 months to
14 Jun 2025
Same period 2024 Same period 2023
Rank 174 171 148
Rank change year-on-year -3 -23 -43
Permanent jobs citing Relational Database 408 657 866
As % of all permanent jobs with a WFH option 2.10% 1.84% 2.32%
As % of the Database & Business Intelligence category 11.45% 8.26% 9.49%
Number of salaries quoted 151 451 652
10th Percentile £41,250 £39,750 £42,500
25th Percentile £46,875 £47,500 £50,000
Median annual salary (50th Percentile) £60,000 £57,500 £62,500
Median % change year-on-year +4.35% -8.00% +8.70%
75th Percentile £77,500 £72,500 £82,500
90th Percentile £87,500 £88,750 £102,500
UK median annual salary £65,000 £57,500 £65,000
% change year-on-year +13.04% -11.54% +13.04%

All Database and Business Intelligence Skills
Work from Home

Relational Database falls under the Databases and Business Intelligence category. For comparison with the information above, the following table provides summary statistics for all permanent job vacancies with remote or hybrid options requiring database or business intelligence skills.

Permanent vacancies with a requirement for database or business intelligence skills 3,562 7,956 9,121
As % of all permanent jobs with a WFH option 18.30% 22.34% 24.46%
Number of salaries quoted 2,192 6,274 6,542
10th Percentile £36,250 £37,101 £40,000
25th Percentile £47,500 £43,750 £49,563
Median annual salary (50th Percentile) £65,000 £57,500 £65,000
Median % change year-on-year +13.04% -11.54% +8.33%
75th Percentile £85,000 £77,500 £81,250
90th Percentile £115,000 £107,487 £101,250
UK median annual salary £60,500 £57,500 £65,000
% change year-on-year +5.22% -11.54% +8.33%

Relational Database
Trend for Jobs with a WFH Option

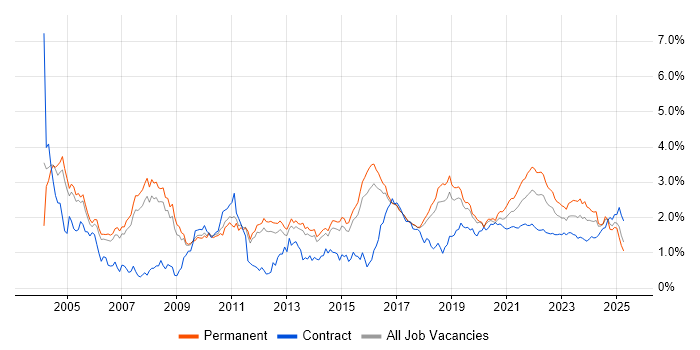
Job vacancies with remote working options citing Relational Database as a proportion of all IT jobs advertised.

Relational Database trend for jobs with Hybrid/Remote/WFH options

Relational Database
Salary Trend for Jobs with a WFH Option

3-month moving average salary quoted in job vacancies with remote working options citing Relational Database.

Relational Database salary trend for jobs with a WFH option

Relational Database
Salary Histogram for Jobs with a WFH Option

Salary distribution for jobs with remote working options citing Relational Database over the 6 months to 14 June 2025.

Relational Database salary histogram for jobs with a WFH option

Relational Database
Co-occurring Skills and Capabilities with WFH Options by Category

The follow tables expand on the table above by listing co-occurrences grouped by category. The same employment type, locality and period is covered with up to 20 co-occurrences shown in each of the following categories:

Application Platforms
1 16 (3.92%) Confluence
2 11 (2.70%) Apache
3 8 (1.96%) Apache Airflow
4 6 (1.47%) IIS
5 4 (0.98%) Apache Spark
5 4 (0.98%) Microsoft Exchange
6 3 (0.74%) CMS
6 3 (0.74%) GemFire
6 3 (0.74%) OpenEdge
7 2 (0.49%) SharePoint
8 1 (0.25%) ColdFusion
8 1 (0.25%) Headless CMS
8 1 (0.25%) Luigi
8 1 (0.25%) Oracle Application Server
8 1 (0.25%) SAS
8 1 (0.25%) Umbraco
8 1 (0.25%) WebLogic
Applications
1 14 (3.43%) Microsoft Excel
2 10 (2.45%) Microsoft Office
3 1 (0.25%) Spreadsheet
3 1 (0.25%) Trello
Business Applications
1 9 (2.21%) NetSuite
2 3 (0.74%) Dynamics CRM
3 1 (0.25%) Dynamics GP
3 1 (0.25%) FastStats
3 1 (0.25%) FastStats PeopleStage
3 1 (0.25%) Raiser’s Edge
Cloud Services
1 257 (62.99%) AWS
2 215 (52.70%) Pulumi
3 59 (14.46%) Azure
4 23 (5.64%) Power Platform
5 18 (4.41%) SaaS
6 14 (3.43%) GitHub
7 13 (3.19%) Azure Data Factory
8 12 (2.94%) Azure DevOps
9 10 (2.45%) Dynamics 365
9 10 (2.45%) GCP
10 9 (2.21%) Azure Monitor
10 9 (2.21%) Boomi
11 8 (1.96%) Azure Logic Apps
12 7 (1.72%) Serverless
13 5 (1.23%) dbt
14 4 (0.98%) Amazon EC2
14 4 (0.98%) OCI
14 4 (0.98%) Snowflake
15 3 (0.74%) AWS CloudFormation
15 3 (0.74%) Cloud Computing
Communications & Networking
1 215 (52.70%) Broadband
2 9 (2.21%) Firewall
3 6 (1.47%) DNS
4 5 (1.23%) TCP/IP
5 3 (0.74%) HTTP
5 3 (0.74%) Internet
6 2 (0.49%) Network Security
7 1 (0.25%) FTP
7 1 (0.25%) SAN
7 1 (0.25%) SMTP
7 1 (0.25%) SSL
Database & Business Intelligence
1 257 (62.99%) RDBMS
2 230 (56.37%) NoSQL
3 48 (11.76%) SQL Server
4 30 (7.35%) MySQL
5 27 (6.62%) PostgreSQL
6 19 (4.66%) MongoDB
7 16 (3.92%) Power BI
8 14 (3.43%) SQL Server Integration Services
9 12 (2.94%) Data Warehouse
9 12 (2.94%) DB2
10 6 (1.47%) Redis
11 5 (1.23%) BigQuery
11 5 (1.23%) Oracle Reports
11 5 (1.23%) SQL Server Reporting Services
12 4 (0.98%) MariaDB
12 4 (0.98%) Power Query
13 3 (0.74%) Apache Ignite
13 3 (0.74%) Hadoop
13 3 (0.74%) InterSystems Cache
13 3 (0.74%) Oracle Database
Development Applications
1 215 (52.70%) Jaeger
2 57 (13.97%) Git
3 27 (6.62%) JIRA
4 10 (2.45%) Visual Studio
5 9 (2.21%) Jenkins
5 9 (2.21%) Selenium
6 8 (1.96%) Moq
6 8 (1.96%) SpecFlow
7 7 (1.72%) Postman
8 5 (1.23%) Bitbucket
8 5 (1.23%) Cucumber
8 5 (1.23%) SoapUI
9 4 (0.98%) Subversion
9 4 (0.98%) Team Foundation Server
10 3 (0.74%) IBM UrbanCode
10 3 (0.74%) JUnit
10 3 (0.74%) SonarQube
10 3 (0.74%) Sonatype Nexus
11 2 (0.49%) Ant
11 2 (0.49%) WebSpeed
General
1 220 (53.92%) Inclusion and Diversity
2 69 (16.91%) Social Skills
3 45 (11.03%) Analytical Skills
4 30 (7.35%) Finance
5 17 (4.17%) Public Sector
6 14 (3.43%) Banking
7 10 (2.45%) Retail
8 9 (2.21%) Games
9 8 (1.96%) Pharmaceutical
10 7 (1.72%) Investment Banking
10 7 (1.72%) Marketing
11 6 (1.47%) Back Office
12 5 (1.23%) Law
12 5 (1.23%) Local Government
12 5 (1.23%) Presentation Skills
13 3 (0.74%) Advertising
13 3 (0.74%) Front Office
13 3 (0.74%) Legal
13 3 (0.74%) Tech for Good
14 2 (0.49%) Telecoms
Job Titles
1 223 (54.66%) Lead
2 218 (53.43%) Team Leader
3 60 (14.71%) Developer
4 42 (10.29%) Analyst
4 42 (10.29%) Senior
5 20 (4.90%) Software Engineer
6 18 (4.41%) Senior Developer
7 14 (3.43%) Data Engineer
7 14 (3.43%) Support Analyst
8 10 (2.45%) .NET Developer
8 10 (2.45%) Senior Analyst
9 9 (2.21%) Full-Stack Developer
9 9 (2.21%) Java Engineer
9 9 (2.21%) NetSuite Developer
9 9 (2.21%) Technical Developer
10 8 (1.96%) Applications Support
10 8 (1.96%) Applications Support Analyst
10 8 (1.96%) Banking Analyst
10 8 (1.96%) C# Developer
10 8 (1.96%) Software Developer
Libraries, Frameworks & Software Standards
1 217 (53.19%) Elastic Stack
2 215 (52.70%) OpenTelemetry
3 43 (10.54%) .NET
4 30 (7.35%) HTML
5 26 (6.37%) CSS
6 25 (6.13%) ASP.NET
7 23 (5.64%) .NET Framework
8 22 (5.39%) REST
9 17 (4.17%) OAuth
9 17 (4.17%) Web Services
10 16 (3.92%) .NET Core
11 14 (3.43%) Entity Framework
11 14 (3.43%) Kafka
11 14 (3.43%) Middleware
11 14 (3.43%) Spring
12 12 (2.94%) React
12 12 (2.94%) XML
13 10 (2.45%) ASP.NET Core
14 9 (2.21%) SAML
14 9 (2.21%) Spring Boot
Miscellaneous
1 20 (4.90%) Management Information System
2 13 (3.19%) Virtual Team
3 10 (2.45%) Greenfield Project
4 9 (2.21%) Product Ownership
5 8 (1.96%) Data Centre
6 7 (1.72%) Client/Server
7 6 (1.47%) Onboarding
8 5 (1.23%) Foreign Exchange (FX)
8 5 (1.23%) Self-Motivation
9 4 (0.98%) Algorithms
9 4 (0.98%) Cloud Native
9 4 (0.98%) Low-Code
10 3 (0.74%) Credit Derivative
10 3 (0.74%) Data Structures
10 3 (0.74%) Derivative
10 3 (0.74%) Enterprise Software
10 3 (0.74%) Equities
10 3 (0.74%) Fixed Income
10 3 (0.74%) IoT
10 3 (0.74%) Mainframe
Operating Systems
1 245 (60.05%) Linux
2 233 (57.11%) Unix
3 27 (6.62%) Windows
4 6 (1.47%) Windows Server
5 5 (1.23%) CentOS
6 4 (0.98%) Red Hat Enterprise Linux
6 4 (0.98%) Ubuntu
7 2 (0.49%) Mac OS
8 1 (0.25%) AIX
8 1 (0.25%) Android
8 1 (0.25%) Apple iOS
8 1 (0.25%) Debian
8 1 (0.25%) VMS
Processes & Methodologies
1 281 (68.87%) Agile
2 264 (64.71%) DevOps
3 236 (57.84%) Mentoring
4 231 (56.62%) Containerisation
5 230 (56.37%) Continuous Integration
5 230 (56.37%) Performance Optimisation
6 221 (54.17%) High Availability
7 220 (53.92%) Infrastructure as Code
7 220 (53.92%) Roadmaps
8 216 (52.94%) Cost Optimisation
8 216 (52.94%) Product Management
9 215 (52.70%) Budget Control
9 215 (52.70%) GitOps
9 215 (52.70%) Resource Management
9 215 (52.70%) Task Automation
10 47 (11.52%) Problem-Solving
11 45 (11.03%) Computer Science
11 45 (11.03%) Microservices
12 38 (9.31%) Software Engineering
13 29 (7.11%) CI/CD
Programming Languages
1 287 (70.34%) Python
2 254 (62.25%) Java
3 252 (61.76%) JavaScript
4 225 (55.15%) Go
5 221 (54.17%) Bash
6 117 (28.68%) SQL
7 47 (11.52%) C#
8 19 (4.66%) T-SQL
9 13 (3.19%) TypeScript
10 12 (2.94%) PL/SQL
11 10 (2.45%) PHP
11 10 (2.45%) VB.NET
12 9 (2.21%) PowerShell
13 7 (1.72%) C++
14 5 (1.23%) Data Analysis Expressions
15 3 (0.74%) C
15 3 (0.74%) Groovy
16 2 (0.49%) Fortran
16 2 (0.49%) Progress 4GL
16 2 (0.49%) Shell Script
Qualifications
1 218 (53.43%) AWS Certification
2 53 (12.99%) Degree
3 19 (4.66%) Computer Science Degree
4 16 (3.92%) Master's Degree
5 8 (1.96%) Security Cleared
6 7 (1.72%) SC Cleared
7 4 (0.98%) BPSS Clearance
7 4 (0.98%) DBS Check
7 4 (0.98%) OCP
7 4 (0.98%) Oracle Certification
8 3 (0.74%) Azure Certification
9 2 (0.49%) Microsoft Certification
9 2 (0.49%) PhD
10 1 (0.25%) DV Cleared
10 1 (0.25%) ISTQB
10 1 (0.25%) ISTQB Foundation Certification
10 1 (0.25%) Numerate Degree
Quality Assurance & Compliance
1 17 (4.17%) QA
2 8 (1.96%) Accessibility
3 7 (1.72%) Data Quality
3 7 (1.72%) GDPR
4 6 (1.47%) CDISC
5 1 (0.25%) Actionable Recommendations
5 1 (0.25%) ISO/IEC 27001
5 1 (0.25%) NCSC
System Software
1 247 (60.54%) Docker
2 9 (2.21%) VMware Infrastructure
3 4 (0.98%) Virtual Servers
3 4 (0.98%) VMware ESXi
3 4 (0.98%) vSphere
Systems Management
1 233 (57.11%) Kubernetes
2 223 (54.66%) Terraform
3 218 (53.43%) Ansible
3 218 (53.43%) Argo
3 218 (53.43%) Prometheus
4 215 (52.70%) Kustomize
5 9 (2.21%) Single Sign-On
6 5 (1.23%) ZABBIX
7 3 (0.74%) Grafana
7 3 (0.74%) Istio
7 3 (0.74%) Progress Chef
8 1 (0.25%) Kibana
8 1 (0.25%) Microsoft Intune
Vendors
1 220 (53.92%) Google
2 40 (9.80%) Microsoft
3 23 (5.64%) Oracle
4 11 (2.70%) ServiceNow
5 9 (2.21%) Databricks
5 9 (2.21%) MuleSoft
5 9 (2.21%) VMware
6 7 (1.72%) SolarWinds
7 6 (1.47%) Informatica
8 4 (0.98%) SAP
9 3 (0.74%) Adobe
9 3 (0.74%) Atlassian
9 3 (0.74%) DocuSign
9 3 (0.74%) IBM
9 3 (0.74%) iManage
9 3 (0.74%) Intapp
9 3 (0.74%) RedGate
9 3 (0.74%) Solace
9 3 (0.74%) Talend
9 3 (0.74%) TIBCO