User Experience Contracts with Work from Home Options

UX
UK > Work from Home

The table below provides summary statistics for contract job vacancies with an option to work from home (WFH) and a requirement for User Experience skills. Included is a benchmarking guide to the contractor rates offered in vacancies that have cited User Experience over the 6 months to 9 June 2024 with a comparison to the same period in the previous 2 years.

6 months to
9 Jun 2024
Same period 2023 Same period 2022
Rank 65 58 55
Rank change year-on-year -7 -3 -3
Contract jobs citing User Experience 466 927 1,915
As % of all contract jobs with a WFH option 3.18% 3.88% 4.34%
As % of the Processes & Methodologies category 3.64% 4.33% 4.77%
Number of daily rates quoted 337 713 1,399
10th Percentile £353 £363 £390
25th Percentile £425 £438 £439
Median daily rate (50th Percentile) £500 £518 £510
Median % change year-on-year -3.38% +1.47% +7.37%
75th Percentile £625 £600 £594
90th Percentile £708 £700 £675
UK median daily rate £500 £515 £525
% change year-on-year -2.91% -1.90% +11.11%
Number of hourly rates quoted 11 12 25
10th Percentile £19.25 £17.13 £21.30
25th Percentile £23.75 £25.00 £49.25
Median hourly rate £40.00 £26.50 £65.00
Median % change year-on-year +50.94% -59.23% +91.18%
75th Percentile £67.07 £45.00 £75.00
90th Percentile £72.90 £56.25 £77.50
UK median hourly rate £31.71 £29.60 £56.38
% change year-on-year +7.15% -47.50% +71.61%

All Process and Methodology Skills
Work from Home

User Experience is in the Processes and Methodologies category. The following table is for comparison with the above and provides summary statistics for all contract job vacancies with a WFH option and a requirement for process or methodology skills.

Contract vacancies with a requirement for process or methodology skills 12,810 21,394 40,150
As % of all contract jobs with a WFH option 87.31% 89.63% 91.06%
Number of daily rates quoted 8,622 15,186 29,240
10th Percentile £325 £363 £363
25th Percentile £425 £450 £438
Median daily rate (50th Percentile) £525 £540 £525
Median % change year-on-year -2.78% +2.86% +6.06%
75th Percentile £638 £650 £638
90th Percentile £750 £750 £738
UK median daily rate £525 £550 £538
% change year-on-year -4.55% +2.33% +7.50%
Number of hourly rates quoted 573 497 521
10th Percentile £14.90 £18.50 £14.50
25th Percentile £23.75 £25.75 £20.75
Median hourly rate £43.00 £52.50 £40.00
Median % change year-on-year -18.10% +31.25% +68.42%
75th Percentile £60.00 £67.50 £59.00
90th Percentile £74.40 £78.30 £72.50
UK median hourly rate £36.50 £35.80 £25.68
% change year-on-year +1.96% +39.41% +11.65%

User Experience
Trend for Jobs with a WFH Option

Job vacancies with a work from home option citing User Experience as a proportion of all IT jobs advertised.
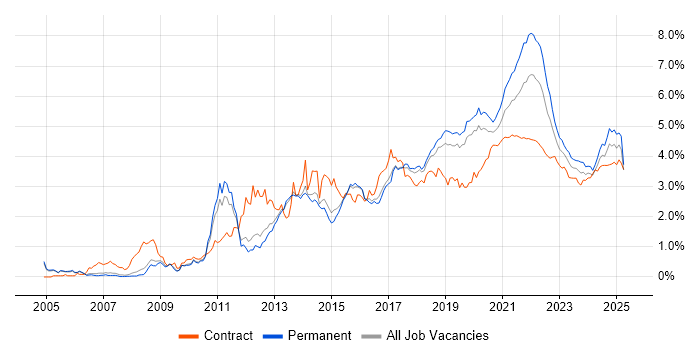
User Experience trend for jobs with a WFH option

User Experience
Daily Rate Trend for Jobs with a WFH Option

3-month moving average daily rate quoted in job vacancies with a work from home option citing User Experience.

User Experience daily rate for jobs with a WFH option

User Experience
Daily Rate Histogram for Jobs with a WFH Option

Daily rate distribution for jobs with a work from home option citing User Experience over the 6 months to 9 June 2024.

User Experience daily rate histogram for jobs with a WFH option

User Experience
Hourly Rate Trend for Jobs with a WFH Option

3-month moving average hourly rate quoted in job vacancies with a work from home option citing User Experience.

User Experience hourly rate for jobs with a WFH option

User Experience
Hourly Rate Histogram for Jobs with a WFH Option

Hourly rate distribution for jobs with a work from home option citing User Experience over the 6 months to 9 June 2024.

User Experience hourly rate histogram for jobs with a WFH option

User Experience
Co-occurring Skills and Capabilities with WFH Options by Category

The follow tables expand on the table above by listing co-occurrences grouped by category. The same employment type, locality and period is covered with up to 20 co-occurrences shown in each of the following categories:

Application Platforms
1 18 (3.86%) CMS
2 14 (3.00%) SharePoint
3 13 (2.79%) Apache
3 13 (2.79%) Confluence
4 10 (2.15%) Apache Airflow
5 6 (1.29%) SAS
6 5 (1.07%) Oracle Self-Service HR
7 3 (0.64%) Headless CMS
7 3 (0.64%) Microsoft Exchange
8 1 (0.21%) Alfresco
8 1 (0.21%) Liferay
8 1 (0.21%) Moodle
8 1 (0.21%) OpenStack
8 1 (0.21%) WordPress
Applications
1 16 (3.43%) Sketch
2 13 (2.79%) Adobe XD
3 6 (1.29%) Microsoft Office
4 5 (1.07%) Adobe Creative Suite
5 4 (0.86%) Microsoft Excel
5 4 (0.86%) Photoshop
6 3 (0.64%) InVision
6 3 (0.64%) Microsoft PowerPoint
6 3 (0.64%) MS Visio
7 2 (0.43%) Adobe Illustrator
8 1 (0.21%) Elementor
8 1 (0.21%) Trello
8 1 (0.21%) UserZoom
Business Applications
1 6 (1.29%) Salesforce CRM
2 4 (0.86%) Magento
3 3 (0.64%) Payment Gateway
4 2 (0.43%) ION MarketView
4 2 (0.43%) Maximo
4 2 (0.43%) SAP S/4HANA
5 1 (0.21%) SAP SCM
5 1 (0.21%) Shopify
Cloud Services
1 72 (15.45%) AWS
2 52 (11.16%) Figma
3 48 (10.30%) Azure
4 25 (5.36%) GCP
5 20 (4.29%) SaaS
6 14 (3.00%) Azure DevOps
6 14 (3.00%) Serverless
7 13 (2.79%) AWS Lambda
8 12 (2.58%) Miro
9 11 (2.36%) Amazon S3
9 11 (2.36%) AWS CloudFormation
10 10 (2.15%) Power Platform
11 9 (1.93%) Microsoft 365
11 9 (1.93%) OpenShift
12 6 (1.29%) Dynamics 365
13 5 (1.07%) Salesforce Sales Cloud
14 4 (0.86%) Azure AKS
14 4 (0.86%) npm
14 4 (0.86%) Power Automate
14 4 (0.86%) Textract
Communications & Networking
1 18 (3.86%) Intranet
2 6 (1.29%) VPN
3 5 (1.07%) HTTP
3 5 (1.07%) SSH
4 4 (0.86%) DNS
5 3 (0.64%) DHCP
6 2 (0.43%) NetScaler
7 1 (0.21%) 5G
7 1 (0.21%) Broadband
7 1 (0.21%) Internet
7 1 (0.21%) LTE
7 1 (0.21%) Radio Access Network
7 1 (0.21%) TCP/IP
7 1 (0.21%) Wi-Fi
Database & Business Intelligence
1 27 (5.79%) Apache Cassandra
2 24 (5.15%) SQL Server
3 20 (4.29%) PostgreSQL
4 15 (3.22%) MySQL
5 13 (2.79%) Amazon Aurora
6 10 (2.15%) Apache Ignite
6 10 (2.15%) MongoDB
7 9 (1.93%) Power BI
8 6 (1.29%) Amazon RDS
8 6 (1.29%) Crystal Reports
9 4 (0.86%) BigQuery
9 4 (0.86%) Elasticsearch
10 3 (0.64%) Big Data
10 3 (0.64%) NoSQL
10 3 (0.64%) Oracle Database
11 2 (0.43%) Azure SQL Database
11 2 (0.43%) BusinessObjects
11 2 (0.43%) Data Warehouse
11 2 (0.43%) EDMS
11 2 (0.43%) GIS
Development Applications
1 40 (8.58%) JIRA
2 29 (6.22%) Git
3 11 (2.36%) git-flow
4 7 (1.50%) Jenkins
5 6 (1.29%) Axure RP
6 5 (1.07%) JMeter
6 5 (1.07%) Visual Studio Code
7 4 (0.86%) Babel
7 4 (0.86%) GitLab
7 4 (0.86%) LoadRunner
7 4 (0.86%) webpack
8 3 (0.64%) Balsamiq
8 3 (0.64%) Cypress.io
9 2 (0.43%) Android Studio
9 2 (0.43%) Bitbucket
9 2 (0.43%) TeamCity
10 1 (0.21%) Gradle
10 1 (0.21%) Octopus Deploy
10 1 (0.21%) SonarQube
10 1 (0.21%) UI Automator
General
1 113 (24.25%) Social Skills
2 79 (16.95%) Finance
3 67 (14.38%) Public Sector
4 38 (8.15%) Marketing
5 35 (7.51%) Analytical Skills
6 28 (6.01%) Banking
7 22 (4.72%) Retail
8 15 (3.22%) Front Office
9 13 (2.79%) Presentation Skills
9 13 (2.79%) Telecoms
10 11 (2.36%) Pharmaceutical
11 9 (1.93%) Publishing
12 7 (1.50%) Inclusion and Diversity
12 7 (1.50%) Influencing Skills
13 6 (1.29%) Legal
13 6 (1.29%) Organisational Skills
14 5 (1.07%) Financial Institution
15 4 (0.86%) Health Technology
16 3 (0.64%) German Language
16 3 (0.64%) Law
Job Titles
1 131 (28.11%) Developer
2 89 (19.10%) Designer
3 74 (15.88%) Senior
4 50 (10.73%) UX Designer
5 49 (10.52%) Software Engineer
6 34 (7.30%) React Developer
7 29 (6.22%) Front-End Developer (Client-Side Developer)
8 27 (5.79%) UI Engineer
9 25 (5.36%) Analyst
10 24 (5.15%) Consultant
11 21 (4.51%) UI Designer
12 20 (4.29%) Business Analyst
12 20 (4.29%) Full Stack Developer
12 20 (4.29%) Technical Writer
13 19 (4.08%) .NET Developer
13 19 (4.08%) UI Developer
14 18 (3.86%) UI/UX Designer
15 17 (3.65%) Architect
15 17 (3.65%) Senior Software Engineer
16 15 (3.22%) Senior Developer
Libraries, Frameworks & Software Standards
1 96 (20.60%) CSS
2 95 (20.39%) React
3 81 (17.38%) HTML
4 34 (7.30%) AngularJS
4 34 (7.30%) Node.js
5 30 (6.44%) RESTful
6 29 (6.22%) Kafka
7 28 (6.01%) .NET
7 28 (6.01%) Redux
8 18 (3.86%) REST
9 16 (3.43%) Sass
10 15 (3.22%) Jest
11 13 (2.79%) Tailwind CSS
12 12 (2.58%) AWS CDK
12 12 (2.58%) Material-UI
13 11 (2.36%) HTML5
13 11 (2.36%) LESS
13 11 (2.36%) OpenFin
13 11 (2.36%) Vue
13 11 (2.36%) WebSockets
Miscellaneous
1 36 (7.73%) Product Ownership
2 31 (6.65%) Fixed Income
3 26 (5.58%) Mobile App
4 16 (3.43%) Enterprise Software
5 12 (2.58%) Management Information System
5 12 (2.58%) Onboarding
6 11 (2.36%) Video\Live Streaming
7 8 (1.72%) Legacy Systems
7 8 (1.72%) Over-the-Top Content
8 6 (1.29%) Foreign Exchange (FX)
9 5 (1.07%) Cloud Native
9 5 (1.07%) Derivative
9 5 (1.07%) Virtual Team
10 4 (0.86%) Algorithms
10 4 (0.86%) Data Centre
10 4 (0.86%) Data Structures
10 4 (0.86%) Legacy Applications
10 4 (0.86%) Renewable Energy
10 4 (0.86%) Wiki
11 3 (0.64%) IoT
Operating Systems
1 14 (3.00%) Windows
2 13 (2.79%) Android
3 12 (2.58%) Apple iOS
4 5 (1.07%) Linux
5 4 (0.86%) Windows Server
6 3 (0.64%) Windows 10
7 2 (0.43%) Unix
Processes & Methodologies
1 179 (38.41%) UX Design
2 171 (36.70%) Agile
3 84 (18.03%) User Research
4 77 (16.52%) Problem-Solving
5 72 (15.45%) Software Engineering
6 60 (12.88%) UX Research
7 48 (10.30%) Stakeholder Management
8 47 (10.09%) Fintech
8 47 (10.09%) Front End Development
8 47 (10.09%) Scrum
9 46 (9.87%) Full Stack Development
10 42 (9.01%) Wireframes
11 39 (8.37%) User-Centered Design (UCD)
12 37 (7.94%) Analytics
12 37 (7.94%) Code Quality
12 37 (7.94%) Roadmaps
13 35 (7.51%) DevOps
14 31 (6.65%) Service Design
15 29 (6.22%) Change Management
15 29 (6.22%) Usability Testing
Programming Languages
1 115 (24.68%) JavaScript
2 62 (13.30%) TypeScript
3 46 (9.87%) Python
4 36 (7.73%) Java
5 28 (6.01%) Go
6 26 (5.58%) SQL
7 19 (4.08%) C#
8 9 (1.93%) PHP
9 7 (1.50%) PowerShell
10 6 (1.29%) Apex Code
11 5 (1.07%) Bicep
11 5 (1.07%) Swift
12 4 (0.86%) Bash
12 4 (0.86%) Kotlin
12 4 (0.86%) SOQL
13 3 (0.64%) C
13 3 (0.64%) Shell Script
14 2 (0.43%) C++
14 2 (0.43%) Objective-C
15 1 (0.21%) T-SQL
Qualifications
1 29 (6.22%) Degree
2 28 (6.01%) Security Cleared
3 22 (4.72%) SC Cleared
4 9 (1.93%) Computer Science Degree
5 7 (1.50%) BPSS Clearance
6 5 (1.07%) DBS Check
7 4 (0.86%) AWS Certification
7 4 (0.86%) ISTQB
7 4 (0.86%) Microsoft Certification
8 3 (0.64%) Master's Degree
8 3 (0.64%) MCSA
9 2 (0.43%) CCNA
9 2 (0.43%) CCNP
9 2 (0.43%) Cisco Certification
9 2 (0.43%) IIBA
9 2 (0.43%) ISEB
9 2 (0.43%) ITIL Foundation Certificate
9 2 (0.43%) PMP
10 1 (0.21%) CBAP
10 1 (0.21%) Tableau Certification
Quality Assurance & Compliance
1 63 (13.52%) Accessibility
2 17 (3.65%) QA
3 9 (1.93%) WCAG
4 4 (0.86%) Disclosure Scotland
5 3 (0.64%) Data Quality
6 2 (0.43%) EMIR
6 2 (0.43%) GDPR
6 2 (0.43%) GxP
6 2 (0.43%) ISO/IEC 12207
6 2 (0.43%) PMO
7 1 (0.21%) HL7
7 1 (0.21%) MiFID
7 1 (0.21%) SLA
System Software
1 41 (8.80%) Docker
2 7 (1.50%) Active Directory
3 3 (0.64%) VMware Infrastructure
4 2 (0.43%) Hyper-V
4 2 (0.43%) Microsoft App-V
4 2 (0.43%) XenApp
4 2 (0.43%) XenDesktop
Systems Management
1 38 (8.15%) Kubernetes
2 11 (2.36%) Grafana
3 9 (1.93%) Single Sign-On
4 6 (1.29%) Terraform
5 3 (0.64%) Kibana
5 3 (0.64%) SCCM
6 2 (0.43%) Failover Clustering
7 1 (0.21%) AppManager
7 1 (0.21%) Microsoft Intune
Vendors
1 27 (5.79%) Microsoft
2 24 (5.15%) Adobe
3 16 (3.43%) Google
4 11 (2.36%) Oracle
4 11 (2.36%) RedPrairie
5 9 (1.93%) Salesforce
5 9 (1.93%) SAP
6 7 (1.50%) ServiceNow
7 6 (1.29%) Cadence
7 6 (1.29%) IFS
8 5 (1.07%) CyberArk
9 4 (0.86%) Pardot
9 4 (0.86%) Xamarin
10 3 (0.64%) Atlassian
10 3 (0.64%) BeyondTrust
10 3 (0.64%) CheckPoint
10 3 (0.64%) Citrix
10 3 (0.64%) Phenom
10 3 (0.64%) VMware
11 2 (0.43%) Spotify