XML Contracts with Hybrid/Remote/WFH Options

XML
UK > Work from Home

The table below provides summary statistics for remote or hybrid contract work requiring XML skills. It includes a benchmarking guide to the contractor rates offered in vacancies that cited XML over the 6 months leading up to 1 May 2025, comparing them to the same period in the previous two years.

6 months to
1 May 2025
Same period 2024 Same period 2023
Rank 200 121 219
Rank change year-on-year -79 +98 -25
Contract jobs citing XML 104 273 294
As % of all contract jobs with a WFH option 1.05% 1.78% 1.14%
As % of the Libraries, Frameworks & Software Standards category 4.06% 7.45% 4.51%
Number of daily rates quoted 72 137 195
10th Percentile £350 £375 £400
25th Percentile £410 £450 £434
Median daily rate (50th Percentile) £474 £534 £525
Median % change year-on-year -11.28% +1.71% -
75th Percentile £575 £619 £650
90th Percentile £636 £738 £798
UK median daily rate £475 £550 £545
% change year-on-year -13.64% +0.92% +3.81%
Number of hourly rates quoted 1 52 12
10th Percentile - - £63.25
25th Percentile £91.25 - £70.94
Median hourly rate £92.50 £43.00 £73.75
Median % change year-on-year +115.12% -41.69% +50.51%
75th Percentile £93.75 £51.25 £75.00
90th Percentile - - -
UK median hourly rate £27.38 £43.00 £72.50
% change year-on-year -36.33% -40.69% +52.63%

All Software Libraries and Frameworks
Work from Home

XML falls under the Software Libraries and Frameworks category. For comparison with the information above, the following table provides summary statistics for all contract job vacancies with remote or hybrid options requiring technical specification, industry standards, software libraries and framework skills.

Contract vacancies with a requirement for technical specification, industry standards, software libraries and framework skills 2,564 3,665 6,520
As % of all contract jobs with a WFH option 25.89% 23.88% 25.22%
Number of daily rates quoted 1,870 2,555 4,857
10th Percentile £365 £331 £395
25th Percentile £425 £428 £450
Median daily rate (50th Percentile) £525 £525 £540
Median % change year-on-year - -2.78% -0.46%
75th Percentile £650 £650 £663
90th Percentile £825 £775 £753
UK median daily rate £525 £530 £550
% change year-on-year -0.94% -3.64% -
Number of hourly rates quoted 31 93 80
10th Percentile £52.50 £28.00 £22.50
25th Percentile £61.25 - £42.13
Median hourly rate £65.00 £43.00 £63.25
Median % change year-on-year +51.16% -32.02% +29.08%
75th Percentile £70.25 £62.00 £75.00
90th Percentile £93.75 £72.50 £80.25
UK median hourly rate £65.00 £46.18 £65.00
% change year-on-year +40.75% -28.95% +32.65%

XML
Trend for Jobs with a WFH Option

Job vacancies with remote working options citing XML as a proportion of all IT jobs advertised.
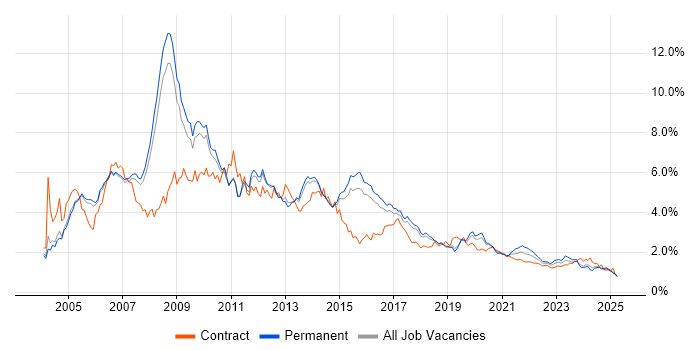
XML trend for jobs with Hybrid/Remote/WFH options

XML
Daily Rate Trend for Jobs with a WFH Option

3-month moving average daily rate quoted in job vacancies with remote working options citing XML.

XML daily rate for jobs with a WFH option

XML
Daily Rate Histogram for Jobs with a WFH Option

Daily rate distribution for jobs with remote working options citing XML over the 6 months to 1 May 2025.

XML daily rate histogram for jobs with a WFH option

XML
Hourly Rate Trend for Jobs with a WFH Option

3-month moving average hourly rate quoted in job vacancies with remote working options citing XML.

XML hourly rate for jobs with a WFH option

XML
Co-occurring Skills and Capabilities with WFH Options by Category

The follow tables expand on the table above by listing co-occurrences grouped by category. The same employment type, locality and period is covered with up to 20 co-occurrences shown in each of the following categories:

Application Platforms
1 6 (5.77%) WebSphere
2 5 (4.81%) Apache
2 5 (4.81%) Moodle
2 5 (4.81%) NetWeaver
2 5 (4.81%) WebLogic
3 4 (3.85%) Confluence
4 3 (2.88%) Anypoint
4 3 (2.88%) Mule
5 2 (1.92%) BizTalk Server
5 2 (1.92%) Camunda
5 2 (1.92%) JBoss
5 2 (1.92%) MQSeries
5 2 (1.92%) WebSphere Application Server
6 1 (0.96%) Appian
6 1 (0.96%) Drupal
6 1 (0.96%) IIS
6 1 (0.96%) Mule ESB
6 1 (0.96%) Oracle Workflow
6 1 (0.96%) Tomcat
Applications
1 5 (4.81%) Siemens NX
2 2 (1.92%) Microsoft Excel
3 1 (0.96%) MS Visio
3 1 (0.96%) Notepad++
Business Applications
1 5 (4.81%) Teamcenter
2 4 (3.85%) Oracle Assets
2 4 (3.85%) Oracle Cash Management
2 4 (3.85%) Oracle General Ledger
2 4 (3.85%) Oracle Payables
2 4 (3.85%) Oracle Receivables
3 2 (1.92%) iTrent
3 2 (1.92%) Misys Midas
4 1 (0.96%) Adobe Campaign
4 1 (0.96%) BASE24
4 1 (0.96%) Dynamics CRM
4 1 (0.96%) Maximo
4 1 (0.96%) Oracle EBS
4 1 (0.96%) Oracle iRecruitment
4 1 (0.96%) SAP S/4HANA
4 1 (0.96%) Sparx Enterprise Architect
4 1 (0.96%) UltiPro
4 1 (0.96%) Workday HCM
Cloud Services
1 18 (17.31%) Azure
2 10 (9.62%) AWS
3 7 (6.73%) SaaS
3 7 (6.73%) Serverless
4 6 (5.77%) Azure DevOps
5 5 (4.81%) Cloud Computing
6 4 (3.85%) GCP
6 4 (3.85%) OCI
6 4 (3.85%) Power Platform
7 3 (2.88%) Entra ID
8 2 (1.92%) Azure Logic Apps
8 2 (1.92%) Azure Service Bus
8 2 (1.92%) Boomi
8 2 (1.92%) GitHub
9 1 (0.96%) Azure API Management
9 1 (0.96%) Azure Event Grid
9 1 (0.96%) Azure Monitor
9 1 (0.96%) Azure Stack
9 1 (0.96%) Power Automate
9 1 (0.96%) PowerApps
Communications & Networking
1 13 (12.50%) HTTP
2 2 (1.92%) FTP
2 2 (1.92%) SMS
2 2 (1.92%) SSL
3 1 (0.96%) ATM
3 1 (0.96%) BGP
3 1 (0.96%) DHCP
3 1 (0.96%) DNS
3 1 (0.96%) DWDM
3 1 (0.96%) HTTPS
3 1 (0.96%) IGRP
3 1 (0.96%) Internet
3 1 (0.96%) IPsec
3 1 (0.96%) LAN
3 1 (0.96%) MPLS
3 1 (0.96%) OSPF
3 1 (0.96%) SNMP
3 1 (0.96%) VPN
3 1 (0.96%) WAN
3 1 (0.96%) X.21
Database & Business Intelligence
1 15 (14.42%) Oracle Reports
2 12 (11.54%) MongoDB
3 11 (10.58%) MySQL
4 10 (9.62%) Relational Database
5 9 (8.65%) SQL Server
6 8 (7.69%) NoSQL
6 8 (7.69%) RDBMS
7 6 (5.77%) PostgreSQL
8 5 (4.81%) Oracle BI Publisher
9 4 (3.85%) Data Warehouse
9 4 (3.85%) SQL Server Integration Services
10 3 (2.88%) Data Mining
10 3 (2.88%) DynamoDB
10 3 (2.88%) Redis
11 2 (1.92%) DB2
11 2 (1.92%) GIS
11 2 (1.92%) IMS/DB
11 2 (1.92%) Oracle Database
11 2 (1.92%) Power BI
11 2 (1.92%) SQL Server Reporting Services
Development Applications
1 8 (7.69%) Git
2 7 (6.73%) Postman
3 5 (4.81%) JIRA
3 5 (4.81%) PHPUnit
4 1 (0.96%) Eclipse
4 1 (0.96%) ERwin
4 1 (0.96%) Hudson
4 1 (0.96%) JUnit
4 1 (0.96%) MagicDraw
4 1 (0.96%) Maven
4 1 (0.96%) MSTest
4 1 (0.96%) NUnit
4 1 (0.96%) Ranorex
4 1 (0.96%) Selenium
4 1 (0.96%) SQL Server Management Studio (SSMS)
4 1 (0.96%) Subversion
4 1 (0.96%) Team Foundation Server
4 1 (0.96%) Toad
4 1 (0.96%) tSQLt
4 1 (0.96%) XMLSpy
General
1 28 (26.92%) Social Skills
2 22 (21.15%) Banking
3 19 (18.27%) Finance
4 9 (8.65%) Analytical Skills
4 9 (8.65%) Public Sector
5 6 (5.77%) Front Office
6 4 (3.85%) General Ledger
6 4 (3.85%) Telecoms
7 3 (2.88%) Back Office
8 2 (1.92%) Investment Banking
8 2 (1.92%) Private Banking
8 2 (1.92%) Publishing
8 2 (1.92%) Wholesale Banking
9 1 (0.96%) Financial Institution
9 1 (0.96%) German Language
9 1 (0.96%) Inclusion and Diversity
9 1 (0.96%) Law
9 1 (0.96%) Marketing
9 1 (0.96%) Organisational Skills
9 1 (0.96%) Retail
Job Titles
1 55 (52.88%) Developer
2 8 (7.69%) Oracle Developer
2 8 (7.69%) Senior
3 7 (6.73%) ServiceNow Developer
4 6 (5.77%) Analyst
4 6 (5.77%) Architect
4 6 (5.77%) DBA
4 6 (5.77%) Full-Stack Developer
4 6 (5.77%) Integration Developer
4 6 (5.77%) Java Developer
4 6 (5.77%) Senior Developer
5 5 (4.81%) Applications Engineer
5 5 (4.81%) Configuration Engineer
5 5 (4.81%) Moodle Developer
5 5 (4.81%) PostgreSQL DBA
5 5 (4.81%) SAP Developer
6 4 (3.85%) Consultant
6 4 (3.85%) Data Scientist
6 4 (3.85%) Lead
6 4 (3.85%) Report Developer
Libraries, Frameworks & Software Standards
1 42 (40.38%) JSON
2 28 (26.92%) SOAP
3 22 (21.15%) REST
4 20 (19.23%) HTML
5 18 (17.31%) Web Services
6 16 (15.38%) CSS
7 15 (14.42%) RESTful
7 15 (14.42%) XSLT
8 9 (8.65%) AngularJS
8 9 (8.65%) Kafka
8 9 (8.65%) Middleware
9 8 (7.69%) EDI
9 8 (7.69%) Oracle Fusion
10 7 (6.73%) .NET
10 7 (6.73%) JDBC
11 6 (5.77%) Ajax
11 6 (5.77%) J2EE
11 6 (5.77%) React
12 5 (4.81%) IDoc
12 5 (4.81%) SAP PI
Miscellaneous
1 7 (6.73%) Derivative
2 6 (5.77%) CMDB
3 5 (4.81%) e-Learning
3 5 (4.81%) Legacy Applications
3 5 (4.81%) Virtual Team
3 5 (4.81%) VLE
4 4 (3.85%) Data Protection Act
4 4 (3.85%) Fixed Income
4 4 (3.85%) Mobile App
5 3 (2.88%) Algorithms
5 3 (2.88%) Data Structures
5 3 (2.88%) NHS
6 2 (1.92%) AS400
6 2 (1.92%) Equities
6 2 (1.92%) Equity Derivative
6 2 (1.92%) Foreign Exchange (FX)
6 2 (1.92%) Interest Rate Derivative
6 2 (1.92%) iSeries
6 2 (1.92%) PKI
6 2 (1.92%) SWIFT Messaging Network
Operating Systems
1 8 (7.69%) Unix
2 5 (4.81%) Windows
3 4 (3.85%) Linux
4 2 (1.92%) Red Hat Enterprise Linux
5 1 (0.96%) Android
5 1 (0.96%) Apple iOS
5 1 (0.96%) Windows Server
Processes & Methodologies
1 28 (26.92%) Agile
2 16 (15.38%) Analytics
2 16 (15.38%) DevOps
3 14 (13.46%) Scrum
4 13 (12.50%) Problem-Solving
5 12 (11.54%) Business Intelligence
5 12 (11.54%) ITSM
6 11 (10.58%) Code Quality
6 11 (10.58%) Mentoring
6 11 (10.58%) User Experience
7 9 (8.65%) ITIL
8 8 (7.69%) Data Extraction
8 8 (7.69%) Data Management
8 8 (7.69%) Incident Management
8 8 (7.69%) Microservices
8 8 (7.69%) Performance Optimisation
8 8 (7.69%) Problem Management
8 8 (7.69%) System Integration Testing
9 7 (6.73%) Actionable Insight
9 7 (6.73%) User Acceptance Testing
Programming Languages
1 47 (45.19%) SQL
2 25 (24.04%) JavaScript
3 21 (20.19%) Java
4 13 (12.50%) PL/SQL
5 11 (10.58%) Python
6 7 (6.73%) C#
7 5 (4.81%) ABAP
7 5 (4.81%) PHP
8 4 (3.85%) PowerShell
9 3 (2.88%) ActionScript
9 3 (2.88%) ActionScript 2.0
10 2 (1.92%) DataWeave
10 2 (1.92%) Kotlin
10 2 (1.92%) Perl
10 2 (1.92%) REXX
10 2 (1.92%) RPG
10 2 (1.92%) Ruby
10 2 (1.92%) Scala
10 2 (1.92%) TypeScript
10 2 (1.92%) XQuery
Qualifications
1 20 (19.23%) Security Cleared
2 19 (18.27%) SC Cleared
3 4 (3.85%) Degree
4 2 (1.92%) Azure Certification
5 1 (0.96%) BPSS Clearance
5 1 (0.96%) CCDP
5 1 (0.96%) Cisco Certification
5 1 (0.96%) Computer Science Degree
5 1 (0.96%) ISEB
5 1 (0.96%) ISTQB
5 1 (0.96%) ISTQB Foundation Certification
Quality Assurance & Compliance
1 7 (6.73%) Data Quality
1 7 (6.73%) QA
2 3 (2.88%) Actionable Recommendations
3 2 (1.92%) ISO/IEC 20000
4 1 (0.96%) Disclosure Scotland
4 1 (0.96%) EMIR
4 1 (0.96%) GRC
4 1 (0.96%) HL7
4 1 (0.96%) ISO 20022
4 1 (0.96%) MiFID
4 1 (0.96%) SLA
System Software
1 7 (6.73%) Docker
2 3 (2.88%) Active Directory
3 2 (1.92%) Apache ZooKeeper
Systems Management
1 2 (1.92%) Control-M
1 2 (1.92%) Istio
1 2 (1.92%) Kubernetes
2 1 (0.96%) CloudHub
2 1 (0.96%) SCOM
Vendors
1 28 (26.92%) Oracle
2 15 (14.42%) ServiceNow
3 9 (8.65%) SAP
4 7 (6.73%) Microsoft
5 6 (5.77%) IBM
6 5 (4.81%) MuleSoft
7 3 (2.88%) Murex
7 3 (2.88%) Pega
7 3 (2.88%) Sybase
8 2 (1.92%) Bloomberg
8 2 (1.92%) Red Hat
8 2 (1.92%) webMethods
9 1 (0.96%) Adobe
9 1 (0.96%) Cisco
9 1 (0.96%) Citrix
9 1 (0.96%) Cognos
9 1 (0.96%) Dell
9 1 (0.96%) HP
9 1 (0.96%) Juniper
9 1 (0.96%) Salesforce