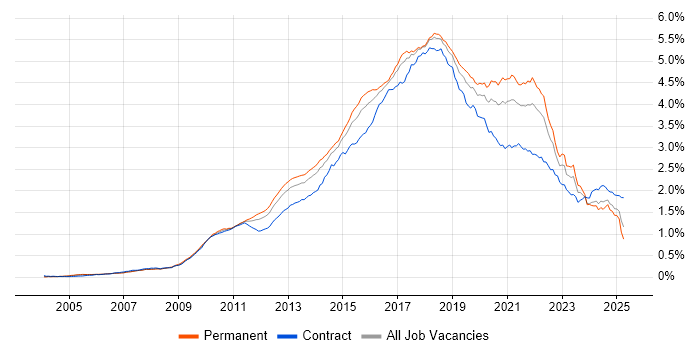
Continuous Integration Job Trends in England

Continuous Integration
UK > England

The table below provides summary statistics and salary benchmarking for jobs advertised in England requiring Continuous Integration skills. It covers vacancies from the 6 months leading up to 16 September 2025, with comparisons to the same periods in the previous two years.

6 months to
16 Sep 2025
Same period 2024 Same period 2023
Rank 356 169 155
Rank change year-on-year -187 -14 -74
Permanent jobs citing Continuous Integration 306 1,068 1,170
As % of all permanent jobs advertised in England 0.71% 1.56% 2.12%
As % of the Processes & Methodologies category 0.80% 1.91% 2.25%
Number of salaries quoted 167 610 811
10th Percentile £55,000 £47,539 £46,350
25th Percentile £57,500 £55,000 £56,063
Median annual salary (50th Percentile) £70,000 £70,000 £69,447
Median % change year-on-year - +0.80% +2.88%
75th Percentile £85,000 £85,000 £83,750
90th Percentile £111,250 £105,000 £97,500
UK median annual salary £70,000 £69,308 £70,000
% change year-on-year +1.00% -0.99% +3.70%

All Process and Methodology Skills
England

Continuous Integration falls under the Processes and Methodologies category. For comparison with the information above, the following table provides summary statistics for all permanent job vacancies requiring process or methodology skills in England.

Permanent vacancies with a requirement for process or methodology skills 38,240 55,872 51,975
As % of all permanent jobs advertised in England 88.75% 81.49% 94.32%
Number of salaries quoted 21,893 31,960 38,921
10th Percentile £28,750 £32,000 £33,500
25th Percentile £37,500 £42,500 £45,000
Median annual salary (50th Percentile) £55,000 £57,500 £62,000
Median % change year-on-year -4.35% -7.26% +3.33%
75th Percentile £76,250 £77,500 £81,250
90th Percentile £97,500 £96,250 £100,000
UK median annual salary £55,000 £57,500 £60,000
% change year-on-year -4.35% -4.17% -

Continuous Integration
Job Vacancy Trend in England

Job postings citing Continuous Integration as a proportion of all IT jobs advertised in England.

Job vacancy trend for Continuous Integration in England

Continuous Integration
Salary Trend in England

Salary distribution trend for jobs in England citing Continuous Integration.

Salary distribution trend for jobs in England citing Continuous Integration

Continuous Integration
Salary Histogram in England

Salary distribution for jobs citing Continuous Integration in England over the 6 months to 16 September 2025.

Salary histogram for Continuous Integration in England

Continuous Integration
Job Locations in England

The table below looks at the demand and provides a guide to the median salaries quoted in IT jobs citing Continuous Integration within the England region over the 6 months to 16 September 2025. The 'Rank Change' column provides an indication of the change in demand within each location based on the same 6 month period last year.

Location Rank Change
on Same Period
Last Year
Matching
Permanent
IT Job Ads
Median Salary
Past 6 Months
Median Salary
% Change
on Same Period
Last Year
Live
Jobs
London -43 187 £76,250 +1.13% 85
North of England -96 37 £62,500 +4.17% 40
Midlands +27 34 £65,000 +8.33% 17
North West -96 29 £65,000 - 25
West Midlands +20 28 £62,500 -3.85% 13
South East -141 24 £72,000 +2.86% 41
South West -8 17 £60,000 -14.29% 9
East Midlands +18 6 £67,500 +12.50% 4
Yorkshire -29 5 £72,626 +32.05% 8
East of England -25 4 £54,000 -30.32% 17
North East +2 3 £60,000 -7.69% 7
Continuous Integration
UK

Continuous Integration
Co-occurring Skills and Capabilities in England by Category

The follow tables expand on the table above by listing co-occurrences grouped by category. The same employment type, locality and period is covered with up to 20 co-occurrences shown in each of the following categories:

Application Platforms
1 10 (3.27%) Confluence
2 6 (1.96%) Apache Airflow
3 5 (1.63%) Apache
4 3 (0.98%) Apache Spark
Applications
1 1 (0.33%) GNU Octave
1 1 (0.33%) Microsoft PowerPoint
1 1 (0.33%) MS Visio
1 1 (0.33%) Photoshop
Business Applications
1 7 (2.29%) Dynamics CRM
2 4 (1.31%) Salesforce CRM
3 3 (0.98%) NetSuite
4 2 (0.65%) Payment Gateway
Cloud Services
1 135 (44.12%) AWS
2 114 (37.25%) Azure
3 41 (13.40%) GCP
4 35 (11.44%) Azure DevOps
5 34 (11.11%) Amazon S3
5 34 (11.11%) Serverless
6 32 (10.46%) Amazon EC2
6 32 (10.46%) Power Platform
7 30 (9.80%) Dynamics 365
8 29 (9.48%) AWS Lambda
9 28 (9.15%) Amazon CloudWatch
10 26 (8.50%) AWS CloudFormation
10 26 (8.50%) SaaS
11 24 (7.84%) Power Automate
12 21 (6.86%) GitHub
13 19 (6.21%) Route 53
14 15 (4.90%) Amazon SQS
15 14 (4.58%) GitHub Actions
16 13 (4.25%) PowerApps
17 12 (3.92%) AWS KMS
Communications & Networking
1 9 (2.94%) Firewall
2 8 (2.61%) Broadband
2 8 (2.61%) Multicast
2 8 (2.61%) TCP/IP
3 7 (2.29%) WAN
4 4 (1.31%) 5G
4 4 (1.31%) SD-WAN
5 3 (0.98%) BGP
5 3 (0.98%) Cisco IOS
5 3 (0.98%) LAN
5 3 (0.98%) NX-OS
5 3 (0.98%) OSPF
5 3 (0.98%) Software-Defined Networking
5 3 (0.98%) VPN
5 3 (0.98%) VXLAN
6 2 (0.65%) DNS
6 2 (0.65%) SAN
7 1 (0.33%) HTTP
Database & Business Intelligence
1 35 (11.44%) DynamoDB
2 25 (8.17%) Amazon RDS
3 21 (6.86%) NoSQL
3 21 (6.86%) Relational Database
4 18 (5.88%) PostgreSQL
5 11 (3.59%) Amazon Aurora
6 10 (3.27%) MySQL
6 10 (3.27%) SQL Server
7 9 (2.94%) Data Warehouse
8 7 (2.29%) Elasticsearch
8 7 (2.29%) MongoDB
9 5 (1.63%) Power BI
10 4 (1.31%) GIS
10 4 (1.31%) Snowflake Schema
11 3 (0.98%) SQL Server Integration Services
12 2 (0.65%) Azure SQL Database
12 2 (0.65%) Big Data
12 2 (0.65%) Metadata
12 2 (0.65%) Oracle Database
12 2 (0.65%) RDBMS
Development Applications
1 70 (22.88%) Git
2 64 (20.92%) Jenkins
3 36 (11.76%) JIRA
4 32 (10.46%) GitLab
5 20 (6.54%) SonarQube
6 16 (5.23%) JUnit
6 16 (5.23%) Maven
7 13 (4.25%) CircleCI
8 12 (3.92%) DbUnit
8 12 (3.92%) jMock
8 12 (3.92%) Mockito
9 11 (3.59%) Bitbucket Server
10 8 (2.61%) Selenium
11 6 (1.96%) LoadRunner
12 5 (1.63%) Bitbucket
12 5 (1.63%) JMeter
13 4 (1.31%) TeamCity
14 3 (0.98%) Appium
14 3 (0.98%) Cypress.io
14 3 (0.98%) Subversion
General
1 108 (35.29%) Finance
2 104 (33.99%) Social Skills
3 63 (20.59%) Inclusion and Diversity
4 51 (16.67%) Law
5 42 (13.73%) Banking
6 40 (13.07%) Marketing
7 25 (8.17%) Analytical Skills
7 25 (8.17%) Public Sector
8 17 (5.56%) Front Office
8 17 (5.56%) Presentation Skills
9 13 (4.25%) Games
9 13 (4.25%) Investment Banking
10 10 (3.27%) Retail
11 9 (2.94%) Legal
11 9 (2.94%) Organisational Skills
12 6 (1.96%) Influencing Skills
13 5 (1.63%) Electronics
13 5 (1.63%) Publishing
14 4 (1.31%) Financial Institution
14 4 (1.31%) General Ledger
Job Titles
1 84 (27.45%) Developer
1 84 (27.45%) Senior
2 66 (21.57%) Lead
3 63 (20.59%) Software Engineer
4 29 (9.48%) Senior Developer
5 24 (7.84%) Java Developer
6 21 (6.86%) Senior Software Engineer
7 20 (6.54%) Python Engineer
8 18 (5.88%) Consultant
8 18 (5.88%) DevOps Engineer
8 18 (5.88%) Lead Software Engineer
9 17 (5.56%) Platform Engineer
10 16 (5.23%) Lead Developer
11 15 (4.90%) Java Engineer
12 14 (4.58%) Dynamics 365 Consultant
13 13 (4.25%) Functional Consultant
13 13 (4.25%) Java Software Engineer
14 12 (3.92%) AWS Developer
14 12 (3.92%) Python Software Engineer
15 11 (3.59%) C++ Software Engineer
Libraries, Frameworks & Software Standards
1 55 (17.97%) React
2 51 (16.67%) RESTful
3 33 (10.78%) REST
4 30 (9.80%) Spring
5 26 (8.50%) HTML
6 24 (7.84%) CSS
6 24 (7.84%) Kafka
7 20 (6.54%) .NET
7 20 (6.54%) AngularJS
7 20 (6.54%) Spring Boot
8 19 (6.21%) Web Services
9 18 (5.88%) Elastic Stack
10 15 (4.90%) OAuth
11 13 (4.25%) GraphQL
11 13 (4.25%) Hibernate
11 13 (4.25%) RabbitMQ
12 12 (3.92%) ActiveMQ
12 12 (3.92%) PowerMock
12 12 (3.92%) SOAP
12 12 (3.92%) Spring Batch
Miscellaneous
1 34 (11.11%) Management Information System
2 22 (7.19%) Distributed Systems
3 20 (6.54%) Algorithms
3 20 (6.54%) Data Structures
4 18 (5.88%) Cloud Native
5 17 (5.56%) Derivative
6 16 (5.23%) Private Cloud
6 16 (5.23%) Public Cloud
7 15 (4.90%) Distributed Architecture
8 14 (4.58%) Product Ownership
9 12 (3.92%) Virtual Team
10 10 (3.27%) Equities
11 9 (2.94%) e-Learning
12 8 (2.61%) Fixed Income
12 8 (2.61%) Mobile App
13 5 (1.63%) Data Protection Act
13 5 (1.63%) Enterprise Software
13 5 (1.63%) Foreign Exchange (FX)
13 5 (1.63%) Legacy Code
13 5 (1.63%) Self-Motivation
Operating Systems
1 54 (17.65%) Linux
2 18 (5.88%) Unix
3 16 (5.23%) Windows
4 10 (3.27%) Windows Server
5 8 (2.61%) Android
5 8 (2.61%) Debian
5 8 (2.61%) Ubuntu
6 7 (2.29%) Apple iOS
7 1 (0.33%) FreeRTOS
Processes & Methodologies
1 179 (58.50%) Agile
2 175 (57.19%) CI/CD
3 118 (38.56%) DevOps
4 104 (33.99%) Software Engineering
5 89 (29.08%) Test Automation
6 77 (25.16%) Microservices
7 76 (24.84%) TDD
8 69 (22.55%) Problem-Solving
9 67 (21.90%) Containerisation
10 63 (20.59%) Mentoring
11 61 (19.93%) Scrum
12 60 (19.61%) Computer Science
12 60 (19.61%) Infrastructure as Code
13 56 (18.30%) Continuous Delivery
14 49 (16.01%) Continuous Deployment
15 47 (15.36%) SDLC
16 43 (14.05%) Code Quality
16 43 (14.05%) Stakeholder Management
17 37 (12.09%) Continuous Improvement
18 35 (11.44%) Artificial Intelligence
Programming Languages
1 110 (35.95%) Python
2 88 (28.76%) Java
3 57 (18.63%) JavaScript
4 56 (18.30%) SQL
5 47 (15.36%) TypeScript
6 32 (10.46%) Go
7 28 (9.15%) Bash
8 26 (8.50%) C#
9 18 (5.88%) PowerShell
10 17 (5.56%) C++
10 17 (5.56%) Shell Script
11 7 (2.29%) Swift
12 6 (1.96%) Kotlin
13 5 (1.63%) PL/SQL
14 4 (1.31%) Objective-C
14 4 (1.31%) Scala
15 3 (0.98%) Bicep
15 3 (0.98%) PHP
16 2 (0.65%) Rust
16 2 (0.65%) XQuery
Qualifications
1 54 (17.65%) Degree
2 36 (11.76%) Computer Science Degree
3 29 (9.48%) Security Cleared
4 21 (6.86%) SC Cleared
5 19 (6.21%) Master's Degree
6 12 (3.92%) Azure Certification
7 10 (3.27%) AWS Certification
8 8 (2.61%) Microsoft Certification
9 7 (2.29%) DV Cleared
10 6 (1.96%) PhD
11 4 (1.31%) Cisco Certification
11 4 (1.31%) CISSP
12 3 (0.98%) (ISC)2 CCSP
12 3 (0.98%) CCSP
13 2 (0.65%) AWS Certified DevOps Engineer
13 2 (0.65%) AWS Certified Solutions Architect
13 2 (0.65%) ISTQB
13 2 (0.65%) ISTQB Foundation Certification
13 2 (0.65%) MCSE
13 2 (0.65%) VMware Certified Professional (VCP)
Quality Assurance & Compliance
1 49 (16.01%) QA
2 18 (5.88%) Accessibility
3 5 (1.63%) PMO
4 4 (1.31%) GDPR
4 4 (1.31%) ISO/IEC 27001
5 3 (0.98%) NIST
5 3 (0.98%) SOC 2
6 2 (0.65%) Sarbanes-Oxley
6 2 (0.65%) SEPA
7 1 (0.33%) ISO 9001
System Software
1 84 (27.45%) Docker
2 8 (2.61%) VMware Infrastructure
3 4 (1.31%) Postfix
3 4 (1.31%) Virtual Machines
4 3 (0.98%) vCloud
5 2 (0.65%) VMware ESXi
5 2 (0.65%) vSphere
Systems Management
1 75 (24.51%) Kubernetes
2 65 (21.24%) Terraform
3 41 (13.40%) Grafana
4 38 (12.42%) Ansible
5 33 (10.78%) Prometheus
6 10 (3.27%) Progress Chef
7 5 (1.63%) Docker Swarm
8 4 (1.31%) Argo
8 4 (1.31%) Puppet
8 4 (1.31%) Rancher
8 4 (1.31%) Single Sign-On
8 4 (1.31%) vRealize
9 3 (0.98%) Rundeck
10 2 (0.65%) Control-M
10 2 (0.65%) Kustomize
11 1 (0.33%) Consul
11 1 (0.33%) HP Quality Center
11 1 (0.33%) Nagios
11 1 (0.33%) Packer
11 1 (0.33%) Salt
Vendors
1 43 (14.05%) Microsoft
2 22 (7.19%) Google
3 18 (5.88%) Splunk
4 14 (4.58%) Atlassian
4 14 (4.58%) VMware
5 10 (3.27%) SolarWinds
6 8 (2.61%) Dynatrace
6 8 (2.61%) Hitachi
6 8 (2.61%) Oracle
7 5 (1.63%) ServiceNow
8 4 (1.31%) Cisco
8 4 (1.31%) Jaspersoft
8 4 (1.31%) Salesforce
9 3 (0.98%) Alibaba
9 3 (0.98%) CA Agile Central
9 3 (0.98%) MuleSoft
9 3 (0.98%) OpenAI
10 2 (0.65%) AppDynamics
10 2 (0.65%) Foundry
10 2 (0.65%) LogicMonitor