Scrum Jobs in the South East

Scrum
England > South East

The table below provides summary statistics for permanent job vacancies advertised in the South East requiring Scrum skills. It includes a benchmarking guide to the annual salaries offered in vacancies that cited Scrum over the 6 months leading up to 1 May 2025, comparing them to the same period in the previous two years.

6 months to
1 May 2025
Same period 2024 Same period 2023
Rank 120 78 44
Rank change year-on-year -42 -34 -18
Permanent jobs citing Scrum 197 545 909
As % of all permanent jobs advertised in the South East 2.33% 3.27% 6.07%
As % of the Processes & Methodologies category 2.56% 3.85% 6.42%
Number of salaries quoted 111 384 564
10th Percentile £46,250 £42,500 £45,225
25th Percentile £59,375 £48,750 £52,500
Median annual salary (50th Percentile) £62,500 £60,000 £65,000
Median % change year-on-year +4.17% -7.69% +8.33%
75th Percentile £72,500 £73,750 £77,500
90th Percentile £87,500 £88,375 £92,500
England median annual salary £65,000 £60,000 £67,500
% change year-on-year +8.33% -11.11% +3.85%

All Process and Methodology Skills
South East

Scrum falls under the Processes and Methodologies category. For comparison with the information above, the following table provides summary statistics for all permanent job vacancies requiring process or methodology skills in the South East.

Permanent vacancies with a requirement for process or methodology skills 7,705 14,150 14,159
As % of all permanent jobs advertised in the South East 91.03% 84.80% 94.48%
Number of salaries quoted 4,103 9,942 8,229
10th Percentile £30,000 £27,500 £30,500
25th Percentile £41,250 £36,250 £41,250
Median annual salary (50th Percentile) £55,000 £50,000 £55,000
Median % change year-on-year +10.00% -9.09% -
75th Percentile £70,000 £65,000 £72,500
90th Percentile £80,000 £77,500 £86,250
England median annual salary £57,500 £55,000 £62,500
% change year-on-year +4.55% -12.00% +4.17%

Scrum
Job Vacancy Trend in the South East

Job postings citing Scrum as a proportion of all IT jobs advertised in the South East.
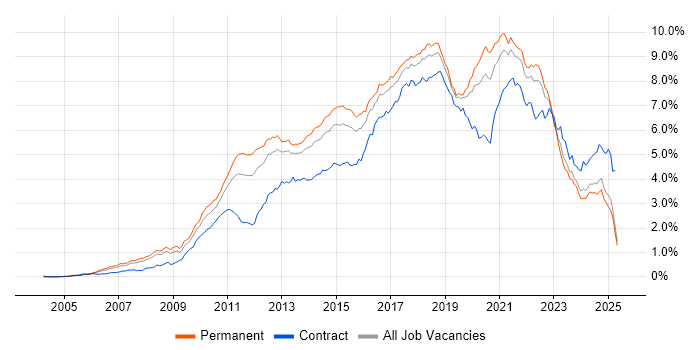
Job vacancy trend for Scrum in the South East

Scrum
Salary Trend in the South East

3-month moving average salary quoted in jobs citing Scrum in the South East.

Salary trend for Scrum in the South East

Scrum
Salary Histogram in the South East

Salary distribution for jobs citing Scrum in the South East over the 6 months to 1 May 2025.

Salary histogram for Scrum in the South East

Scrum
Job Locations in the South East

The table below looks at the demand and provides a guide to the median salaries quoted in IT jobs citing Scrum within the South East region over the 6 months to 1 May 2025. The 'Rank Change' column provides an indication of the change in demand within each location based on the same 6 month period last year.

Location Rank Change
on Same Period
Last Year
Matching
Permanent
IT Job Ads
Median Salary
Past 6 Months
Median Salary
% Change
on Same Period
Last Year
Live
Jobs
Thames Valley -10 98 £66,250 +10.42% 58
Berkshire +3 67 £62,500 -3.85% 26
Hampshire +12 48 £60,000 -7.69% 56
Oxfordshire +8 22 £70,000 +40.00% 20
West Sussex +22 19 £62,500 -3.85% 13
Surrey +15 19 £82,500 +50.00% 19
Buckinghamshire +6 9 £65,500 +13.91% 17
Kent +2 7 £57,500 +4.55% 25
Middlesex -6 4 - - 2
East Sussex +21 1 £125,000 +150.00% 15
Scrum
England

Scrum
Co-occurring Skills and Capabilities in the South East by Category

The follow tables expand on the table above by listing co-occurrences grouped by category. The same employment type, locality and period is covered with up to 20 co-occurrences shown in each of the following categories:

Application Platforms
1 14 (7.11%) CMS
2 12 (6.09%) JBoss
2 12 (6.09%) Red Hat Fuse
3 11 (5.58%) Kentico
4 6 (3.05%) OpenStack
5 5 (2.54%) Confluence
6 3 (1.52%) Umbraco
7 2 (1.02%) Apache
7 2 (1.02%) Sitefinity
8 1 (0.51%) EPiServer
8 1 (0.51%) Sitecore CMS
Applications
1 3 (1.52%) Productboard
1 3 (1.52%) Trello
2 2 (1.02%) Microsoft Project
3 1 (0.51%) Microsoft Excel
3 1 (0.51%) Microsoft Office
3 1 (0.51%) Microsoft PowerPoint
3 1 (0.51%) Notion
Business Applications
1 1 (0.51%) TrackWise
Cloud Services
1 66 (33.50%) AWS
2 61 (30.96%) Azure
3 35 (17.77%) Serverless
4 31 (15.74%) Amazon ECS
4 31 (15.74%) Amazon EKS
5 25 (12.69%) Amazon EC2
6 14 (7.11%) Amazon S3
7 13 (6.60%) Azure DevOps
8 12 (6.09%) Amazon SQS
8 12 (6.09%) SaaS
9 10 (5.08%) Kontent
10 8 (4.06%) Amazon CloudWatch
10 8 (4.06%) Azure Data Factory
10 8 (4.06%) Power Platform
11 7 (3.55%) Azure Synapse Analytics
11 7 (3.55%) Virtual Private Cloud
12 5 (2.54%) AWS KMS
12 5 (2.54%) Collibra
12 5 (2.54%) GCP
12 5 (2.54%) Microsoft Purview
Communications & Networking
1 3 (1.52%) 3G
1 3 (1.52%) GPRS
1 3 (1.52%) LTE
1 3 (1.52%) Modbus
1 3 (1.52%) Wireless
2 1 (0.51%) Bluetooth
2 1 (0.51%) Internet
2 1 (0.51%) Intranet
2 1 (0.51%) ZigBee
Database & Business Intelligence
1 50 (25.38%) PostgreSQL
2 32 (16.24%) Relational Database
3 13 (6.60%) RDBMS
4 8 (4.06%) NoSQL
5 6 (3.05%) SQL Server
6 5 (2.54%) Amazon RDS
6 5 (2.54%) Azure SQL Database
6 5 (2.54%) Power BI
7 4 (2.03%) Elasticsearch
7 4 (2.03%) Redis
8 3 (1.52%) Big Data
8 3 (1.52%) MySQL
9 2 (1.02%) Apache Cassandra
9 2 (1.02%) Azure SQL Data Warehouse
9 2 (1.02%) Couchbase
9 2 (1.02%) Data Lake
9 2 (1.02%) Data Warehouse
9 2 (1.02%) Geospatial Data
9 2 (1.02%) MongoDB
10 1 (0.51%) DynamoDB
Development Applications
1 44 (22.34%) Jenkins
2 38 (19.29%) Git
3 37 (18.78%) JUnit
4 33 (16.75%) JIRA
5 21 (10.66%) Mockito
6 14 (7.11%) JMeter
7 5 (2.54%) DbUnit
7 5 (2.54%) jMock
7 5 (2.54%) Maven
7 5 (2.54%) SonarQube
8 4 (2.03%) Gatling
9 3 (1.52%) ESLint
9 3 (1.52%) GitLab
9 3 (1.52%) TeamCity
10 2 (1.02%) Cucumber
10 2 (1.02%) Cypress.io
10 2 (1.02%) Octopus Deploy
10 2 (1.02%) Selenium
10 2 (1.02%) TestNG
10 2 (1.02%) webpack
General
1 75 (38.07%) Social Skills
2 48 (24.37%) Finance
3 38 (19.29%) Public Sector
4 25 (12.69%) Law
5 22 (11.17%) Analytical Skills
6 15 (7.61%) Manufacturing
6 15 (7.61%) Marketing
7 10 (5.08%) Organisational Skills
8 5 (2.54%) Presentation Skills
9 4 (2.03%) Advertising
9 4 (2.03%) Banking
9 4 (2.03%) Inclusion and Diversity
9 4 (2.03%) Retail
10 3 (1.52%) Electronics
10 3 (1.52%) Telecoms
11 2 (1.02%) Influencing Skills
11 2 (1.02%) Legal
12 1 (0.51%) Documentation Skills
12 1 (0.51%) Publishing
Job Titles
1 49 (24.87%) Developer
2 38 (19.29%) Lead
3 35 (17.77%) Java Developer
4 22 (11.17%) Product Manager
4 22 (11.17%) Team Leader
5 21 (10.66%) Software Team Leader
6 17 (8.63%) Project Manager
7 14 (7.11%) Development Manager
7 14 (7.11%) Senior
8 11 (5.58%) Software Manager
9 10 (5.08%) Web Manager
9 10 (5.08%) Web Project Manager
10 9 (4.57%) Analyst
10 9 (4.57%) Software Development Manager
10 9 (4.57%) Software Engineer
11 8 (4.06%) Digital Project Manager
11 8 (4.06%) Engineering Manager
11 8 (4.06%) Full-Stack Developer
11 8 (4.06%) Scrum Master
12 7 (3.55%) Java Development Manager
Libraries, Frameworks & Software Standards
1 48 (24.37%) REST
2 36 (18.27%) Spring
2 36 (18.27%) Web Services
3 32 (16.24%) Spring Boot
4 27 (13.71%) RESTful
5 26 (13.20%) Apache Camel
6 24 (12.18%) React
7 22 (11.17%) SOAP
8 19 (9.64%) Hibernate
9 18 (9.14%) ActiveMQ
9 18 (9.14%) HTML
10 17 (8.63%) .NET
11 15 (7.61%) Kafka
12 13 (6.60%) jQuery
12 13 (6.60%) WireMock
13 12 (6.09%) J2EE
14 9 (4.57%) AngularJS
14 9 (4.57%) Mustache
15 8 (4.06%) ASP.NET
16 7 (3.55%) Node.js
Miscellaneous
1 47 (23.86%) Product Ownership
2 37 (18.78%) Distributed Systems
3 19 (9.64%) PMI
4 17 (8.63%) FMCG
5 6 (3.05%) IoT
6 5 (2.54%) Mobile App
7 4 (2.03%) Virtual Team
8 3 (1.52%) AS400
8 3 (1.52%) Management Information System
8 3 (1.52%) NB-IoT
9 2 (1.02%) Analytical Mindset
9 2 (1.02%) Cloud Native
9 2 (1.02%) Enterprise Software
9 2 (1.02%) Onboarding
9 2 (1.02%) Private Cloud
9 2 (1.02%) Public Cloud
10 1 (0.51%) Biopharmaceutical
10 1 (0.51%) Distributed Computing
10 1 (0.51%) Legacy Systems
10 1 (0.51%) Life Science
Operating Systems
1 9 (4.57%) Linux
2 3 (1.52%) Android
2 3 (1.52%) Apple iOS
3 1 (0.51%) Unix
3 1 (0.51%) Windows
Processes & Methodologies
1 176 (89.34%) Agile
2 62 (31.47%) DevOps
3 59 (29.95%) Microservices
4 48 (24.37%) Kanban
5 46 (23.35%) CI/CD
6 43 (21.83%) TDD
7 42 (21.32%) Problem-Solving
8 41 (20.81%) Continuous Improvement
9 38 (19.29%) Line Management
10 36 (18.27%) Project Management
11 35 (17.77%) BDD
12 34 (17.26%) Product Management
13 33 (16.75%) Coaching
14 30 (15.23%) Software Engineering
14 30 (15.23%) Test Automation
15 28 (14.21%) Full-Stack Development
16 27 (13.71%) Containerisation
17 25 (12.69%) Business Strategy
18 24 (12.18%) SDLC
19 23 (11.68%) Performance Metrics
Programming Languages
1 75 (38.07%) Java
2 41 (20.81%) C#
2 41 (20.81%) JavaScript
3 23 (11.68%) Python
3 23 (11.68%) SQL
4 21 (10.66%) Rust
5 13 (6.60%) Shell Script
6 5 (2.54%) Go
7 3 (1.52%) Kotlin
7 3 (1.52%) PowerShell
7 3 (1.52%) Swift
8 2 (1.02%) PHP
8 2 (1.02%) TypeScript
9 1 (0.51%) C++
9 1 (0.51%) Data Analysis Expressions
9 1 (0.51%) Delphi
9 1 (0.51%) Embedded C++
Qualifications
1 44 (22.34%) Security Cleared
2 38 (19.29%) SC Cleared
3 21 (10.66%) Degree
4 19 (9.64%) PMI Certification
5 13 (6.60%) Computer Science Degree
6 6 (3.05%) PMP
7 5 (2.54%) Master's Degree
7 5 (2.54%) MBA
8 4 (2.03%) DV Cleared
9 2 (1.02%) AWS Certification
9 2 (1.02%) Azure Certification
9 2 (1.02%) CISM
9 2 (1.02%) CISSP
9 2 (1.02%) ISTQB
9 2 (1.02%) ISTQB Advanced Certification
10 1 (0.51%) CEH
10 1 (0.51%) DBS Check
10 1 (0.51%) GIAC
10 1 (0.51%) Microsoft Certification
10 1 (0.51%) Six Sigma Black Belt
Quality Assurance & Compliance
1 26 (13.20%) QA
2 12 (6.09%) SLA
3 6 (3.05%) Data Quality
4 3 (1.52%) PMO
5 2 (1.02%) Accessibility
5 2 (1.02%) ISO/IEC 27001
6 1 (0.51%) Actionable Recommendations
6 1 (0.51%) GDPR
6 1 (0.51%) GLP
6 1 (0.51%) GMP
6 1 (0.51%) GRC
6 1 (0.51%) GxP
6 1 (0.51%) ISO 9001
6 1 (0.51%) PCI DSS
6 1 (0.51%) SOC 2
6 1 (0.51%) WCAG
System Software
1 39 (19.80%) Docker
2 6 (3.05%) VMware Infrastructure
3 4 (2.03%) Hyper-V
3 4 (2.03%) vSphere
4 2 (1.02%) Postfix
4 2 (1.02%) VMware ESXi
Systems Management
1 43 (21.83%) Kubernetes
2 16 (8.12%) Ansible
3 13 (6.60%) Kibana
4 5 (2.54%) Terraform
5 4 (2.03%) Progress Chef
5 4 (2.03%) Puppet
6 2 (1.02%) vCenter Server
7 1 (0.51%) Argo
Vendors
1 64 (32.49%) Microsoft
2 13 (6.60%) Dynatrace
2 13 (6.60%) Splunk
3 11 (5.58%) Databricks
4 8 (4.06%) Atlassian
5 7 (3.55%) Cisco
6 6 (3.05%) VMware
7 5 (2.54%) Informatica
8 4 (2.03%) Oracle
8 4 (2.03%) ServiceNow
9 3 (1.52%) SAP
10 2 (1.02%) Optimizely
11 1 (0.51%) CA Agile Central
11 1 (0.51%) Genesys
11 1 (0.51%) Intel
11 1 (0.51%) Salesforce
11 1 (0.51%) Sitecore