IBM AIX
UK

The table below provides summary statistics for permanent job vacancies requiring AIX skills. It includes a benchmarking guide to the annual salaries offered in vacancies that cited AIX over the 6 months leading up to 26 July 2024, comparing them to the same period in the previous two years.

6 months to
26 Jul 2024
Same period 2023 Same period 2022
Rank 766 698 1112
Rank change year-on-year -68 +414 -157
Permanent jobs citing AIX 76 190 163
As % of all permanent jobs advertised in the UK 0.084% 0.24% 0.093%
As % of the Operating Systems category 0.66% 1.40% 0.53%
Number of salaries quoted 55 49 108
10th Percentile - £57,046 -
25th Percentile £43,750 £57,500 £40,000
Median annual salary (50th Percentile) £56,000 £69,447 £54,590
Median % change year-on-year -19.36% +27.22% +9.18%
75th Percentile £68,625 £88,750 £61,088
90th Percentile £79,500 £107,500 £72,399
UK excluding London median annual salary £47,500 £61,180 £50,000
% change year-on-year -22.36% +22.36% +5.26%

All Operating Systems
UK

AIX falls under the Operating Systems category. For comparison with the information above, the following table provides summary statistics for all permanent job vacancies requiring operating system skills.

Permanent vacancies with a requirement for operating system skills 11,570 13,584 30,885
As % of all permanent jobs advertised in the UK 12.80% 16.83% 17.62%
Number of salaries quoted 8,403 9,692 16,343
10th Percentile £26,250 £27,500 £26,500
25th Percentile £32,500 £35,000 £35,750
Median annual salary (50th Percentile) £47,500 £52,500 £52,500
Median % change year-on-year -9.52% - +5.00%
75th Percentile £62,500 £71,250 £71,250
90th Percentile £82,500 £90,000 £87,500
UK excluding London median annual salary £45,000 £45,000 £45,000

AIX
Job Vacancy Trend

Job postings citing AIX as a proportion of all IT jobs advertised.
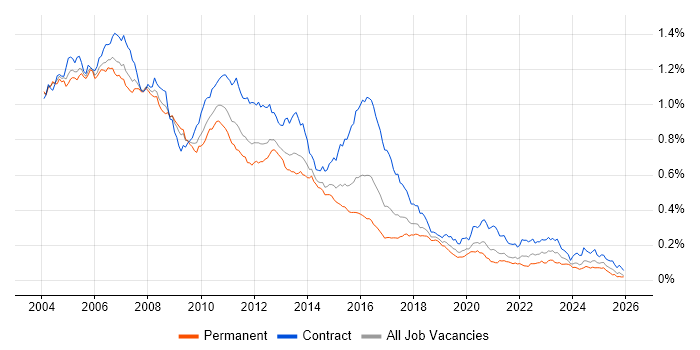
Job vacancy trend for AIX in the UK

AIX
Salary Trend

3-month moving average salary quoted in jobs citing AIX.

Salary trend for AIX in the UK

AIX
Salary Histogram

Salary distribution for jobs citing AIX over the 6 months to 26 July 2024.

Salary histogram for AIX in the UK

AIX
Top 16 Job Locations

The table below looks at the demand and provides a guide to the median salaries quoted in IT jobs citing AIX within the UK over the 6 months to 26 July 2024. The 'Rank Change' column provides an indication of the change in demand within each location based on the same 6 month period last year.

Location Rank Change
on Same Period
Last Year
Matching
Permanent
IT Job Ads
Median Salary
Past 6 Months
Median Salary
% Change
on Same Period
Last Year
Live
Jobs
England -26 65 £57,000 -17.92% 5
UK excluding London -120 55 £47,500 -22.36% 4
Work from Home +37 47 £47,500 -29.52% 3
South West -4 22 £57,000 -4.29%
London +67 19 £77,500 -6.06% 1
North of England -32 9 £47,500 -22.36% 3
South East +5 8 £53,750 -
Yorkshire +32 5 £47,500 -22.36% 3
Wales +19 5 - -
Scotland -68 4 £47,500 -
East of England - 4 £47,500 -
Midlands -29 3 £47,500 -26.92% 1
North East - 3 £47,500 -
East Midlands -37 2 £47,500 -26.92% 1
North West -26 1 £75,000 -
West Midlands - 1 £75,000 -

AIX
Co-occurring Skills and Capabilities by Category

The follow tables expand on the table above by listing co-occurrences grouped by category. The same employment type, locality and period is covered with up to 20 co-occurrences shown in each of the following categories:

Application Platforms
1 25 (32.89%) Apache
2 12 (15.79%) Microsoft Exchange
3 8 (10.53%) JBoss
4 3 (3.95%) GlassFish
4 3 (3.95%) Tomcat
Applications
1 3 (3.95%) Microsoft Excel
1 3 (3.95%) Microsoft Office
Business Applications
1 5 (6.58%) Temenos T24
2 1 (1.32%) FLEXCUBE
2 1 (1.32%) Misys Opics
Cloud Services
1 10 (13.16%) Azure
2 5 (6.58%) Azure DevOps
3 3 (3.95%) Microsoft 365
4 2 (2.63%) AWS
Communications & Networking
1 23 (30.26%) SAN
2 4 (5.26%) 5G
2 4 (5.26%) DNS
3 3 (3.95%) Reverse Proxy
4 1 (1.32%) Firewall
Database & Business Intelligence
1 29 (38.16%) SQL Server
2 22 (28.95%) MongoDB
2 22 (28.95%) PostgreSQL
3 9 (11.84%) DB2
4 8 (10.53%) Oracle Database
5 4 (5.26%) SAP HANA
6 3 (3.95%) Oracle Database 12c
6 3 (3.95%) Oracle Reports
7 2 (2.63%) GIS
7 2 (2.63%) MySQL
8 1 (1.32%) Data Lake
8 1 (1.32%) Data Warehouse
Development Applications
1 5 (6.58%) Eclipse
1 5 (6.58%) IntelliJ
1 5 (6.58%) Visual Studio Code
General
1 28 (36.84%) Finance
2 25 (32.89%) Analytical Skills
3 23 (30.26%) Social Skills
4 12 (15.79%) Banking
4 12 (15.79%) Organisational Skills
5 7 (9.21%) Law
6 5 (6.58%) Inclusion and Diversity
6 5 (6.58%) Retail
7 2 (2.63%) Back Office
7 2 (2.63%) Investment Banking
8 1 (1.32%) Public Sector
Job Titles
1 35 (46.05%) Support Engineer
2 22 (28.95%) Software Support Engineer
3 9 (11.84%) Senior
4 7 (9.21%) Applications Support
5 6 (7.89%) Administrator
5 6 (7.89%) Support Specialist
6 5 (6.58%) Applications Specialist
6 5 (6.58%) Applications Support Specialist
6 5 (6.58%) Consultant
6 5 (6.58%) Full Stack Engineer
6 5 (6.58%) Java Engineer
6 5 (6.58%) Project Consultant
6 5 (6.58%) Senior Full Stack Engineer
6 5 (6.58%) Senior Java Engineer
6 5 (6.58%) T24 Specialist
6 5 (6.58%) Unix Consultant
7 4 (5.26%) Analyst
7 4 (5.26%) DBA
7 4 (5.26%) Oracle DBA
7 4 (5.26%) Unix Specialist
Libraries, Frameworks & Software Standards
1 32 (42.11%) REST
2 27 (35.53%) SOAP
2 27 (35.53%) Web Services
3 22 (28.95%) .NET
4 9 (11.84%) LAPP Stack
5 5 (6.58%) CSS
5 5 (6.58%) HTML
5 5 (6.58%) React
5 5 (6.58%) Servlets
5 5 (6.58%) Spring
6 3 (3.95%) LDAP
6 3 (3.95%) SAML
7 2 (2.63%) XML
7 2 (2.63%) XSLT
Miscellaneous
1 22 (28.95%) Enterprise Software
2 13 (17.11%) Clustering
3 7 (9.21%) Self-Motivation
4 5 (6.58%) Data Centre
4 5 (6.58%) Low-Code
5 2 (2.63%) Reference Data
5 2 (2.63%) Replication
6 1 (1.32%) AS400
Operating Systems
1 57 (75.00%) Linux
2 37 (48.68%) Windows
3 26 (34.21%) Unix
4 13 (17.11%) Solaris
5 9 (11.84%) Red Hat Enterprise Linux
6 3 (3.95%) Windows Server
7 1 (1.32%) VMS
Processes & Methodologies
1 35 (46.05%) Problem-Solving
2 23 (30.26%) ERP
3 22 (28.95%) OO
4 14 (18.42%) Continuous Improvement
5 13 (17.11%) Disaster Recovery
5 13 (17.11%) ITIL
6 12 (15.79%) Customer Requirements
7 11 (14.47%) DevOps
8 10 (13.16%) Knowledge Transfer
8 10 (13.16%) Mentoring
8 10 (13.16%) Problem Management
8 10 (13.16%) Root Cause Analysis
9 9 (11.84%) BCP
10 8 (10.53%) Analytics
10 8 (10.53%) Trend Analysis
11 7 (9.21%) Artificial Intelligence
11 7 (9.21%) Infrastructure Engineering
11 7 (9.21%) Robotic Automation
12 6 (7.89%) Capacity Planning
12 6 (7.89%) Storage Management
Programming Languages
1 23 (30.26%) Java
1 23 (30.26%) SQL
2 22 (28.95%) C
2 22 (28.95%) C#
2 22 (28.95%) C++
2 22 (28.95%) VB
3 10 (13.16%) Python
4 5 (6.58%) JavaScript
4 5 (6.58%) PL/SQL
4 5 (6.58%) Shell Script
4 5 (6.58%) TypeScript
5 3 (3.95%) Bash
Qualifications
1 13 (17.11%) ITIL Certification
2 12 (15.79%) SC Cleared
2 12 (15.79%) Security Cleared
3 5 (6.58%) Oracle Certification
4 4 (5.26%) OCP
5 3 (3.95%) Degree
5 3 (3.95%) DV Cleared
6 1 (1.32%) IBM Certification
6 1 (1.32%) LPIC
6 1 (1.32%) MCP
6 1 (1.32%) MCSE
6 1 (1.32%) Microsoft Certification
Quality Assurance & Compliance
1 24 (31.58%) SLA
2 5 (6.58%) ISO/IEC 27001
2 5 (6.58%) QA
System Software
1 19 (25.00%) VMware Infrastructure
2 15 (19.74%) Active Directory
3 10 (13.16%) Virtual Machines
4 7 (9.21%) Firmware
5 4 (5.26%) LXC
5 4 (5.26%) Squid
6 1 (1.32%) Oracle RAC
Systems Management
1 12 (15.79%) Backup Exec
1 12 (15.79%) NetBackup
2 9 (11.84%) Ansible
3 4 (5.26%) Opsview
3 4 (5.26%) Oracle RMAN
3 4 (5.26%) Prometheus
4 3 (3.95%) Oracle Statspack
4 3 (3.95%) Single Sign-On
5 1 (1.32%) Nessus
Vendors
1 63 (82.89%) Oracle
2 24 (31.58%) VMware
3 23 (30.26%) IBM
4 19 (25.00%) Microsoft
5 15 (19.74%) Red Hat
6 12 (15.79%) Hitachi
6 12 (15.79%) NetApp
6 12 (15.79%) Snow
6 12 (15.79%) Veritas
7 5 (6.58%) Temenos
8 4 (5.26%) Infoblox
8 4 (5.26%) SAP
8 4 (5.26%) Splunk
9 3 (3.95%) New Relic
9 3 (3.95%) NGA Human Resources
9 3 (3.95%) Northgate
9 3 (3.95%) SolarWinds
10 2 (2.63%) HP
10 2 (2.63%) Sun
10 2 (2.63%) Symantec