Enterprise Resource Planning (ERP)
UK

The following table provides summary statistics for permanent job vacancies with a requirement for ERP skills. Included is a benchmarking guide to the salaries offered in vacancies that have cited ERP over the 6 months to 29 November 2023 with a comparison to the same period in the previous 2 years.

6 months to
29 Nov 2023
Same period 2022 Same period 2021
Rank 114 155 150
Rank change year-on-year +41 -5 +1
Permanent jobs citing ERP 1,579 3,017 3,420
As % of all permanent jobs advertised in the UK 2.92% 2.40% 2.65%
As % of the Processes & Methodologies category 3.10% 2.51% 2.78%
Number of salaries quoted 1,228 1,874 2,653
10th Percentile £32,500 £34,000 £32,500
25th Percentile £43,750 £43,000 £41,250
Median annual salary (50th Percentile) £60,000 £60,000 £55,000
Median % change year-on-year - +9.09% +4.76%
75th Percentile £75,000 £75,000 £68,750
90th Percentile £95,000 £90,000 £86,250
UK excluding London median annual salary £55,000 £52,500 £50,000
% change year-on-year +4.76% +5.00% +4.17%

All Process and Methodology Skills
UK

ERP is in the Processes and Methodologies category. The following table is for comparison with the above and provides summary statistics for all permanent job vacancies with a requirement for process or methodology skills.

Permanent vacancies with a requirement for process or methodology skills 50,908 120,439 123,182
As % of all permanent jobs advertised in the UK 94.09% 95.71% 95.44%
Number of salaries quoted 36,868 73,620 81,568
10th Percentile £32,500 £34,459 £32,500
25th Percentile £43,750 £45,000 £42,500
Median annual salary (50th Percentile) £60,000 £60,000 £59,045
Median % change year-on-year - +1.62% +7.35%
75th Percentile £80,000 £81,250 £77,500
90th Percentile £98,825 £100,000 £95,000
UK excluding London median annual salary £52,500 £53,000 £50,000
% change year-on-year -0.94% +6.00% +3.63%

ERP
Job Vacancy Trend

Job postings citing ERP as a proportion of all IT jobs advertised.
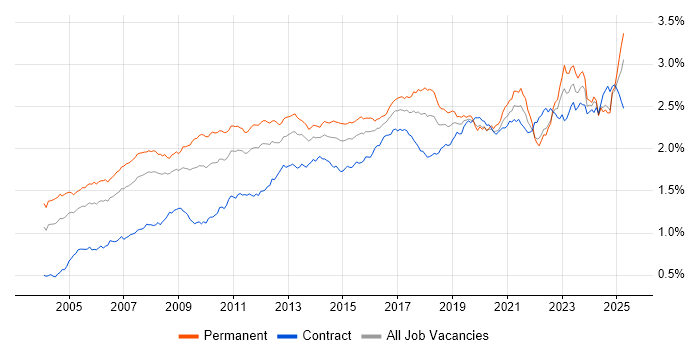
Job vacancy trend for ERP in the UK

ERP
Salary Trend

3-month moving average salary quoted in jobs citing ERP.

Salary trend for ERP in the UK

ERP
Salary Histogram

Salary distribution for jobs citing ERP over the 6 months to 29 November 2023.

Salary histogram for ERP in the UK

ERP
Top 17 Job Locations

The table below looks at the demand and provides a guide to the median salaries quoted in IT jobs citing ERP within the UK over the 6 months to 29 November 2023. The 'Rank Change' column provides an indication of the change in demand within each location based on the same 6 month period last year.

Location Rank Change
on Same Period
Last Year
Matching
Permanent
IT Job Ads
Median Salary
Past 6 Months
Median Salary
% Change
on Same Period
Last Year
Live
Jobs
England +63 1,436 £60,000 - 930
UK excluding London +26 1,066 £55,000 +4.76% 696
Work from Home +38 555 £60,000 - 411
London +94 398 £72,500 +3.57% 266
South East +99 322 £55,000 -4.35% 180
North of England +33 314 £55,000 +6.33% 179
Midlands +58 196 £52,500 -1.41% 156
Yorkshire +30 154 £52,500 +10.53% 62
North West +31 145 £55,000 +4.76% 106
West Midlands +94 137 £50,000 -9.09% 99
South West -38 83 £59,000 +22.92% 66
Scotland +11 75 £52,500 -12.50% 43
East Midlands -11 57 £52,500 +5.00% 56
East of England +1 52 £60,000 +14.29% 83
Wales -32 21 £52,750 +31.88% 6
North East +19 15 £60,000 +17.96% 20
Northern Ireland -15 5 £60,000 +60.00% 4

ERP
Co-occurring Skills and Capabilities by Category

The follow tables expand on the table above by listing co-occurrences grouped by category. The same employment type, locality and period is covered with up to 20 co-occurrences shown in each of the following categories:

Application Platforms
1 44 (2.79%) SharePoint
2 40 (2.53%) Confluence
3 29 (1.84%) CMS
4 19 (1.20%) MS Exchange
5 14 (0.89%) IIS
6 10 (0.63%) WebSphere
7 9 (0.57%) Apache
8 6 (0.38%) WordPress
9 5 (0.32%) Kentico
10 4 (0.25%) Oracle Self-Service HR
10 4 (0.25%) Oracle Workflow
11 3 (0.19%) Adobe Experience Manager
11 3 (0.19%) Apache Spark
11 3 (0.19%) EPiServer
11 3 (0.19%) Headless CMS
11 3 (0.19%) NetWeaver
11 3 (0.19%) Sitecore CMS
11 3 (0.19%) Umbraco
12 1 (0.063%) Drupal
12 1 (0.063%) Exchange Server 2000
Applications
1 56 (3.55%) Microsoft Excel
2 47 (2.98%) Microsoft Office
3 26 (1.65%) Microsoft PowerPoint
4 23 (1.46%) Microsoft Project
5 17 (1.08%) MS Visio
6 12 (0.76%) AutoCAD
7 9 (0.57%) SOLIDWORKS
8 8 (0.51%) PTC Creo
9 4 (0.25%) Oracle Smart View
9 4 (0.25%) Spreadsheet
10 2 (0.13%) Chatbot
11 1 (0.063%) Trello
Business Applications
1 114 (7.22%) SAP ERP
2 88 (5.57%) Oracle ERP
3 79 (5.00%) SAP S/4HANA
4 49 (3.10%) Dynamics CRM
4 49 (3.10%) NetSuite
5 40 (2.53%) Unit4 Business World
6 33 (2.09%) Dynamics NAV
7 23 (1.46%) Dynamics AX
8 20 (1.27%) SAP CO
8 20 (1.27%) SAP FI
8 20 (1.27%) SAP FI/CO
9 18 (1.14%) Oracle Applications
10 16 (1.01%) Oracle EBS
11 15 (0.95%) Oracle Payables
12 13 (0.82%) Dynamics GP
13 12 (0.76%) Oracle Financials
13 12 (0.76%) Oracle General Ledger
14 11 (0.70%) Oracle Receivables
14 11 (0.70%) SAP Business One
15 10 (0.63%) Oracle Procure-to-Pay
Cloud Services
1 225 (14.25%) Azure
2 153 (9.69%) Power Platform
3 116 (7.35%) Dynamics 365
4 104 (6.59%) Microsoft 365
5 90 (5.70%) AWS
6 66 (4.18%) SaaS
7 52 (3.29%) Azure DevOps
8 39 (2.47%) FinancialForce
9 36 (2.28%) GCP
10 28 (1.77%) PaaS
11 26 (1.65%) Entra ID
11 26 (1.65%) IaaS
12 23 (1.46%) SuccessFactors
12 23 (1.46%) WhatsApp
13 22 (1.39%) PowerApps
14 19 (1.20%) Power Automate
15 14 (0.89%) Boomi
16 13 (0.82%) SAP Commerce Cloud
17 11 (0.70%) Azure Data Factory
17 11 (0.70%) Snowflake
Communications & Networking
1 55 (3.48%) DNS
2 53 (3.36%) DHCP
3 47 (2.98%) LAN
4 43 (2.72%) VPN
5 41 (2.60%) WAN
6 36 (2.28%) Wireless
7 33 (2.09%) Firewall
8 29 (1.84%) Internet
9 27 (1.71%) SAN
10 25 (1.58%) Structured Cabling
11 15 (0.95%) HTTP
12 7 (0.44%) FTP
12 7 (0.44%) Intranet
13 6 (0.38%) Network Security
13 6 (0.38%) TCP/IP
13 6 (0.38%) VoIP
14 5 (0.32%) Broadband
14 5 (0.32%) VLAN
14 5 (0.32%) Wi-Fi
15 4 (0.25%) Intrusion Detection
Database & Business Intelligence
1 123 (7.79%) Power BI
2 113 (7.16%) SQL Server
3 82 (5.19%) Oracle Reports
4 76 (4.81%) Data Warehouse
5 37 (2.34%) SQL Server Reporting Services
6 34 (2.15%) Amazon RDS
7 30 (1.90%) SQL Server Integration Services
8 25 (1.58%) Oracle Database
9 24 (1.52%) Relational Database
10 21 (1.33%) Data Lake
11 20 (1.27%) SAP HANA
12 19 (1.20%) Crystal Reports
13 16 (1.01%) BusinessObjects
13 16 (1.01%) Oracle BI Publisher
13 16 (1.01%) Redis
13 16 (1.01%) SAP BW
14 14 (0.89%) Data Mining
14 14 (0.89%) Tableau
15 13 (0.82%) MySQL
15 13 (0.82%) RDBMS
Development Applications
1 61 (3.86%) JIRA
2 22 (1.39%) Git
3 18 (1.14%) Jenkins
4 10 (0.63%) Bitbucket
4 10 (0.63%) Visual Studio
5 9 (0.57%) Chocolatey
6 8 (0.51%) ScriptRunner
6 8 (0.51%) Team Foundation Server
7 4 (0.25%) SQL Server Management Studio (SSMS)
8 3 (0.19%) GitLab
9 2 (0.13%) Cypress.io
9 2 (0.13%) LSMW
9 2 (0.13%) NUnit
9 2 (0.13%) Oracle Forms
9 2 (0.13%) Postman
9 2 (0.13%) Selenium
10 1 (0.063%) Atlassian Bamboo
10 1 (0.063%) Grunt
10 1 (0.063%) PHPUnit
10 1 (0.063%) SoapUI
General
1 574 (36.35%) Finance
2 437 (27.68%) Social Skills
3 282 (17.86%) Manufacturing
4 219 (13.87%) Analytical Skills
5 164 (10.39%) Retail
6 90 (5.70%) Public Sector
7 65 (4.12%) Back Office
8 60 (3.80%) Marketing
9 59 (3.74%) Legal
10 57 (3.61%) Inclusion and Diversity
11 49 (3.10%) Law
12 40 (2.53%) Telecoms
13 37 (2.34%) Automotive
14 35 (2.22%) Presentation Skills
15 30 (1.90%) Aviation
16 29 (1.84%) Aerospace
17 27 (1.71%) Influencing Skills
18 23 (1.46%) Banking
19 14 (0.89%) Organisational Skills
20 13 (0.82%) Pharmaceutical
Job Titles
1 306 (19.38%) Analyst
2 284 (17.99%) Senior
3 218 (13.81%) Project Manager
4 171 (10.83%) Senior Manager
5 137 (8.68%) Consultant
6 132 (8.36%) Architect
7 118 (7.47%) Developer
8 114 (7.22%) Senior Project Manager
9 106 (6.71%) Lead
10 87 (5.51%) Support Analyst
11 80 (5.07%) Solutions Architect
12 79 (5.00%) Business Analyst
13 78 (4.94%) IT Manager
14 62 (3.93%) Business Manager
15 60 (3.80%) Systems Analyst
16 58 (3.67%) ERP Analyst
17 54 (3.42%) Applications Support
18 45 (2.85%) Development Manager
19 42 (2.66%) Enterprise Architecture Manager
19 42 (2.66%) Strategy Manager
Libraries, Frameworks & Software Standards
1 74 (4.69%) Oracle Fusion
2 71 (4.50%) .NET
3 57 (3.61%) XML
4 50 (3.17%) REST
5 43 (2.72%) EDI
6 38 (2.41%) HTML
7 33 (2.09%) SOAP
8 30 (1.90%) JSON
9 29 (1.84%) CSS
10 24 (1.52%) React
11 23 (1.46%) ASP.NET
12 18 (1.14%) .NET Framework
13 17 (1.08%) AngularJS
14 16 (1.01%) Node.js
15 14 (0.89%) .NET Core
16 13 (0.82%) Middleware
17 11 (0.70%) RESTful
18 10 (0.63%) Web Services
19 9 (0.57%) Memcached
19 9 (0.57%) Ruby on Rails
Miscellaneous
1 168 (10.64%) Management Information System
2 116 (7.35%) Virtual Team
3 83 (5.26%) Enterprise Software
4 67 (4.24%) Product Ownership
5 55 (3.48%) Self-Motivation
6 42 (2.66%) Data Structures
7 32 (2.03%) Low-Code
8 23 (1.46%) Onboarding
9 17 (1.08%) Driving Licence
9 17 (1.08%) Public Cloud
10 15 (0.95%) FMCG
11 14 (0.89%) Social Media
12 13 (0.82%) Legacy Systems
13 12 (0.76%) IoT
13 12 (0.76%) Operational Technology
14 10 (0.63%) Cloud Native
14 10 (0.63%) EPoS
15 9 (0.57%) Analytical Mindset
15 9 (0.57%) Data Centre
15 9 (0.57%) Greenfield Project
Operating Systems
1 106 (6.71%) Windows
2 65 (4.12%) Windows Server
3 41 (2.60%) Linux
4 16 (1.01%) Windows Server 2012
5 13 (0.82%) Mac OS
5 13 (0.82%) Windows 10
6 12 (0.76%) Unix
7 6 (0.38%) Android
8 4 (0.25%) Windows Server 2016
8 4 (0.25%) Windows Server 2019
9 3 (0.19%) VMS
10 2 (0.13%) Mac OS X
10 2 (0.13%) Windows 8
10 2 (0.13%) Windows XP
11 1 (0.063%) Apple iOS
11 1 (0.063%) Red Hat Enterprise Linux
11 1 (0.063%) Solaris
11 1 (0.063%) Windows Server 2008
Processes & Methodologies
1 330 (20.90%) Project Management
2 274 (17.35%) Migration
3 254 (16.09%) CRM
4 253 (16.02%) Problem-Solving
5 244 (15.45%) Agile
6 210 (13.30%) Project Delivery
7 202 (12.79%) ITIL
8 201 (12.73%) Roadmaps
9 199 (12.60%) Business Intelligence
10 176 (11.15%) Computer Science
11 175 (11.08%) PRINCE2
12 174 (11.02%) Scrum
13 163 (10.32%) SDLC
14 143 (9.06%) Analytics
15 137 (8.68%) DevOps
16 112 (7.09%) Stakeholder Management
17 111 (7.03%) Business Analysis
18 109 (6.90%) Requirements Gathering
19 105 (6.65%) E-Commerce
20 102 (6.46%) Customer Service
Programming Languages
1 269 (17.04%) SQL
2 88 (5.57%) C#
3 64 (4.05%) JavaScript
4 63 (3.99%) PowerShell
5 38 (2.41%) Java
6 37 (2.34%) Python
7 20 (1.27%) ABAP
8 18 (1.14%) PL/SQL
9 17 (1.08%) PHP
10 16 (1.01%) T-SQL
11 15 (0.95%) Bash
11 15 (0.95%) C
12 10 (0.63%) Ruby
13 8 (0.51%) MATLAB
13 8 (0.51%) X++
14 7 (0.44%) TypeScript
15 6 (0.38%) C++
15 6 (0.38%) Data Analysis Expressions
15 6 (0.38%) Kusto Query Language
16 5 (0.32%) VB
Qualifications
1 360 (22.80%) Degree
2 162 (10.26%) Computer Science Degree
3 86 (5.45%) Security Cleared
4 38 (2.41%) SC Cleared
5 26 (1.65%) Microsoft Certification
6 22 (1.39%) HNC
7 20 (1.27%) ITIL Certification
8 19 (1.20%) BPSS Clearance
9 17 (1.08%) Master's Degree
10 16 (1.01%) MCSA
11 15 (0.95%) MCSE
12 14 (0.89%) DV Cleared
13 13 (0.82%) PMP
14 12 (0.76%) Azure Certification
15 10 (0.63%) PRINCE2 Certification
16 9 (0.57%) ACCA
16 9 (0.57%) CompTIA Security+
17 8 (0.51%) A+ Certification
17 8 (0.51%) CISA
18 7 (0.44%) AWS Certification
Quality Assurance & Compliance
1 59 (3.74%) GDPR
2 53 (3.36%) QA
3 47 (2.98%) Sarbanes-Oxley
4 38 (2.41%) PMO
5 32 (2.03%) NIST
6 31 (1.96%) Data Quality
7 17 (1.08%) ISO/IEC 27001
8 16 (1.01%) SLA
9 9 (0.57%) Accessibility
10 7 (0.44%) COBIT
10 7 (0.44%) GAAP
10 7 (0.44%) IFRS
10 7 (0.44%) ITGC
10 7 (0.44%) PCI DSS
11 6 (0.38%) Cyber Essentials
11 6 (0.38%) ISO 9000
12 5 (0.32%) GRC
13 2 (0.13%) GMP
13 2 (0.13%) ISO 9001
13 2 (0.13%) ISO/IEC 27002 (supersedes ISO/IEC 17799)
System Software
1 98 (6.21%) Active Directory
2 45 (2.85%) VMware Infrastructure
3 10 (0.63%) Hyper-V
4 7 (0.44%) Docker
5 2 (0.13%) Virtual Machines
5 2 (0.13%) vSphere
6 1 (0.063%) Oracle RAC
6 1 (0.063%) Virtual Desktop
Systems Management
1 21 (1.33%) Kubernetes
1 21 (1.33%) Microsoft Intune
2 20 (1.27%) Terraform
3 11 (0.70%) SCCM
4 10 (0.63%) Ansible
5 9 (0.57%) Active Directory Federation Services
5 9 (0.57%) SCOM
6 5 (0.32%) Autotask
7 3 (0.19%) WebSphere Cast Iron
8 2 (0.13%) Failover Clustering
8 2 (0.13%) Microsoft Clustering
8 2 (0.13%) MIIS
8 2 (0.13%) WSUS
9 1 (0.063%) Cisco CUCM
9 1 (0.063%) Data Guard
9 1 (0.063%) Oracle Enterprise Manager
9 1 (0.063%) Oracle RMAN
9 1 (0.063%) Oracle Statspack
9 1 (0.063%) Single Sign-On
9 1 (0.063%) Systems Management Server (SMS)
Vendors
1 351 (22.23%) Microsoft
2 337 (21.34%) SAP
3 304 (19.25%) Oracle
4 192 (12.16%) Salesforce
5 108 (6.84%) NEC
6 75 (4.75%) Sage
7 54 (3.42%) VMware
8 43 (2.72%) Cisco
9 40 (2.53%) Atlassian
10 34 (2.15%) Pardot
11 31 (1.96%) HubSpot
12 30 (1.90%) Veeam
13 26 (1.65%) HP
14 25 (1.58%) Mitel
14 25 (1.58%) Nimble Storage
14 25 (1.58%) Zerto
15 21 (1.33%) IFS
15 21 (1.33%) JD Edwards
16 20 (1.27%) IBM
17 19 (1.20%) Google