Unix
UK

The table below provides summary statistics for permanent job vacancies requiring Unix skills. It includes a benchmarking guide to the annual salaries offered in vacancies that cited Unix over the 6 months leading up to 8 December 2024, comparing them to the same period in the previous two years.

6 months to
8 Dec 2024
Same period 2023 Same period 2022
Rank 270 189 186
Rank change year-on-year -81 -3 +15
Permanent jobs citing Unix 735 990 2,578
As % of all permanent jobs advertised in the UK 1.06% 1.87% 2.10%
As % of the Operating Systems category 8.19% 10.84% 12.67%
Number of salaries quoted 268 591 1,353
10th Percentile £41,250 £42,874 £37,500
25th Percentile £50,000 £50,000 £46,250
Median annual salary (50th Percentile) £60,000 £65,000 £65,000
Median % change year-on-year -7.69% - +5.69%
75th Percentile £80,000 £84,056 £85,000
90th Percentile £93,778 £97,290 £105,000
UK excluding London median annual salary £57,500 £60,000 £50,000
% change year-on-year -4.17% +20.00% -4.76%

All Operating Systems
UK

Unix falls under the Operating Systems category. For comparison with the information above, the following table provides summary statistics for all permanent job vacancies requiring operating system skills.

Permanent vacancies with a requirement for operating system skills 8,972 9,131 20,345
As % of all permanent jobs advertised in the UK 12.94% 17.23% 16.56%
Number of salaries quoted 5,177 7,096 13,692
10th Percentile £28,500 £27,500 £27,500
25th Percentile £36,250 £34,839 £36,250
Median annual salary (50th Percentile) £50,000 £50,000 £52,500
Median % change year-on-year - -4.76% +5.00%
75th Percentile £71,991 £68,750 £72,500
90th Percentile £87,500 £87,500 £92,500
UK excluding London median annual salary £47,500 £45,000 £45,000
% change year-on-year +5.56% - -

Unix
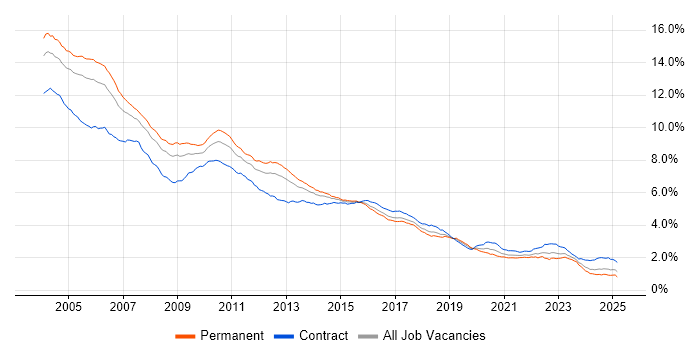
Job Vacancy Trend

Job postings citing Unix as a proportion of all IT jobs advertised.

Job vacancy trend for Unix in the UK

Unix
Salary Trend

3-month moving average salary quoted in jobs citing Unix.

Salary trend for Unix in the UK

Unix
Salary Histogram

Salary distribution for jobs citing Unix over the 6 months to 8 December 2024.

Salary histogram for Unix in the UK

Unix
Top 17 Job Locations

The table below looks at the demand and provides a guide to the median salaries quoted in IT jobs citing Unix within the UK over the 6 months to 8 December 2024. The 'Rank Change' column provides an indication of the change in demand within each location based on the same 6 month period last year.

Location Rank Change
on Same Period
Last Year
Matching
Permanent
IT Job Ads
Median Salary
Past 6 Months
Median Salary
% Change
on Same Period
Last Year
Live
Jobs
England -74 626 £60,000 -7.69% 156
UK excluding London -98 471 £57,500 -4.17% 75
Work from Home -110 262 £69,308 +6.63% 280
London -44 227 £69,308 -12.97% 101
North of England -42 141 £50,000 -29.15% 22
North West -29 96 £50,000 -23.08% 13
Midlands -39 80 £55,000 - 6
South East -87 72 £55,000 +6.28% 7
West Midlands -19 63 £52,500 -4.55% 5
Scotland -40 63 £69,308 -7.59% 11
East of England -13 53 £57,500 +39.39% 12
South West -64 43 £75,996 +27.60% 5
Yorkshire -22 34 £60,000 -20.71% 8
East Midlands -43 17 £55,000 +2.33% 1
Northern Ireland +13 11 £90,000 +38.46% 9
North East -27 11 £50,000 -23.08% 1
Wales -37 8 £48,302 -31.56% 5

Unix
Co-occurring Skills and Capabilities by Category

The follow tables expand on the table above by listing co-occurrences grouped by category. The same employment type, locality and period is covered with up to 20 co-occurrences shown in each of the following categories:

Application Platforms
1 29 (3.95%) Microsoft Exchange
2 28 (3.81%) Confluence
3 15 (2.04%) Apache
4 14 (1.90%) Oracle Collaboration Suite
5 10 (1.36%) Apache Airflow
6 8 (1.09%) Apache Spark
6 8 (1.09%) Tomcat
7 5 (0.68%) NetWeaver
7 5 (0.68%) SharePoint
8 3 (0.41%) nginx
8 3 (0.41%) WebLogic
8 3 (0.41%) WildFly
9 2 (0.27%) OpenStack
9 2 (0.27%) Oracle Application Server
9 2 (0.27%) Oracle SOA Suite
10 1 (0.14%) Mule
Applications
1 16 (2.18%) Microsoft Office
2 9 (1.22%) Microsoft Excel
3 5 (0.68%) Microsoft Project
3 5 (0.68%) MS Visio
4 2 (0.27%) Adobe Creative Suite
4 2 (0.27%) InDesign
4 2 (0.27%) Photoshop
5 1 (0.14%) EngageOne
Business Applications
1 171 (23.27%) NEC Housing
2 16 (2.18%) Unit4 Business World
3 9 (1.22%) Fidessa
4 5 (0.68%) Oracle Subledger Accounting
5 3 (0.41%) FLEXCUBE
6 2 (0.27%) Oracle BPM
6 2 (0.27%) Oracle EBS
6 2 (0.27%) SAP Oil and Gas
7 1 (0.14%) ION Anvil
7 1 (0.14%) ION MarketView
7 1 (0.14%) SAP IBP
7 1 (0.14%) SAP S/4HANA
7 1 (0.14%) TIBCO iProcess
Cloud Services
1 138 (18.78%) Azure
2 104 (14.15%) AWS
3 63 (8.57%) GCP
4 46 (6.26%) Cloud Computing
5 28 (3.81%) PaaS
6 27 (3.67%) Microsoft 365
7 25 (3.40%) GitHub
8 24 (3.27%) AWS CloudFormation
9 22 (2.99%) Azure DevOps
10 20 (2.72%) Amazon ECR
10 20 (2.72%) Amazon ECS
10 20 (2.72%) Amazon ElastiCache
10 20 (2.72%) Amazon OpenSearch
10 20 (2.72%) AWS CodeBuild
10 20 (2.72%) dbt
10 20 (2.72%) Pulumi
11 16 (2.18%) Power Platform
12 14 (1.90%) Amazon S3
12 14 (1.90%) SaaS
13 13 (1.77%) Azure Machine Learning
Communications & Networking
1 56 (7.62%) Firewall
2 55 (7.48%) TCP/IP
3 50 (6.80%) DNS
4 33 (4.49%) Broadband
5 31 (4.22%) DHCP
6 28 (3.81%) Internet
7 21 (2.86%) HTTP
8 18 (2.45%) WAN
9 16 (2.18%) SSL
10 15 (2.04%) SAN
11 14 (1.90%) 3GPP
12 13 (1.77%) LAN
12 13 (1.77%) SD-WAN
13 12 (1.63%) 5G
14 11 (1.50%) SMTP
15 10 (1.36%) VPN
16 9 (1.22%) FIX Connectivity
16 9 (1.22%) IPv4
17 8 (1.09%) Network Security
17 8 (1.09%) VLAN
Database & Business Intelligence
1 68 (9.25%) SQL Server
2 43 (5.85%) PostgreSQL
3 39 (5.31%) DB2
4 28 (3.81%) MongoDB
5 24 (3.27%) Amazon RDS
5 24 (3.27%) Data Warehouse
6 22 (2.99%) Elasticsearch
7 21 (2.86%) Redis
8 19 (2.59%) Relational Database
9 18 (2.45%) Oracle Database
10 17 (2.31%) NoSQL
11 16 (2.18%) Power BI
12 15 (2.04%) MySQL
13 10 (1.36%) BigQuery
13 10 (1.36%) Data Hub
13 10 (1.36%) Sybase IQ
14 9 (1.22%) Geospatial Data
14 9 (1.22%) SQL Server Integration Services
15 8 (1.09%) Hadoop
15 8 (1.09%) RDBMS
Development Applications
1 66 (8.98%) Git
2 34 (4.63%) JIRA
3 31 (4.22%) Jenkins
4 19 (2.59%) GitLab
5 14 (1.90%) Bitbucket
6 13 (1.77%) Subversion
7 10 (1.36%) LabVIEW
7 10 (1.36%) Maven
8 8 (1.09%) TeamCity
9 7 (0.95%) Oracle Forms
10 5 (0.68%) JMeter
11 4 (0.54%) Gatling
11 4 (0.54%) IBM UrbanCode
11 4 (0.54%) Robot Framework
11 4 (0.54%) Selenium
11 4 (0.54%) Spinnaker
12 2 (0.27%) CircleCI
12 2 (0.27%) Flyway
12 2 (0.27%) SonarQube
12 2 (0.27%) Sonatype Nexus
General
1 299 (40.68%) Finance
2 180 (24.49%) Public Sector
2 180 (24.49%) Social Skills
3 171 (23.27%) Local Government
3 171 (23.27%) Police
3 171 (23.27%) Social Housing
4 91 (12.38%) Banking
5 87 (11.84%) Analytical Skills
6 57 (7.76%) Inclusion and Diversity
7 33 (4.49%) Legal
8 27 (3.67%) Retail
9 23 (3.13%) Law
10 22 (2.99%) Advertising
10 22 (2.99%) Telecoms
11 19 (2.59%) Back Office
11 19 (2.59%) Presentation Skills
12 14 (1.90%) Billing
12 14 (1.90%) Financial Institution
12 14 (1.90%) Front Office
13 13 (1.77%) Electronics
Job Titles
1 187 (25.44%) Consultant
2 171 (23.27%) Implementation Consultant
3 104 (14.15%) Senior
4 89 (12.11%) Analyst
5 64 (8.71%) Software Engineer
6 61 (8.30%) Applications Support
7 50 (6.80%) Developer
8 48 (6.53%) Support Analyst
9 42 (5.71%) Systems Engineer
10 34 (4.63%) Embedded Engineer
11 30 (4.08%) Data Engineer
12 29 (3.95%) Applications Support Analyst
12 29 (3.95%) Linux Engineer
12 29 (3.95%) Unix Engineer
13 28 (3.81%) Support Engineer
14 26 (3.54%) FPGA Engineer
15 25 (3.40%) Senior Data Engineer
16 23 (3.13%) Lead
17 20 (2.72%) Applications Engineer
17 20 (2.72%) Applications Support Engineer
Libraries, Frameworks & Software Standards
1 31 (4.22%) Django
2 26 (3.54%) OAuth
3 25 (3.40%) FIX Protocol
4 24 (3.27%) HTML
5 21 (2.86%) REST
6 20 (2.72%) OAuth2
6 20 (2.72%) SAML
7 19 (2.59%) .NET
7 19 (2.59%) XML
8 18 (2.45%) CSS
9 17 (2.31%) Spring
10 15 (2.04%) Kafka
11 14 (1.90%) Middleware
11 14 (1.90%) React
12 11 (1.50%) Flask
13 10 (1.36%) Pyramid
13 10 (1.36%) RESTful
14 8 (1.09%) AngularJS
15 7 (0.95%) PyArrow
15 7 (0.95%) Spring Boot
Miscellaneous
1 171 (23.27%) Housing Association
2 37 (5.03%) Algorithms
3 34 (4.63%) FPGA
4 31 (4.22%) Self-Motivation
5 30 (4.08%) Linux Command Line
6 26 (3.54%) ASIC
6 26 (3.54%) Embedded Systems
6 26 (3.54%) Verilog
6 26 (3.54%) VHDL
7 24 (3.27%) Management Information System
8 23 (3.13%) Data Centre
8 23 (3.13%) Onboarding
9 20 (2.72%) Distributed Systems
10 14 (1.90%) Clustering
10 14 (1.90%) Wiki
11 13 (1.77%) Public Cloud
12 11 (1.50%) Cloud Native
12 11 (1.50%) Cyber Threat
12 11 (1.50%) Foreign Exchange (FX)
13 10 (1.36%) Derivative
Operating Systems
1 392 (53.33%) Linux
2 196 (26.67%) Windows
3 73 (9.93%) Windows Server
4 54 (7.35%) Solaris
5 27 (3.67%) Red Hat Enterprise Linux
6 25 (3.40%) AIX
7 21 (2.86%) CentOS
8 14 (1.90%) Ubuntu
8 14 (1.90%) Windows Server 2019
8 14 (1.90%) zOS
9 10 (1.36%) Windows Server 2008
10 8 (1.09%) Mac OS X
10 8 (1.09%) VMS
11 7 (0.95%) Mac OS
11 7 (0.95%) SUSE
12 5 (0.68%) VxWorks
12 5 (0.68%) Windows 10
13 4 (0.54%) Windows Server 2012
14 3 (0.41%) Windows Server 2016
15 2 (0.27%) Oracle Linux
Processes & Methodologies
1 171 (23.27%) Housing Management
2 167 (22.72%) Problem-Solving
3 117 (15.92%) DevOps
4 115 (15.65%) Software Engineering
5 105 (14.29%) Agile
6 99 (13.47%) CI/CD
7 92 (12.52%) Computer Science
8 73 (9.93%) Mentoring
9 59 (8.03%) ITIL
9 59 (8.03%) Open Source
10 51 (6.94%) Continuous Integration
11 50 (6.80%) Roadmaps
12 48 (6.53%) Disaster Recovery
12 48 (6.53%) Prototyping
13 45 (6.12%) Containerisation
13 45 (6.12%) SDLC
14 43 (5.85%) Performance Monitoring
15 41 (5.58%) Service Delivery
16 39 (5.31%) Mathematics
17 36 (4.90%) OO
Programming Languages
1 361 (49.12%) SQL
2 272 (37.01%) Python
3 115 (15.65%) Shell Script
4 100 (13.61%) PowerShell
5 97 (13.20%) Bash
6 89 (12.11%) C
7 88 (11.97%) C++
8 81 (11.02%) Java
9 44 (5.99%) Perl
10 41 (5.58%) JavaScript
11 27 (3.67%) Fortran
12 26 (3.54%) Assembly Language
12 26 (3.54%) SystemVerilog
12 26 (3.54%) Tcl
13 15 (2.04%) Ruby
14 14 (1.90%) PL/SQL
15 10 (1.36%) C#
15 10 (1.36%) MATLAB
16 9 (1.22%) Groovy
17 8 (1.09%) PHP
Qualifications
1 178 (24.22%) Degree
2 174 (23.67%) DBS Check
3 113 (15.37%) Security Cleared
4 64 (8.71%) SC Cleared
5 61 (8.30%) Computer Science Degree
6 46 (6.26%) DV Cleared
7 26 (3.54%) Master's Degree
8 19 (2.59%) PhD
9 17 (2.31%) CISA
10 12 (1.63%) CISSP
11 10 (1.36%) ACCA
11 10 (1.36%) CIPFA
11 10 (1.36%) PMP
11 10 (1.36%) QiCA
12 9 (1.22%) GCIA
12 9 (1.22%) GCIH
12 9 (1.22%) PMI Certification
13 8 (1.09%) BPSS Clearance
13 8 (1.09%) CISM
13 8 (1.09%) GREM
Quality Assurance & Compliance
1 207 (28.16%) Accessibility
2 17 (2.31%) ITGC
2 17 (2.31%) Sarbanes-Oxley
3 13 (1.77%) ISO/IEC 27001
4 12 (1.63%) SLA
5 11 (1.50%) GDPR
5 11 (1.50%) PMO
6 10 (1.36%) Data Quality
7 9 (1.22%) Cyber Essentials
7 9 (1.22%) Cyber Essentials PLUS
7 9 (1.22%) PCI DSS
8 7 (0.95%) QA
9 5 (0.68%) FINRA
10 4 (0.54%) NIST
11 2 (0.27%) ISO 22301
12 1 (0.14%) COBIT
12 1 (0.14%) COSO
System Software
1 51 (6.94%) Docker
2 38 (5.17%) Active Directory
3 29 (3.95%) VMware Infrastructure
4 26 (3.54%) Hyper-V
5 13 (1.77%) vSphere
6 12 (1.63%) Firmware
7 8 (1.09%) Embedded Firmware
8 7 (0.95%) HDFS
8 7 (0.95%) Virtual Machines
9 4 (0.54%) Lustre
9 4 (0.54%) Slurm Workload Manager
9 4 (0.54%) VMware ESXi
10 3 (0.41%) Microsoft Virtual Server
10 3 (0.41%) Postfix
10 3 (0.41%) Virtual Servers
11 2 (0.27%) KVM
11 2 (0.27%) NFS
11 2 (0.27%) Sendmail
12 1 (0.14%) Kamailio
12 1 (0.14%) Varnish
Systems Management
1 56 (7.62%) Kubernetes
2 53 (7.21%) Terraform
3 32 (4.35%) Ansible
4 20 (2.72%) AWS Copilot
5 14 (1.90%) Amdocs OSS
6 7 (0.95%) Grafana
6 7 (0.95%) Progress Chef
7 6 (0.82%) CA Endevor
7 6 (0.82%) NetBackup
8 5 (0.68%) Data Guard
8 5 (0.68%) Oracle RMAN
8 5 (0.68%) Puppet
8 5 (0.68%) Tivoli Storage Manager
9 4 (0.54%) Failover Clustering
9 4 (0.54%) Istio
9 4 (0.54%) Oracle Enterprise Manager
10 3 (0.41%) Nagios
10 3 (0.41%) Prometheus
10 3 (0.41%) Red Hat Satellite
10 3 (0.41%) SCOM
Vendors
1 171 (23.27%) NEC
2 138 (18.78%) Oracle
3 69 (9.39%) Microsoft
4 58 (7.89%) Red Hat
5 57 (7.76%) VMware
6 37 (5.03%) Google
7 28 (3.81%) SAP
8 26 (3.54%) Xilinx
9 22 (2.99%) IBM
10 20 (2.72%) Veeam
11 17 (2.31%) Sybase
12 16 (2.18%) Sage
13 15 (2.04%) Dell
14 14 (1.90%) Amdocs
14 14 (1.90%) Splunk
15 11 (1.50%) Atlassian
15 11 (1.50%) NetApp
16 9 (1.22%) Bloomberg
16 9 (1.22%) ION Trading
16 9 (1.22%) Murex