ITIL Certification
UK

The following table provides summary statistics for permanent job vacancies with a requirement for ITIL Certification qualifications. Included is a benchmarking guide to the salaries offered over the 6 months to 7 December 2023 with a comparison to the same period in the previous 2 years.

6 months to
7 Dec 2023
Same period 2022 Same period 2021
Rank 417 474 587
Rank change year-on-year +57 +113 -162
Permanent jobs citing ITIL Certification 346 796 578
As % of all permanent jobs advertised in the UK 0.65% 0.65% 0.45%
As % of the Qualifications category 2.00% 2.20% 1.82%
Number of salaries quoted 286 558 489
10th Percentile £31,250 £31,250 £31,000
25th Percentile £40,026 £36,250 £41,250
Median annual salary (50th Percentile) £52,000 £47,500 £50,000
Median % change year-on-year +9.47% -5.00% +11.11%
75th Percentile £70,000 £68,063 £65,000
90th Percentile £77,500 £85,000 £77,500
UK excluding London median annual salary £47,500 £43,750 £47,500
% change year-on-year +8.57% -7.89% +5.56%

All Academic and Professional Certifications
UK

ITIL Certification is in the Academic Qualifications and Professional Certifications category. The following table is for comparison with the above and provides summary statistics for all permanent job vacancies with a requirement for academic qualifications or professional certifications.

Permanent vacancies requiring academic qualifications or professional certifications 17,261 36,220 31,728
As % of all permanent jobs advertised in the UK 32.58% 29.49% 24.76%
Number of salaries quoted 10,821 16,971 17,946
10th Percentile £31,207 £31,250 £31,250
25th Percentile £42,000 £41,250 £41,250
Median annual salary (50th Percentile) £57,500 £57,500 £55,000
Median % change year-on-year - +4.55% -
75th Percentile £75,000 £76,250 £73,000
90th Percentile £92,500 £93,750 £90,000
UK excluding London median annual salary £52,500 £50,000 £50,000
% change year-on-year +5.00% - +2.04%

ITIL Certification
Job Vacancy Trend

Job postings citing ITIL Certification as a proportion of all IT jobs advertised.
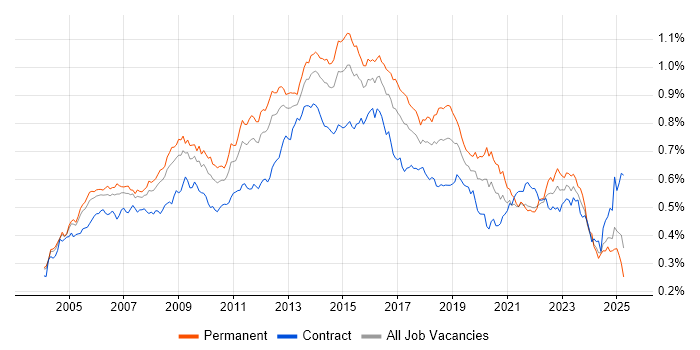
Job vacancy trend for ITIL Certification in the UK

ITIL Certification
Salary Trend

3-month moving average salary quoted in jobs citing ITIL Certification.

Salary trend for ITIL Certification in the UK

ITIL Certification
Salary Histogram

Salary distribution for jobs citing ITIL Certification over the 6 months to 7 December 2023.

Salary histogram for ITIL Certification in the UK

ITIL Certification
Top 17 Job Locations

The table below looks at the demand and provides a guide to the median salaries quoted in IT jobs citing ITIL Certification within the UK over the 6 months to 7 December 2023. The 'Rank Change' column provides an indication of the change in demand within each location based on the same 6 month period last year.

Location Rank Change
on Same Period
Last Year
Matching
Permanent
IT Job Ads
Median Salary
Past 6 Months
Median Salary
% Change
on Same Period
Last Year
Live
Jobs
England +62 321 £51,375 +8.16% 101
UK excluding London +54 206 £47,500 +8.57% 84
Work from Home +110 142 £50,000 +5.26% 59
London +114 125 £65,000 +9.43% 27
North of England +78 66 £47,500 +0.79% 32
Yorkshire +98 43 £47,500 - 6
Midlands +75 42 £47,500 +11.76% 13
West Midlands +85 37 £47,500 +11.76% 12
South East +62 32 £40,000 -3.61% 11
East of England +96 31 £60,000 +37.14% 7
South West +71 21 £29,440 -48.80% 10
North West +58 21 £55,000 +16.71% 24
Scotland +34 8 £60,000 +14.29% 9
Wales +11 6 £43,750 -53.95% 3
East Midlands +39 5 £57,500 +35.29% 1
North East +42 2 £77,500 +203.92% 3
Northern Ireland +34 2 £27,500 -12.70%

ITIL Certification
Co-occurring Skills and Capabilities by Category

The follow tables expand on the table above by listing co-occurrences grouped by category. The same employment type, locality and period is covered with up to 20 co-occurrences shown in each of the following categories:

Application Platforms
1 22 (6.36%) SharePoint
2 14 (4.05%) WebSphere
2 14 (4.05%) WebSphere Application Server
3 12 (3.47%) MS Exchange
4 11 (3.18%) Confluence
5 1 (0.29%) CMS
5 1 (0.29%) Skype for Business
Applications
1 20 (5.78%) Microsoft Office
2 6 (1.73%) Microsoft Excel
3 3 (0.87%) Microsoft PowerPoint
4 1 (0.29%) Acrobat
4 1 (0.29%) AutoCAD
4 1 (0.29%) MS Visio
4 1 (0.29%) Revit
4 1 (0.29%) SketchUp
Business Applications
1 7 (2.02%) SAP Business One
2 3 (0.87%) Dynamics CRM
3 1 (0.29%) Dynamics NAV
3 1 (0.29%) NetSuite
3 1 (0.29%) SAP S/4HANA
Cloud Services
1 99 (28.61%) Microsoft 365
2 67 (19.36%) Azure
3 23 (6.65%) AWS
4 16 (4.62%) Entra ID
5 9 (2.60%) GCP
5 9 (2.60%) SaaS
6 8 (2.31%) Cloud Computing
7 7 (2.02%) Azure DevOps
7 7 (2.02%) Power Platform
8 6 (1.73%) Dynamics 365
9 5 (1.45%) FinancialForce
9 5 (1.45%) PowerApps
10 4 (1.16%) OneDrive
10 4 (1.16%) WhatsApp
11 3 (0.87%) Google Workspace
11 3 (0.87%) Power Automate
12 2 (0.58%) Google Drive
13 1 (0.29%) IaaS
13 1 (0.29%) OpenShift
13 1 (0.29%) SuccessFactors
Communications & Networking
1 34 (9.83%) Firewall
2 28 (8.09%) DNS
2 28 (8.09%) LAN
3 24 (6.94%) WAN
4 20 (5.78%) DHCP
5 14 (4.05%) Network Security
5 14 (4.05%) SAN
5 14 (4.05%) VPN
6 13 (3.76%) VLAN
7 12 (3.47%) Wi-Fi
8 11 (3.18%) WLAN
9 9 (2.60%) Fibre Channel
9 9 (2.60%) iSCSI
9 9 (2.60%) NAS
9 9 (2.60%) TCP/IP
10 8 (2.31%) Internet
11 7 (2.02%) Wireless
12 6 (1.73%) OSPF
13 4 (1.16%) BGP
13 4 (1.16%) MPLS
Database & Business Intelligence
1 26 (7.51%) SQL Server
2 14 (4.05%) BusinessObjects
2 14 (4.05%) BusinessObjects Business Intelligence
3 9 (2.60%) PostgreSQL
4 6 (1.73%) Oracle Reports
5 4 (1.16%) MySQL
5 4 (1.16%) Oracle Database
6 3 (0.87%) MongoDB
6 3 (0.87%) Power BI
7 2 (0.58%) Data Warehouse
8 1 (0.29%) Amazon RDS
8 1 (0.29%) Amazon Redshift
8 1 (0.29%) Crystal Reports
8 1 (0.29%) NoSQL
8 1 (0.29%) SQL Server Integration Services
8 1 (0.29%) SQL Server Reporting Services
8 1 (0.29%) Tableau
Development Applications
1 37 (10.69%) JIRA
2 15 (4.34%) Git
3 14 (4.05%) Oracle APEX
4 8 (2.31%) Bitbucket
4 8 (2.31%) ScriptRunner
4 8 (2.31%) Team Foundation Server
5 4 (1.16%) Postman
5 4 (1.16%) SoapUI
6 2 (0.58%) Cucumber
6 2 (0.58%) Selenium
7 1 (0.29%) Browser DevTools
7 1 (0.29%) Jenkins
General
1 148 (42.77%) Social Skills
2 61 (17.63%) Finance
3 50 (14.45%) Analytical Skills
4 35 (10.12%) Organisational Skills
5 23 (6.65%) Retail
6 21 (6.07%) Inclusion and Diversity
6 21 (6.07%) Law
7 18 (5.20%) Legal
8 15 (4.34%) Public Sector
9 13 (3.76%) Telecoms
10 11 (3.18%) Presentation Skills
11 8 (2.31%) Documentation Skills
11 8 (2.31%) Local Government
12 6 (1.73%) Back Office
13 5 (1.45%) Banking
14 4 (1.16%) Automotive
14 4 (1.16%) Manufacturing
14 4 (1.16%) Marketing
15 3 (0.87%) Advertising
15 3 (0.87%) Games
Job Titles
1 80 (23.12%) Analyst
2 54 (15.61%) IT Manager
3 44 (12.72%) Service Manager
4 33 (9.54%) Lead
5 32 (9.25%) Applications Support
5 32 (9.25%) Infrastructure Engineer
5 32 (9.25%) Support Analyst
6 28 (8.09%) Support Engineer
7 27 (7.80%) Applications Support Analyst
8 23 (6.65%) IT Services Manager
9 22 (6.36%) Senior
10 20 (5.78%) Desktop Support
11 18 (5.20%) ITSM Specialist
12 17 (4.91%) Delivery Manager
12 17 (4.91%) IT Support
13 16 (4.62%) Service Analyst
13 16 (4.62%) Service Delivery Manager
14 15 (4.34%) Deskside Support
14 15 (4.34%) Team Leader
15 14 (4.05%) Deskside Support Engineer
Libraries, Frameworks & Software Standards
1 14 (4.05%) .NET
2 5 (1.45%) Elastic Stack
3 2 (0.58%) Gherkin
4 1 (0.29%) ADO
4 1 (0.29%) AngularJS
4 1 (0.29%) CSS
4 1 (0.29%) EDI
4 1 (0.29%) HTML
4 1 (0.29%) RESTful
4 1 (0.29%) XML
4 1 (0.29%) YAML
Miscellaneous
1 21 (6.07%) Data Centre
2 19 (5.49%) Management Information System
3 16 (4.62%) iPhone
4 15 (4.34%) CMDB
5 14 (4.05%) Self-Motivation
6 11 (3.18%) Driving Licence
7 10 (2.89%) Public Cloud
8 9 (2.60%) Enterprise Software
9 7 (2.02%) Algorithms
9 7 (2.02%) Virtual Team
10 6 (1.73%) Greenfield Project
11 5 (1.45%) Mobile Computing
11 5 (1.45%) Onboarding
12 4 (1.16%) PMI
13 3 (0.87%) Cyberattack
14 2 (0.58%) Analytical Mindset
14 2 (0.58%) EMV
14 2 (0.58%) Legacy Systems
14 2 (0.58%) Video Conferencing
15 1 (0.29%) Team-Oriented Environment
Operating Systems
1 95 (27.46%) Windows
2 32 (9.25%) Windows 10
2 32 (9.25%) Windows Server
3 21 (6.07%) Linux
3 21 (6.07%) Unix
4 17 (4.91%) Android
5 8 (2.31%) Windows Server 2016
6 7 (2.02%) Red Hat Enterprise Linux
7 6 (1.73%) Windows Server 2019
8 5 (1.45%) Debian
9 2 (0.58%) Mac OS
9 2 (0.58%) Windows Server 2012
10 1 (0.29%) Mac OS X
10 1 (0.29%) Ubuntu
10 1 (0.29%) Windows Server 2008
10 1 (0.29%) Windows XP
Processes & Methodologies
1 346 (100.00%) ITIL
2 92 (26.59%) Service Management
3 89 (25.72%) ITSM
4 80 (23.12%) Incident Management
5 75 (21.68%) Problem Management
6 61 (17.63%) Service Delivery
7 59 (17.05%) Mentoring
8 54 (15.61%) Customer Service
9 52 (15.03%) Problem-Solving
10 45 (13.01%) Agile
10 45 (13.01%) Root Cause Analysis
11 43 (12.43%) Infrastructure Engineering
12 38 (10.98%) Change Management
13 30 (8.67%) Project Management
14 29 (8.38%) DevOps
15 27 (7.80%) Change Control
15 27 (7.80%) Project Delivery
16 26 (7.51%) Stakeholder Management
17 25 (7.23%) Continuous Improvement
17 25 (7.23%) Release Management
Programming Languages
1 37 (10.69%) SQL
2 33 (9.54%) PowerShell
3 20 (5.78%) Java
4 18 (5.20%) PL/SQL
5 8 (2.31%) Bash
6 7 (2.02%) C
7 4 (1.16%) Shell Script
8 2 (0.58%) C#
8 2 (0.58%) JavaScript
8 2 (0.58%) Python
9 1 (0.29%) ABAP
9 1 (0.29%) Bicep
9 1 (0.29%) C++
9 1 (0.29%) T-SQL
Qualifications
1 39 (11.27%) Degree
2 28 (8.09%) Security Cleared
3 21 (6.07%) SC Cleared
4 18 (5.20%) Microsoft Certification
5 11 (3.18%) Cisco Certification
5 11 (3.18%) MCSE
6 10 (2.89%) CCNA
7 6 (1.73%) PMI Certification
8 5 (1.45%) ISSAP
9 4 (1.16%) ISTQB
9 4 (1.16%) JNCIA
9 4 (1.16%) Network+ Certification
10 3 (0.87%) CEH
10 3 (0.87%) CISM
10 3 (0.87%) CISSP
10 3 (0.87%) DV Cleared
10 3 (0.87%) Master's Degree
10 3 (0.87%) PRINCE2 Certification
11 2 (0.58%) A+ Certification
11 2 (0.58%) Azure Certification
Quality Assurance & Compliance
1 43 (12.43%) SLA
2 21 (6.07%) QA
3 13 (3.76%) ISO/IEC 27001
4 10 (2.89%) Cyber Essentials
5 5 (1.45%) GDPR
6 4 (1.16%) Data Quality
7 3 (0.87%) NIST
7 3 (0.87%) PMO
7 3 (0.87%) Software Quality Assurance
8 2 (0.58%) Accessibility
8 2 (0.58%) ISO 9001
8 2 (0.58%) PCI DSS
8 2 (0.58%) WCAG
9 1 (0.29%) GRC
9 1 (0.29%) ISO 22301
9 1 (0.29%) ITGC
9 1 (0.29%) P3O
9 1 (0.29%) Sarbanes-Oxley
System Software
1 87 (25.14%) Active Directory
2 10 (2.89%) VMware Infrastructure
3 9 (2.60%) Terminal Server
4 8 (2.31%) Hyper-V
5 5 (1.45%) Virtual Servers
6 4 (1.16%) Oracle RAC
7 3 (0.87%) Virtual Desktop
8 2 (0.58%) Docker
8 2 (0.58%) vSphere
9 1 (0.29%) Virtual Machines
9 1 (0.29%) VMware ESXi
Systems Management
1 26 (7.51%) SCCM
2 18 (5.20%) Microsoft Intune
3 7 (2.02%) Ansible
4 5 (1.45%) Autotask
5 4 (1.16%) Data Guard
5 4 (1.16%) Oracle RMAN
6 2 (0.58%) Active Directory Federation Services
6 2 (0.58%) Kubernetes
6 2 (0.58%) SCOM
6 2 (0.58%) Terraform
7 1 (0.29%) SCSM
7 1 (0.29%) SCVMM
7 1 (0.29%) Single Sign-On
7 1 (0.29%) Tivoli
7 1 (0.29%) WhatsUp Gold
Vendors
1 114 (32.95%) Microsoft
2 72 (20.81%) ServiceNow
3 28 (8.09%) Cisco
4 27 (7.80%) Oracle
5 21 (6.07%) VMware
6 16 (4.62%) Dell
7 12 (3.47%) SAP
8 10 (2.89%) Citrix
9 8 (2.31%) Atlassian
9 8 (2.31%) ConnectWise
9 8 (2.31%) Kaseya
9 8 (2.31%) Palo Alto
9 8 (2.31%) Red Hat
10 6 (1.73%) Salesforce
11 5 (1.45%) Google
12 4 (1.16%) Juniper
12 4 (1.16%) SolarWinds
13 3 (0.87%) Adobe
13 3 (0.87%) Snow
13 3 (0.87%) Veeam