Linux Engineer
UK

The median Linux Engineer salary in the UK is £57,500 per year according to job vacancies posted during the 6 months to 30 November 2023.

The first table below provides salary benchmarking and summary statistics including a comparison to same period in the previous 2 years.

6 months to
30 Nov 2023
Same period 2022 Same period 2021
Rank 481 661 644
Rank change year-on-year +180 -17 -284
Permanent jobs requiring a Linux Engineer 254 477 508
As % of all permanent jobs advertised in the UK 0.47% 0.38% 0.39%
As % of the Job Titles category 0.49% 0.40% 0.41%
Number of salaries quoted 206 380 408
10th Percentile £40,000 £41,250 £37,500
25th Percentile £46,000 £50,000 £44,750
Median annual salary (50th Percentile) £57,500 £60,000 £55,000
Median % change year-on-year -4.17% +9.09% +10.00%
75th Percentile £85,000 £74,063 £75,000
90th Percentile £107,500 £93,750 £85,000
UK excluding London median annual salary £50,000 £55,000 £50,000
% change year-on-year -9.09% +10.00% +11.11%

All Permanent IT Job Vacancies
UK

The following table is for comparison with the above and includes summary statistics for all permanent IT job vacancies. Most job vacancies include a discernible job title that can be normalized. As such, the figures in the second row provide an indication of the number of permanent jobs in our overall sample.

Permanent vacancies in the UK with a recognized job title 51,419 120,484 123,121
% of permanent jobs with a recognized job title 95.48% 95.34% 95.10%
Number of salaries quoted 37,696 75,234 84,392
10th Percentile £31,250 £32,750 £32,000
25th Percentile £42,500 £45,000 £42,500
Median annual salary (50th Percentile) £60,000 £60,000 £57,500
Median % change year-on-year - +4.35% +4.55%
75th Percentile £80,000 £81,250 £77,500
90th Percentile £97,500 £97,750 £95,000
UK excluding London median annual salary £52,500 £52,500 £50,000
% change year-on-year - +5.00% +5.26%

Linux Engineer
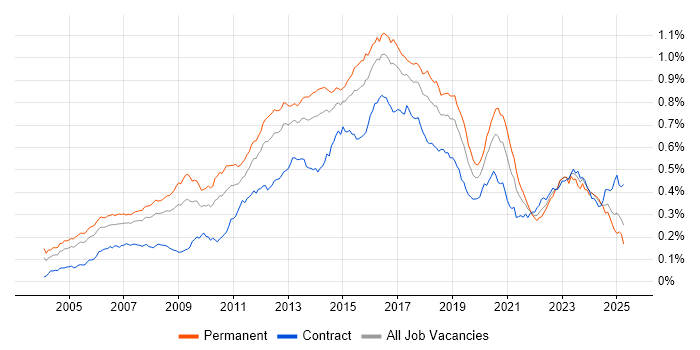
Job Vacancy Trend

Job postings that featured Linux Engineer in the job title as a proportion of all IT jobs advertised.

Job vacancy trend for Linux Engineer in the UK

Linux Engineer
Salary Trend

3-month moving average salary quoted in jobs citing Linux Engineer.

Salary trend for Linux Engineer in the UK

Linux Engineer
Salary Histogram

Salary distribution for jobs citing Linux Engineer over the 6 months to 30 November 2023.

Salary histogram for Linux Engineer in the UK

Linux Engineer
Top 15 Job Locations

The table below looks at the demand and provides a guide to the median salaries quoted in IT jobs citing Linux Engineer within the UK over the 6 months to 30 November 2023. The 'Rank Change' column provides an indication of the change in demand within each location based on the same 6 month period last year.

Location Rank Change
on Same Period
Last Year
Matching
Permanent
IT Job Ads
Median Salary
Past 6 Months
Median Salary
% Change
on Same Period
Last Year
Live
Jobs
England +154 229 £57,500 -8.00% 61
UK excluding London +158 156 £50,000 -9.09% 43
Work from Home +148 130 £65,000 +13.04% 30
London +181 74 £82,500 +13.79% 30
South East +154 59 £48,750 +11.43% 14
South West +78 41 £45,000 -33.33% 13
Midlands +132 27 £57,500 +4.55% 2
North of England +133 20 £57,500 - 3
East of England +68 20 £67,500 +17.39% 6
West Midlands +139 19 £57,500 -10.51% 2
Yorkshire +70 14 £55,000 -33.33% 2
East Midlands +52 8 - -
North West +105 5 £67,500 +17.39% 1
Scotland +52 3 - - 6
North East +43 1 £60,000 +60.00%

Linux Engineer Skill Set
Top 30 Co-occurring Skills and Capabilities

For the 6 months to 30 November 2023, Linux Engineer job roles required the following skills and capabilities in order of popularity. The figures indicate the absolute number co-occurrences and as a proportion of all permanent job ads featuring Linux Engineer in the job title.

1 254 (100.00%) Linux
2 91 (35.83%) Python
3 84 (33.07%) Ansible
4 76 (29.92%) Red Hat
5 75 (29.53%) Red Hat Enterprise Linux
6 70 (27.56%) Bash
7 66 (25.98%) Software Engineering
8 65 (25.59%) Finance
9 60 (23.62%) C++
10 59 (23.23%) DevOps
11 52 (20.47%) AWS
12 50 (19.69%) Problem-Solving
13 47 (18.50%) Unix
14 46 (18.11%) Infrastructure Engineering
15 45 (17.72%) TCP/IP
16 44 (17.32%) Security Cleared
17 42 (16.54%) CI/CD
18 40 (15.75%) Firewall
19 39 (15.35%) Windows
19 39 (15.35%) Azure
19 39 (15.35%) Puppet
20 38 (14.96%) Configuration Management
21 37 (14.57%) Social Skills
22 34 (13.39%) VMware
23 33 (12.99%) Degree
23 33 (12.99%) CentOS
23 33 (12.99%) DNS
24 32 (12.60%) Perl
24 32 (12.60%) Computer Science
25 31 (12.20%) WAN

Linux Engineer Skill Set
Co-occurring Skills and Capabilities by Category

The follow tables expand on the table above by listing co-occurrences grouped by category. The same employment type, locality and period is covered with up to 20 co-occurrences shown in each of the following categories:

Application Platforms
1 18 (7.09%) Confluence
2 10 (3.94%) Apache
3 9 (3.54%) nginx
4 6 (2.36%) OpenStack
5 3 (1.18%) Tomcat
6 2 (0.79%) JBoss
6 2 (0.79%) WebLogic
7 1 (0.39%) ColdFusion
7 1 (0.39%) Drupal
Cloud Services
1 52 (20.47%) AWS
2 39 (15.35%) Azure
3 18 (7.09%) GitHub
4 8 (3.15%) Amazon EC2
5 7 (2.76%) Microsoft 365
6 4 (1.57%) Azure DevOps
6 4 (1.57%) Cloud Computing
6 4 (1.57%) GitHub Actions
6 4 (1.57%) OpenShift
7 3 (1.18%) GCP
7 3 (1.18%) WhatsApp
8 2 (0.79%) Amazon CloudWatch
8 2 (0.79%) Amazon S3
8 2 (0.79%) AWS CloudFormation
8 2 (0.79%) Azure Storage
9 1 (0.39%) Amazon ECR
9 1 (0.39%) Amazon ELB
9 1 (0.39%) AWS OpsWorks
9 1 (0.39%) IBM Cloud
9 1 (0.39%) Serverless
Communications & Networking
1 45 (17.72%) TCP/IP
2 40 (15.75%) Firewall
3 33 (12.99%) DNS
4 31 (12.20%) WAN
5 23 (9.06%) SD-WAN
6 22 (8.66%) 5G
7 21 (8.27%) Internet
8 20 (7.87%) HTTP
9 9 (3.54%) DHCP
9 9 (3.54%) LAN
10 8 (3.15%) SAN
11 7 (2.76%) VPN
12 6 (2.36%) Kerberos
13 5 (1.97%) HTTPS
13 5 (1.97%) Intrusion Detection
14 4 (1.57%) SMTP
15 3 (1.18%) BGP
15 3 (1.18%) IPv6
15 3 (1.18%) NAS
16 2 (0.79%) SSH
Database & Business Intelligence
1 16 (6.30%) MySQL
2 9 (3.54%) PostgreSQL
3 8 (3.15%) Big Data
4 6 (2.36%) Amazon RDS
4 6 (2.36%) SQL Server
5 4 (1.57%) NoSQL
6 2 (0.79%) Elasticsearch
6 2 (0.79%) InfluxDB
6 2 (0.79%) MariaDB
6 2 (0.79%) Relational Database
7 1 (0.39%) MongoDB
7 1 (0.39%) Oracle Database
7 1 (0.39%) Power BI
Development Applications
1 27 (10.63%) Git
2 20 (7.87%) Jenkins
3 17 (6.69%) Artifactory
3 17 (6.69%) GitLab
3 17 (6.69%) Visual Studio
4 15 (5.91%) Atlassian Bamboo
5 12 (4.72%) JIRA
6 11 (4.33%) Liquibase
7 6 (2.36%) Bitbucket
7 6 (2.36%) SonarQube
8 5 (1.97%) Sonatype Nexus
9 4 (1.57%) Subversion
10 2 (0.79%) ClearCase
10 2 (0.79%) ClearQuest
10 2 (0.79%) Redmine
11 1 (0.39%) CMake
11 1 (0.39%) Octopus Deploy
General
1 65 (25.59%) Finance
2 37 (14.57%) Social Skills
3 27 (10.63%) Analytical Skills
4 24 (9.45%) Aerospace
4 24 (9.45%) Retail
5 14 (5.51%) Organisational Skills
6 12 (4.72%) Marketing
7 8 (3.15%) Banking
7 8 (3.15%) Billing
7 8 (3.15%) Financial Institution
7 8 (3.15%) Investment Banking
8 4 (1.57%) Front Office
8 4 (1.57%) Presentation Skills
8 4 (1.57%) Telecoms
9 3 (1.18%) Electronics
9 3 (1.18%) Games
9 3 (1.18%) Law
9 3 (1.18%) Legal
10 2 (0.79%) Advertising
10 2 (0.79%) Public Sector
Libraries, Frameworks & Software Standards
1 28 (11.02%) Yocto
2 16 (6.30%) Kafka
3 10 (3.94%) .NET
3 10 (3.94%) .NET Core
3 10 (3.94%) JSON
4 9 (3.54%) RESTful
5 8 (3.15%) Elastic Stack
6 6 (2.36%) YAML
7 5 (1.97%) XML
8 4 (1.57%) ADO
8 4 (1.57%) LAPP Stack
8 4 (1.57%) RabbitMQ
8 4 (1.57%) REST
8 4 (1.57%) Web Services
9 3 (1.18%) Boost C++ Libraries
9 3 (1.18%) LDAP
10 2 (0.79%) Middleware
10 2 (0.79%) OpenMP
11 1 (0.39%) LAMP
11 1 (0.39%) Qt
Miscellaneous
1 15 (5.91%) Self-Motivation
2 14 (5.51%) Raspberry Pi
3 13 (5.12%) GNSS
3 13 (5.12%) Linux Command Line
4 12 (4.72%) Clustering
4 12 (4.72%) IoT
5 11 (4.33%) Data Centre
5 11 (4.33%) Public Cloud
6 9 (3.54%) Management Information System
7 8 (3.15%) Cyber Defence
8 7 (2.76%) Greenfield Project
9 6 (2.36%) Arduino
10 4 (1.57%) Device Driver
10 4 (1.57%) Embedded Systems
10 4 (1.57%) FPGA
10 4 (1.57%) Onboarding
10 4 (1.57%) Tandem
10 4 (1.57%) Video\Live Streaming
11 3 (1.18%) Cloud Native
12 2 (0.79%) Data Structures
Operating Systems
1 254 (100.00%) Linux
2 75 (29.53%) Red Hat Enterprise Linux
3 47 (18.50%) Unix
4 39 (15.35%) Windows
5 33 (12.99%) CentOS
6 30 (11.81%) Debian
7 21 (8.27%) Ubuntu
8 19 (7.48%) Embedded Linux
9 17 (6.69%) Fedora
10 15 (5.91%) Windows Server
11 14 (5.51%) Solaris
12 12 (4.72%) AIX
13 11 (4.33%) HPUX
14 6 (2.36%) openSUSE
15 4 (1.57%) Windows Server 2016
15 4 (1.57%) Windows Server 2019
16 3 (1.18%) CoreOS
16 3 (1.18%) Windows 10
16 3 (1.18%) Windows Server 2012
17 2 (0.79%) OpenBSD
Processes & Methodologies
1 66 (25.98%) Software Engineering
2 59 (23.23%) DevOps
3 50 (19.69%) Problem-Solving
4 46 (18.11%) Infrastructure Engineering
5 42 (16.54%) CI/CD
6 38 (14.96%) Configuration Management
7 32 (12.60%) Computer Science
8 29 (11.42%) Cybersecurity
9 25 (9.84%) Test Automation
10 24 (9.45%) Containerisation
11 22 (8.66%) Agile
11 22 (8.66%) B2B
11 22 (8.66%) Multithreading
11 22 (8.66%) Test Assurance
12 20 (7.87%) Open Source
13 18 (7.09%) SDLC
13 18 (7.09%) Software Architecture
13 18 (7.09%) Validation
14 15 (5.91%) ITIL
15 14 (5.51%) OOP
Programming Languages
1 91 (35.83%) Python
2 70 (27.56%) Bash
3 60 (23.62%) C++
4 32 (12.60%) Perl
5 29 (11.42%) PowerShell
6 28 (11.02%) C
7 17 (6.69%) Java
8 16 (6.30%) Ruby
9 12 (4.72%) Shell Script
10 11 (4.33%) C#
10 11 (4.33%) SQL
11 10 (3.94%) PHP
12 6 (2.36%) Korn
13 3 (1.18%) Go
13 3 (1.18%) Rust
14 1 (0.39%) Bicep
14 1 (0.39%) Embedded C++
14 1 (0.39%) JavaScript
Qualifications
1 44 (17.32%) Security Cleared
2 33 (12.99%) Degree
3 24 (9.45%) SC Cleared
4 15 (5.91%) Computer Science Degree
5 14 (5.51%) DV Cleared
6 8 (3.15%) RHCE
7 7 (2.76%) ITIL Certification
8 4 (1.57%) AWS Certification
8 4 (1.57%) AWS Certified Solutions Architect
9 3 (1.18%) RHCSA
10 2 (0.79%) GIAC
10 2 (0.79%) Master's Degree
10 2 (0.79%) PhD
11 1 (0.39%) CCNA
11 1 (0.39%) Cisco Certification
11 1 (0.39%) LPIC
11 1 (0.39%) RHCT
Quality Assurance & Compliance
1 18 (7.09%) PMO
2 11 (4.33%) QA
3 5 (1.97%) AUTOSAR
4 1 (0.39%) DO-178B
4 1 (0.39%) MISRA
System Software
1 31 (12.20%) Docker
2 21 (8.27%) VMware Infrastructure
3 17 (6.69%) Active Directory
4 9 (3.54%) Slurm Workload Manager
5 6 (2.36%) KVM
5 6 (2.36%) Samba
6 4 (1.57%) Hyper-V
7 3 (1.18%) NFS
8 2 (0.79%) Firmware
8 2 (0.79%) GPFS
8 2 (0.79%) Postfix
8 2 (0.79%) vSphere
9 1 (0.39%) Ceph
9 1 (0.39%) Embedded Firmware
9 1 (0.39%) iptables
9 1 (0.39%) Lustre
9 1 (0.39%) QEMU
9 1 (0.39%) Shibboleth
9 1 (0.39%) Virtual Machines
9 1 (0.39%) VMware ESXi
Systems Management
1 84 (33.07%) Ansible
2 39 (15.35%) Puppet
3 26 (10.24%) Terraform
4 24 (9.45%) Kubernetes
5 19 (7.48%) Red Hat Satellite
6 12 (4.72%) Progress Chef
7 10 (3.94%) Tivoli
7 10 (3.94%) Tivoli Storage Manager
8 7 (2.76%) Grafana
8 7 (2.76%) Red Hat Spacewalk
9 6 (2.36%) Nagios
10 4 (1.57%) NetBackup
11 3 (1.18%) Prometheus
11 3 (1.18%) Rancher
11 3 (1.18%) Rsyslog
11 3 (1.18%) Salt
11 3 (1.18%) yum
12 2 (0.79%) ITRS Geneos
12 2 (0.79%) SCCM
12 2 (0.79%) SCOM
Vendors
1 76 (29.92%) Red Hat
2 34 (13.39%) VMware
3 26 (10.24%) Microsoft
4 18 (7.09%) TOWER Software
5 12 (4.72%) CyberArk
5 12 (4.72%) Splunk
5 12 (4.72%) Veritas
6 7 (2.76%) Atlassian
6 7 (2.76%) Juniper
7 6 (2.36%) Cisco
7 6 (2.36%) IBM
7 6 (2.36%) Oracle
7 6 (2.36%) Sun
8 5 (1.97%) Google
9 4 (1.57%) Intel
9 4 (1.57%) NetApp
9 4 (1.57%) Rackspace
10 3 (1.18%) Fortinet
10 3 (1.18%) ServiceNow
10 3 (1.18%) Veeam