Customer Relationship Management (CRM)
UK

The following table provides summary statistics for permanent job vacancies with a requirement for CRM skills. Included is a benchmarking guide to the salaries offered in vacancies that have cited CRM over the 6 months to 29 November 2023 with a comparison to the same period in the previous 2 years.

6 months to
29 Nov 2023
Same period 2022 Same period 2021
Rank 88 112 129
Rank change year-on-year +24 +17 -13
Permanent jobs citing CRM 1,835 3,884 3,770
As % of all permanent jobs advertised in the UK 3.39% 3.09% 2.92%
As % of the Processes & Methodologies category 3.60% 3.22% 3.06%
Number of salaries quoted 1,274 2,543 2,645
10th Percentile £31,250 £32,500 £31,250
25th Percentile £42,448 £42,500 £40,000
Median annual salary (50th Percentile) £55,000 £57,500 £55,000
Median % change year-on-year -4.35% +4.55% +4.76%
75th Percentile £71,250 £75,000 £70,000
90th Percentile £85,000 £90,000 £83,750
UK excluding London median annual salary £49,995 £50,000 £50,000
% change year-on-year -0.01% - +11.11%

All Process and Methodology Skills
UK

CRM is in the Processes and Methodologies category. The following table is for comparison with the above and provides summary statistics for all permanent job vacancies with a requirement for process or methodology skills.

Permanent vacancies with a requirement for process or methodology skills 50,908 120,439 123,182
As % of all permanent jobs advertised in the UK 94.09% 95.71% 95.44%
Number of salaries quoted 36,868 73,620 81,568
10th Percentile £32,500 £34,459 £32,500
25th Percentile £43,750 £45,000 £42,500
Median annual salary (50th Percentile) £60,000 £60,000 £59,045
Median % change year-on-year - +1.62% +7.35%
75th Percentile £80,000 £81,250 £77,500
90th Percentile £98,825 £100,000 £95,000
UK excluding London median annual salary £52,500 £53,000 £50,000
% change year-on-year -0.94% +6.00% +3.63%

CRM
Job Vacancy Trend

Job postings citing CRM as a proportion of all IT jobs advertised.
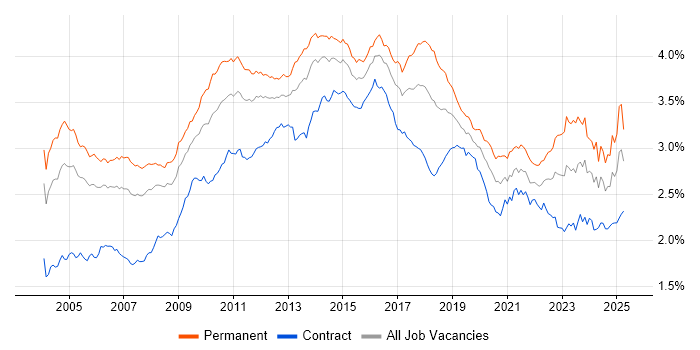
Job vacancy trend for CRM in the UK

CRM
Salary Trend

3-month moving average salary quoted in jobs citing CRM.

Salary trend for CRM in the UK

CRM
Salary Histogram

Salary distribution for jobs citing CRM over the 6 months to 29 November 2023.

Salary histogram for CRM in the UK

CRM
Top 17 Job Locations

The table below looks at the demand and provides a guide to the median salaries quoted in IT jobs citing CRM within the UK over the 6 months to 29 November 2023. The 'Rank Change' column provides an indication of the change in demand within each location based on the same 6 month period last year.

Location Rank Change
on Same Period
Last Year
Matching
Permanent
IT Job Ads
Median Salary
Past 6 Months
Median Salary
% Change
on Same Period
Last Year
Live
Jobs
England +23 1,579 £56,750 -1.30% 1,274
UK excluding London +26 1,055 £49,995 -0.01% 853
Work from Home +39 981 £57,500 - 590
London +1 603 £65,000 - 485
North of England +20 275 £50,000 - 240
South East +38 265 £47,000 -14.55% 256
Midlands +78 201 £47,500 - 142
North West -4 157 £50,000 - 123
West Midlands +59 147 £47,500 - 88
South West -2 119 £50,000 +9.89% 90
Yorkshire +74 111 £50,000 -5.66% 86
Scotland +39 94 £62,500 +47.06% 43
East Midlands +59 52 £52,500 +16.67% 52
East of England +5 39 £57,500 +9.52% 90
Wales +33 38 £37,430 -40.11% 14
Northern Ireland +51 26 £32,500 -54.86% 6
North East +32 10 £50,000 +25.00% 42

CRM
Co-occurring Skills and Capabilities by Category

The follow tables expand on the table above by listing co-occurrences grouped by category. The same employment type, locality and period is covered with up to 20 co-occurrences shown in each of the following categories:

Application Platforms
1 102 (5.56%) SharePoint
2 73 (3.98%) CMS
3 44 (2.40%) Confluence
4 38 (2.07%) IIS
5 21 (1.14%) WordPress
6 13 (0.71%) Liferay
7 11 (0.60%) Drupal
7 11 (0.60%) MS Exchange
8 8 (0.44%) Adobe Experience Manager
9 7 (0.38%) Umbraco
10 6 (0.33%) Headless CMS
11 5 (0.27%) Kentico
11 5 (0.27%) Tomcat
12 4 (0.22%) Apache Spark
12 4 (0.22%) Sitecore CMS
13 3 (0.16%) EPiServer
14 2 (0.11%) Apache
14 2 (0.11%) MODX
14 2 (0.11%) Oracle Workflow
14 2 (0.11%) Site Server
Applications
1 132 (7.19%) Microsoft Office
2 82 (4.47%) Microsoft Excel
3 26 (1.42%) MS Visio
4 22 (1.20%) Microsoft PowerPoint
5 11 (0.60%) Photoshop
6 10 (0.54%) Spreadsheet
7 9 (0.49%) InDesign
8 8 (0.44%) Microsoft Project
9 4 (0.22%) Trello
10 3 (0.16%) Chatbot
11 1 (0.054%) Adobe Creative Suite
11 1 (0.054%) Adobe Illustrator
11 1 (0.054%) Adobe Premiere
11 1 (0.054%) Adobe XD
11 1 (0.054%) Sketch
Business Applications
1 735 (40.05%) Dynamics CRM
2 65 (3.54%) Salesforce CRM
3 33 (1.80%) PlanetPress Connect
4 24 (1.31%) NetSuite
5 23 (1.25%) Siebel CRM
6 19 (1.04%) SAP CRM
7 12 (0.65%) SAP S/4HANA
8 11 (0.60%) BusinessWorks
8 11 (0.60%) Dynamics GP
9 10 (0.54%) Dynamics AX
9 10 (0.54%) Magento
10 9 (0.49%) Unit4 Business World
11 8 (0.44%) SAP CX
12 7 (0.38%) Dynamics NAV
12 7 (0.38%) SAP SD
13 6 (0.33%) Payment Gateway
13 6 (0.33%) Sage X3
14 5 (0.27%) Eloqua
14 5 (0.27%) SAP GTS
14 5 (0.27%) SAP Hybris
Cloud Services
1 613 (33.41%) Azure
1 613 (33.41%) Power Platform
2 575 (31.34%) Dynamics 365
3 314 (17.11%) SaaS
4 273 (14.88%) Serverless
5 262 (14.28%) Azure Functions
6 252 (13.73%) PaaS
7 243 (13.24%) IaaS
8 167 (9.10%) Azure DevOps
9 146 (7.96%) PowerApps
10 136 (7.41%) Microsoft 365
11 102 (5.56%) Power Automate
12 89 (4.85%) AWS
13 47 (2.56%) Azure Logic Apps
14 39 (2.13%) FinancialForce
15 35 (1.91%) Google Analytics
16 33 (1.80%) Azure Data Factory
17 29 (1.58%) Azure Service Bus
17 29 (1.58%) Salesforce Service Cloud
18 20 (1.09%) Entra ID
Communications & Networking
1 15 (0.82%) Internet
2 14 (0.76%) Firewall
2 14 (0.76%) IP Telephony
3 13 (0.71%) TCP/IP
4 12 (0.65%) DNS
5 11 (0.60%) LAN
5 11 (0.60%) SMS
6 8 (0.44%) DHCP
7 7 (0.38%) HTTP
7 7 (0.38%) WAN
8 6 (0.33%) Intranet
8 6 (0.33%) VLAN
9 5 (0.27%) Structured Cabling
9 5 (0.27%) Wireless
10 4 (0.22%) IPv4
10 4 (0.22%) IPv6
10 4 (0.22%) MPLS
10 4 (0.22%) Remote Desktop
10 4 (0.22%) VoIP
11 3 (0.16%) PSTN
Database & Business Intelligence
1 249 (13.57%) Power BI
2 197 (10.74%) SQL Server
3 102 (5.56%) Data Warehouse
4 76 (4.14%) SQL Server Integration Services
5 50 (2.72%) MySQL
6 41 (2.23%) SQL Server Reporting Services
7 37 (2.02%) Relational Database
7 37 (2.02%) Tableau
8 35 (1.91%) Data Lake
9 29 (1.58%) Azure SQL Database
9 29 (1.58%) NoSQL
10 15 (0.82%) Data Mining
11 14 (0.76%) Big Data
12 13 (0.71%) Oracle BI EE
13 10 (0.54%) Redis
14 9 (0.49%) DynamoDB
15 8 (0.44%) Data Hub
15 8 (0.44%) MariaDB
16 7 (0.38%) Looker
16 7 (0.38%) Oracle Database
Development Applications
1 127 (6.92%) JIRA
2 50 (2.72%) Visual Studio
3 46 (2.51%) Git
4 28 (1.53%) SQL Server Management Studio (SSMS)
5 13 (0.71%) Jenkins
6 12 (0.65%) Bitbucket
7 7 (0.38%) NUnit
7 7 (0.38%) Selenium
8 6 (0.33%) git-flow
8 6 (0.33%) SpecFlow
9 3 (0.16%) MSTest
9 3 (0.16%) Oracle APEX
9 3 (0.16%) Postman
9 3 (0.16%) TeamCity
10 2 (0.11%) Android Studio
10 2 (0.11%) ESLint
10 2 (0.11%) GitLab
10 2 (0.11%) Subversion
10 2 (0.11%) TestComplete
11 1 (0.054%) gulp
General
1 647 (35.26%) Finance
2 460 (25.07%) Social Skills
3 328 (17.87%) Marketing
4 178 (9.70%) Analytical Skills
5 109 (5.94%) Manufacturing
6 84 (4.58%) Retail
7 78 (4.25%) Public Sector
8 77 (4.20%) Legal
9 55 (3.00%) Presentation Skills
10 53 (2.89%) Inclusion and Diversity
11 45 (2.45%) Banking
12 40 (2.18%) Law
13 39 (2.13%) Advertising
14 37 (2.02%) Local Government
15 36 (1.96%) Organisational Skills
16 24 (1.31%) Telecoms
17 21 (1.14%) Back Office
18 20 (1.09%) Influencing Skills
19 19 (1.04%) Billing
20 16 (0.87%) Electronics
Job Titles
1 360 (19.62%) Developer
2 346 (18.86%) Analyst
3 339 (18.47%) Architect
4 233 (12.70%) Dynamics 365 Architect
5 227 (12.37%) CRM Architect
6 223 (12.15%) Dynamics CRM Architect
7 146 (7.96%) Senior
8 107 (5.83%) Dynamics 365 Developer
9 100 (5.45%) CRM Developer
10 99 (5.40%) Business Analyst
11 87 (4.74%) Consultant
12 81 (4.41%) Support Analyst
13 80 (4.36%) Dynamics CRM Developer
14 78 (4.25%) Applications Support
15 72 (3.92%) Lead
16 70 (3.81%) Dynamics 365 CRM Developer
17 59 (3.22%) Administrator
18 58 (3.16%) Project Manager
19 56 (3.05%) Solutions Architect
20 54 (2.94%) Development Manager
Libraries, Frameworks & Software Standards
1 253 (13.79%) .NET
2 176 (9.59%) HTML
3 153 (8.34%) CSS
4 63 (3.43%) Web Services
5 51 (2.78%) .NET Framework
5 51 (2.78%) REST
6 42 (2.29%) React
7 37 (2.02%) ASP.NET
8 36 (1.96%) Laravel
9 30 (1.63%) AngularJS
9 30 (1.63%) Vue
10 29 (1.58%) .NET Core
10 29 (1.58%) SOAP
11 26 (1.42%) Node.js
12 25 (1.36%) XML
13 22 (1.20%) HTML5
13 22 (1.20%) Lightning Web Components
14 18 (0.98%) JSON
15 17 (0.93%) jQuery
16 15 (0.82%) ASP.NET MVC
Miscellaneous
1 98 (5.34%) Management Information System
2 81 (4.41%) Self-Motivation
3 63 (3.43%) Enterprise Software
4 62 (3.38%) Product Ownership
5 39 (2.13%) Social Media
6 34 (1.85%) Driving Licence
7 30 (1.63%) Data Structures
8 29 (1.58%) Low-Code
9 27 (1.47%) Cloud Native
10 26 (1.42%) Onboarding
11 25 (1.36%) Legacy Systems
12 22 (1.20%) Virtual Team
13 19 (1.04%) Marketing Technology
14 16 (0.87%) Video Conferencing
15 15 (0.82%) NHS
16 14 (0.76%) IoT
17 12 (0.65%) Mobile App
18 10 (0.54%) Data Centre
18 10 (0.54%) Equities
18 10 (0.54%) Greenfield Project
Operating Systems
1 86 (4.69%) Windows
2 35 (1.91%) Windows Server
3 31 (1.69%) Windows 10
4 21 (1.14%) Apple iOS
5 13 (0.71%) Android
5 13 (0.71%) Linux
6 9 (0.49%) Windows Server 2019
7 6 (0.33%) Windows Server 2016
8 5 (0.27%) Windows 7
8 5 (0.27%) Windows Server 2012
9 4 (0.22%) Windows 8
10 3 (0.16%) Windows Server 2003
11 1 (0.054%) Unix
11 1 (0.054%) VMS
11 1 (0.054%) Windows Server 2008
Processes & Methodologies
1 686 (37.38%) Agile
2 393 (21.42%) Roadmaps
3 333 (18.15%) Business Intelligence
4 320 (17.44%) Problem-Solving
5 314 (17.11%) Actionable Insight
6 277 (15.10%) Presales
7 261 (14.22%) DevOps
8 254 (13.84%) ERP
9 238 (12.97%) Strategic Roadmap
10 227 (12.37%) Project Planning
11 221 (12.04%) Work Breakdown Structure
12 165 (8.99%) Analytics
13 160 (8.72%) Migration
14 156 (8.50%) ITIL
15 143 (7.79%) Project Management
16 130 (7.08%) Stakeholder Management
17 121 (6.59%) Scrum
18 113 (6.16%) Customer Service
19 106 (5.78%) Decision-Making
20 100 (5.45%) Business Analysis
Programming Languages
1 382 (20.82%) SQL
2 284 (15.48%) JavaScript
3 277 (15.10%) C#
4 65 (3.54%) Python
5 63 (3.43%) Java
6 59 (3.22%) T-SQL
7 58 (3.16%) PHP
8 37 (2.02%) PowerShell
9 35 (1.91%) TypeScript
10 18 (0.98%) Apex Code
11 16 (0.87%) PL/SQL
12 9 (0.49%) VB.NET
13 7 (0.38%) Bash
14 6 (0.33%) Kusto Query Language
15 5 (0.27%) ABAP
15 5 (0.27%) Kotlin
15 5 (0.27%) Shell Script
16 4 (0.22%) Data Analysis Expressions
16 4 (0.22%) R
17 3 (0.16%) Go
Qualifications
1 275 (14.99%) Degree
2 54 (2.94%) Security Cleared
3 47 (2.56%) SC Cleared
4 44 (2.40%) Computer Science Degree
5 23 (1.25%) Microsoft Certification
6 14 (0.76%) Master's Degree
7 12 (0.65%) BPSS Clearance
7 12 (0.65%) ITIL Certification
8 11 (0.60%) MCSE
9 9 (0.49%) Azure Certification
10 7 (0.38%) ISEB
10 7 (0.38%) ITIL Foundation Certificate
10 7 (0.38%) MCP
11 6 (0.33%) APMP
11 6 (0.33%) DBS Check
11 6 (0.33%) ISTQB
11 6 (0.33%) PMP
12 5 (0.27%) MCSA
12 5 (0.27%) PMI Certification
12 5 (0.27%) PRINCE2 Practitioner
Quality Assurance & Compliance
1 82 (4.47%) QA
2 46 (2.51%) GDPR
3 31 (1.69%) NIST
4 26 (1.42%) Data Quality
5 21 (1.14%) ISO/IEC 27001
5 21 (1.14%) SLA
6 13 (0.71%) PMO
7 12 (0.65%) MiFID
8 10 (0.54%) PCI DSS
9 8 (0.44%) Accessibility
10 7 (0.38%) COBIT
11 6 (0.33%) Cyber Essentials
11 6 (0.33%) ISO 9000
12 4 (0.22%) Cyber Essentials PLUS
13 1 (0.054%) Actionable Recommendations
13 1 (0.054%) GRC
13 1 (0.054%) ITGC
13 1 (0.054%) Sarbanes-Oxley
System Software
1 57 (3.11%) Active Directory
2 16 (0.87%) Docker
3 8 (0.44%) Hyper-V
4 6 (0.33%) VMware Infrastructure
5 5 (0.27%) vSphere
6 2 (0.11%) Virtual Machines
7 1 (0.054%) Virtual Desktop
7 1 (0.054%) Virtual Servers
Systems Management
1 23 (1.25%) Kubernetes
2 10 (0.54%) Terraform
3 9 (0.49%) Grafana
4 5 (0.27%) Ansible
4 5 (0.27%) Autotask
4 5 (0.27%) HP ALM
4 5 (0.27%) Nessus
5 3 (0.16%) Active Directory Federation Services
5 3 (0.16%) Microsoft Intune
5 3 (0.16%) SCCM
6 2 (0.11%) Systems Management Server (SMS)
7 1 (0.054%) FortiGate
7 1 (0.054%) Oracle Identity Management
7 1 (0.054%) Progress Chef
Vendors
1 831 (45.29%) Microsoft
2 320 (17.44%) Salesforce
3 103 (5.61%) HubSpot
4 76 (4.14%) SAP
5 71 (3.87%) Oracle
6 51 (2.78%) Google
7 44 (2.40%) Sage
8 42 (2.29%) Adobe
9 40 (2.18%) Pardot
10 36 (1.96%) Atlassian
11 34 (1.85%) Siebel
12 31 (1.69%) ServiceNow
13 27 (1.47%) FNZ
14 23 (1.25%) Salesforce Marketing Cloud
15 22 (1.20%) MuleSoft
16 15 (0.82%) Sitecore
17 13 (0.71%) Databricks
17 13 (0.71%) Informatica
18 12 (0.65%) VMware
19 11 (0.60%) TIBCO