Project Delivery
UK

The following table provides summary statistics for permanent job vacancies with a requirement for Project Delivery skills. Included is a benchmarking guide to the salaries offered in vacancies that have cited Project Delivery over the 6 months to 2 December 2023 with a comparison to the same period in the previous 2 years.

6 months to
2 Dec 2023
Same period 2022 Same period 2021
Rank 50 63 74
Rank change year-on-year +13 +11 +38
Permanent jobs citing Project Delivery 2,873 6,115 5,452
As % of all permanent jobs advertised in the UK 5.38% 4.88% 4.22%
As % of the Processes & Methodologies category 5.72% 5.10% 4.42%
Number of salaries quoted 1,880 3,502 3,707
10th Percentile £41,250 £40,000 £38,750
25th Percentile £50,000 £47,500 £47,000
Median annual salary (50th Percentile) £60,000 £62,086 £60,000
Median % change year-on-year -3.36% +3.48% +4.35%
75th Percentile £75,415 £80,000 £78,750
90th Percentile £93,875 £97,290 £102,500
UK excluding London median annual salary £57,500 £53,850 £55,000
% change year-on-year +6.78% -2.09% +10.00%

All Process and Methodology Skills
UK

Project Delivery is in the Processes and Methodologies category. The following table is for comparison with the above and provides summary statistics for all permanent job vacancies with a requirement for process or methodology skills.

Permanent vacancies with a requirement for process or methodology skills 50,205 119,980 123,470
As % of all permanent jobs advertised in the UK 94.09% 95.73% 95.46%
Number of salaries quoted 36,305 73,101 82,277
10th Percentile £32,500 £34,500 £32,500
25th Percentile £43,750 £45,000 £42,500
Median annual salary (50th Percentile) £60,000 £60,000 £60,000
Median % change year-on-year - - +9.09%
75th Percentile £80,000 £82,000 £77,500
90th Percentile £99,000 £100,000 £95,000
UK excluding London median annual salary £52,500 £53,000 £50,000
% change year-on-year -0.94% +6.00% +4.17%

Project Delivery
Job Vacancy Trend

Job postings citing Project Delivery as a proportion of all IT jobs advertised.
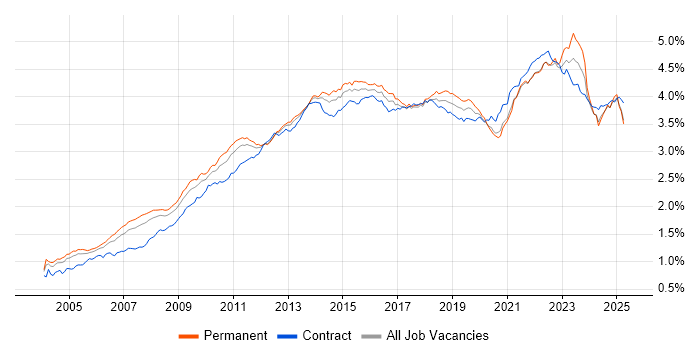
Job vacancy trend for Project Delivery in the UK

Project Delivery
Salary Trend

3-month moving average salary quoted in jobs citing Project Delivery.

Salary trend for Project Delivery in the UK

Project Delivery
Salary Histogram

Salary distribution for jobs citing Project Delivery over the 6 months to 2 December 2023.

Salary histogram for Project Delivery in the UK

Project Delivery
Top 17 Job Locations

The table below looks at the demand and provides a guide to the median salaries quoted in IT jobs citing Project Delivery within the UK over the 6 months to 2 December 2023. The 'Rank Change' column provides an indication of the change in demand within each location based on the same 6 month period last year.

Location Rank Change
on Same Period
Last Year
Matching
Permanent
IT Job Ads
Median Salary
Past 6 Months
Median Salary
% Change
on Same Period
Last Year
Live
Jobs
England +16 2,544 £60,000 -4.00% 1,333
UK excluding London +3 1,706 £57,500 +6.78% 917
Work from Home +18 1,174 £60,000 -0.29% 612
London +33 954 £70,000 -6.67% 493
North of England +10 468 £60,000 +14.29% 236
South East -3 359 £60,000 +10.09% 226
Midlands +7 305 £55,000 +4.76% 187
North West +23 268 £60,000 +14.29% 132
South West +17 248 £59,526 +3.52% 95
West Midlands +5 195 £55,000 +4.76% 139
Yorkshire -7 171 £58,250 +8.37% 73
East of England +30 130 £55,000 -12.00% 81
Scotland -1 121 £59,526 -0.79% 76
East Midlands +10 96 £54,000 +2.86% 46
Wales -12 56 £52,500 +5.00% 27
Northern Ireland +38 30 £60,000 +46.34% 17
North East +11 29 £52,500 +5.00% 32

Project Delivery
Co-occurring Skills and Capabilities by Category

The follow tables expand on the table above by listing co-occurrences grouped by category. The same employment type, locality and period is covered with up to 20 co-occurrences shown in each of the following categories:

Application Platforms
1 119 (4.14%) SharePoint
2 68 (2.37%) Confluence
3 31 (1.08%) MS Exchange
4 18 (0.63%) Apache Spark
5 15 (0.52%) WebSphere
6 14 (0.49%) WebSphere Application Server
7 12 (0.42%) Anypoint
8 9 (0.31%) Apache
9 8 (0.28%) OpenEdge
10 7 (0.24%) CMS
11 5 (0.17%) ThingWorx
12 4 (0.14%) Exchange Server 2010
12 4 (0.14%) IIS
13 3 (0.10%) Adobe Experience Manager
13 3 (0.10%) Appian
13 3 (0.10%) Camunda
13 3 (0.10%) Exchange Server 2013
13 3 (0.10%) MS Project Server
13 3 (0.10%) OpenStack
13 3 (0.10%) Tomcat
Applications
1 150 (5.22%) Microsoft Project
2 121 (4.21%) Microsoft Office
3 116 (4.04%) Microsoft Excel
4 73 (2.54%) Microsoft PowerPoint
5 40 (1.39%) MS Visio
6 11 (0.38%) AutoCAD
7 7 (0.24%) Spreadsheet
7 7 (0.24%) Trello
8 6 (0.21%) CATIA
9 4 (0.14%) Adobe After Effects
9 4 (0.14%) Adobe Premiere
9 4 (0.14%) Photoshop
10 1 (0.035%) Adobe XD
10 1 (0.035%) Siemens NX
10 1 (0.035%) SPSS
Business Applications
1 43 (1.50%) SAP S/4HANA
2 21 (0.73%) Elite 3E
2 21 (0.73%) Remedy ITSM
3 14 (0.49%) Dynamics CRM
4 12 (0.42%) Unit4 Business World
5 9 (0.31%) SAP CX
6 8 (0.28%) Oracle EBS
6 8 (0.28%) SAP EWM
6 8 (0.28%) SAP SCM
6 8 (0.28%) SAP SD
7 7 (0.24%) SAP CO
7 7 (0.24%) SAP FI
7 7 (0.24%) SAP FI/CO
8 6 (0.21%) SAP CRM
8 6 (0.21%) SAP MM
8 6 (0.21%) SAP WM
8 6 (0.21%) Teamcenter
9 5 (0.17%) Dynamics NAV
9 5 (0.17%) Primavera
9 5 (0.17%) SAP GTS
Cloud Services
1 511 (17.79%) Azure
2 255 (8.88%) Microsoft 365
3 211 (7.34%) AWS
4 136 (4.73%) Power Platform
5 130 (4.52%) Azure DevOps
6 117 (4.07%) SaaS
7 83 (2.89%) IaaS
8 79 (2.75%) GCP
8 79 (2.75%) PaaS
9 63 (2.19%) Entra ID
10 46 (1.60%) PowerApps
11 39 (1.36%) Dynamics 365
12 27 (0.94%) Serverless
13 26 (0.90%) Power Automate
14 23 (0.80%) BlazeMeter
14 23 (0.80%) GitHub
15 19 (0.66%) Cloud Computing
16 17 (0.59%) AWS Direct Connect
17 16 (0.56%) Azure Logic Apps
18 15 (0.52%) Snowflake
Communications & Networking
1 167 (5.81%) Firewall
2 127 (4.42%) VPN
3 109 (3.79%) WAN
4 95 (3.31%) LAN
5 64 (2.23%) Wireless
6 62 (2.16%) DNS
7 57 (1.98%) DHCP
8 55 (1.91%) TCP/IP
9 54 (1.88%) VLAN
10 49 (1.71%) SD-WAN
11 39 (1.36%) Network Security
11 39 (1.36%) SAN
12 31 (1.08%) Internet
12 31 (1.08%) VoIP
12 31 (1.08%) Wi-Fi
13 30 (1.04%) BGP
13 30 (1.04%) OSPF
14 20 (0.70%) 5G
15 19 (0.66%) IPsec
15 19 (0.66%) WLAN
Database & Business Intelligence
1 172 (5.99%) SQL Server
2 121 (4.21%) Electronic Patient Records
3 98 (3.41%) Power BI
4 41 (1.43%) Relational Database
5 36 (1.25%) Data Warehouse
6 34 (1.18%) MySQL
7 33 (1.15%) Data Lake
8 30 (1.04%) Elasticsearch
9 24 (0.84%) MongoDB
10 23 (0.80%) Tableau
11 21 (0.73%) Oracle Database
12 19 (0.66%) Data Mining
12 19 (0.66%) Oracle Database 11g
13 18 (0.63%) Hadoop
13 18 (0.63%) Oracle Database 10g
14 17 (0.59%) Apache Ignite
14 17 (0.59%) BusinessObjects
14 17 (0.59%) SQL Server Integration Services
15 14 (0.49%) BusinessObjects Business Intelligence
16 13 (0.45%) NoSQL
Development Applications
1 169 (5.88%) JIRA
2 47 (1.64%) Git
3 38 (1.32%) Jenkins
4 35 (1.22%) Cucumber
5 21 (0.73%) REST Assured
5 21 (0.73%) Selenium
6 20 (0.70%) SoapUI
7 19 (0.66%) JUnit
8 18 (0.63%) eggPlant
8 18 (0.63%) JMeter
8 18 (0.63%) LoadRunner
8 18 (0.63%) Postman
8 18 (0.63%) The Grinder
9 17 (0.59%) Maven
9 17 (0.59%) Spinnaker
10 14 (0.49%) Oracle APEX
11 13 (0.45%) GitLab
12 12 (0.42%) Cypress.io
13 10 (0.35%) ClearCase
13 10 (0.35%) Mockito
General
1 947 (32.96%) Social Skills
2 912 (31.74%) Finance
3 322 (11.21%) Analytical Skills
4 305 (10.62%) Public Sector
5 301 (10.48%) Inclusion and Diversity
6 280 (9.75%) Organisational Skills
7 197 (6.86%) Retail
8 133 (4.63%) Legal
9 121 (4.21%) Marketing
10 112 (3.90%) Presentation Skills
11 107 (3.72%) Manufacturing
12 105 (3.65%) Telecoms
13 103 (3.59%) Banking
14 93 (3.24%) Billing
15 88 (3.06%) Influencing Skills
15 88 (3.06%) Law
16 59 (2.05%) Documentation Skills
17 42 (1.46%) Electronics
18 38 (1.32%) Automotive
19 37 (1.29%) Aerospace
Job Titles
1 815 (28.37%) Project Manager
2 512 (17.82%) Senior
3 377 (13.12%) Analyst
4 261 (9.08%) Lead
5 259 (9.01%) Architect
6 217 (7.55%) Senior Manager
7 195 (6.79%) Senior Project Manager
8 186 (6.47%) Consultant
9 177 (6.16%) IT Manager
10 147 (5.12%) Solutions Architect
11 142 (4.94%) Business Analyst
12 121 (4.21%) IT Project Manager
13 104 (3.62%) Developer
14 86 (2.99%) Infrastructure Manager
15 69 (2.40%) Delivery Manager
16 65 (2.26%) Billing Analyst
17 64 (2.23%) Infrastructure Project Manager
18 60 (2.09%) Software Engineer
19 51 (1.78%) Network Engineer
20 46 (1.60%) Programme Manager
Libraries, Frameworks & Software Standards
1 113 (3.93%) .NET
2 93 (3.24%) REST
3 71 (2.47%) HTML
4 69 (2.40%) SOAP
5 57 (1.98%) CSS
5 57 (1.98%) Web Services
6 53 (1.84%) Middleware
6 53 (1.84%) XML
7 50 (1.74%) JSON
8 42 (1.46%) Spring
9 33 (1.15%) ASP.NET
10 31 (1.08%) AngularJS
10 31 (1.08%) Hibernate
10 31 (1.08%) React
11 30 (1.04%) JDBC
11 30 (1.04%) RESTful
11 30 (1.04%) Struts
12 26 (0.90%) Kafka
13 25 (0.87%) Velocity
14 22 (0.77%) OpenAPI
Miscellaneous
1 229 (7.97%) Management Information System
2 179 (6.23%) Virtual Team
3 110 (3.83%) Data Centre
4 105 (3.65%) Self-Motivation
5 100 (3.48%) Driving Licence
6 86 (2.99%) Enterprise Software
7 80 (2.78%) Product Ownership
8 57 (1.98%) Onboarding
9 55 (1.91%) Public Cloud
10 35 (1.22%) Cloud Native
11 33 (1.15%) Legacy Systems
12 26 (0.90%) Private Cloud
12 26 (0.90%) Reinsurance
13 25 (0.87%) Mobile App
13 25 (0.87%) Virtual Reality
14 23 (0.80%) PMI
15 22 (0.77%) Replication
16 20 (0.70%) FMCG
16 20 (0.70%) Operational Technology
17 19 (0.66%) Augmented Reality
Operating Systems
1 261 (9.08%) Windows
2 144 (5.01%) Windows Server
3 80 (2.78%) Linux
4 48 (1.67%) Unix
5 44 (1.53%) Windows 10
6 23 (0.80%) Android
6 23 (0.80%) Windows Server 2012
7 19 (0.66%) Windows Server 2003
8 17 (0.59%) Apple iOS
9 14 (0.49%) SUSE
9 14 (0.49%) Ubuntu
10 11 (0.38%) AIX
11 9 (0.31%) Red Hat Enterprise Linux
12 8 (0.28%) Windows 7
13 7 (0.24%) Windows Server 2016
13 7 (0.24%) Windows Server 2019
14 6 (0.21%) Mac OS
15 2 (0.070%) Solaris
15 2 (0.070%) Windows 8
15 2 (0.070%) Windows Server 2008
Processes & Methodologies
1 1,126 (39.19%) Project Management
2 1,102 (38.36%) Agile
3 552 (19.21%) Stakeholder Management
4 462 (16.08%) Problem-Solving
5 399 (13.89%) PRINCE2
6 396 (13.78%) Scrum
7 357 (12.43%) Waterfall
8 355 (12.36%) SDLC
9 321 (11.17%) Change Management
10 304 (10.58%) DevOps
11 293 (10.20%) Migration
12 279 (9.71%) Continuous Improvement
13 253 (8.81%) Mentoring
14 242 (8.42%) Computer Science
14 242 (8.42%) Roadmaps
15 237 (8.25%) Actionable Insight
16 221 (7.69%) ERP
17 212 (7.38%) People Management
18 201 (7.00%) Business Analysis
19 195 (6.79%) ITIL
Programming Languages
1 260 (9.05%) SQL
2 173 (6.02%) Python
3 167 (5.81%) JavaScript
4 139 (4.84%) Java
5 101 (3.52%) PowerShell
6 95 (3.31%) C#
7 47 (1.64%) PL/SQL
8 43 (1.50%) C++
9 40 (1.39%) C
10 37 (1.29%) R
11 32 (1.11%) Perl
12 31 (1.08%) T-SQL
13 27 (0.94%) Groovy
14 24 (0.84%) TypeScript
15 22 (0.77%) PHP
16 16 (0.56%) Bash
17 15 (0.52%) Bicep
18 11 (0.38%) Go
18 11 (0.38%) Shell Script
19 10 (0.35%) VBScript
Qualifications
1 580 (20.19%) Degree
2 389 (13.54%) Security Cleared
3 252 (8.77%) SC Cleared
4 193 (6.72%) Computer Science Degree
5 88 (3.06%) DV Cleared
6 85 (2.96%) Microsoft Certification
7 76 (2.65%) PMI Certification
8 74 (2.58%) Postgraduate
9 72 (2.51%) PMP
10 60 (2.09%) Cisco Certification
11 56 (1.95%) BPSS Clearance
12 45 (1.57%) CCNP
13 38 (1.32%) PRINCE2 Practitioner
14 36 (1.25%) Master's Degree
15 30 (1.04%) DBS Check
16 28 (0.97%) ITIL Certification
16 28 (0.97%) MCSE
17 27 (0.94%) CCNA
18 25 (0.87%) AWS Certification
19 24 (0.84%) VMware Certified Professional (VCP)
Quality Assurance & Compliance
1 189 (6.58%) QA
2 153 (5.33%) PMO
3 54 (1.88%) Data Quality
4 43 (1.50%) ISO/IEC 27001
5 35 (1.22%) SLA
6 28 (0.97%) Accessibility
7 20 (0.70%) GDPR
8 18 (0.63%) HL7
8 18 (0.63%) ISO 9001
9 17 (0.59%) COBIT
10 14 (0.49%) NIST
11 12 (0.42%) NCSC
12 10 (0.35%) ISO/IEC 20000
13 8 (0.28%) Cyber Essentials
13 8 (0.28%) GRC
14 7 (0.24%) NIST 800
15 5 (0.17%) WCAG
16 4 (0.14%) ISO/IEC 27005
16 4 (0.14%) P3O
16 4 (0.14%) PCI DSS
System Software
1 178 (6.20%) Active Directory
2 105 (3.65%) VMware Infrastructure
3 60 (2.09%) Docker
4 39 (1.36%) Hyper-V
5 25 (0.87%) vSphere
6 20 (0.70%) Firmware
7 19 (0.66%) VMware ESXi
8 14 (0.49%) vCloud
9 13 (0.45%) Virtual Desktop
10 9 (0.31%) Terminal Server
11 6 (0.21%) KVM
11 6 (0.21%) Virtual Servers
12 5 (0.17%) BitLocker
13 4 (0.14%) Virtual Machines
13 4 (0.14%) XenApp
14 3 (0.10%) Ceph
14 3 (0.10%) VMware NSX
15 1 (0.035%) XenDesktop
Systems Management
1 88 (3.06%) Microsoft Intune
2 80 (2.78%) Kubernetes
3 68 (2.37%) Terraform
4 21 (0.73%) SCCM
5 20 (0.70%) FortiGate
6 18 (0.63%) HP Quality Center
7 17 (0.59%) Istio
8 13 (0.45%) Ansible
9 12 (0.42%) SCOM
9 12 (0.42%) Single Sign-On
10 7 (0.24%) Active Directory Federation Services
10 7 (0.24%) Progress Chef
11 6 (0.21%) AirWatch
11 6 (0.21%) Cacti
11 6 (0.21%) Icinga
11 6 (0.21%) Jamf Pro
11 6 (0.21%) Puppet
12 5 (0.17%) Functional Safety
13 4 (0.14%) Prometheus
14 3 (0.10%) Grafana
Vendors
1 592 (20.61%) Microsoft
2 187 (6.51%) Salesforce
3 148 (5.15%) SAP
4 140 (4.87%) VMware
5 125 (4.35%) Oracle
6 122 (4.25%) NEC
7 110 (3.83%) Cisco
8 109 (3.79%) ServiceNow
9 73 (2.54%) HP
10 64 (2.23%) Google
11 41 (1.43%) Palo Alto
12 40 (1.39%) Remedy
13 37 (1.29%) Juniper
14 36 (1.25%) Veeam
15 32 (1.11%) Meraki
16 30 (1.04%) Citrix
17 29 (1.01%) NetApp
18 26 (0.90%) Aruba
19 24 (0.84%) MuleSoft
20 23 (0.80%) Dell