Relational Database
UK

The following table provides summary statistics for permanent job vacancies with a requirement for Relational Database skills. Included is a benchmarking guide to the salaries offered in vacancies that have cited Relational Database over the 6 months to 10 December 2023 with a comparison to the same period in the previous 2 years.

6 months to
10 Dec 2023
Same period 2022 Same period 2021
Rank 177 147 123
Rank change year-on-year -30 -24 +13
Permanent jobs citing Relational Database 1,041 3,017 3,743
As % of all permanent jobs advertised in the UK 1.99% 2.47% 2.95%
As % of the Database & Business Intelligence category 9.28% 10.62% 10.90%
Number of salaries quoted 704 1,737 2,155
10th Percentile £37,150 £37,500 £37,000
25th Percentile £47,500 £47,400 £45,000
Median annual salary (50th Percentile) £62,250 £60,000 £60,000
Median % change year-on-year +3.75% - +9.09%
75th Percentile £80,313 £83,750 £77,500
90th Percentile £90,000 £97,050 £95,000
UK excluding London median annual salary £52,700 £55,000 £50,000
% change year-on-year -4.18% +10.00% +5.26%

All Database and Business Intelligence Skills
UK

Relational Database is in the Databases and Business Intelligence category. The following table is for comparison with the above and provides summary statistics for all permanent job vacancies with a requirement for database or business intelligence skills.

Permanent vacancies with a requirement for database or business intelligence skills 11,214 28,399 34,324
As % of all permanent jobs advertised in the UK 21.45% 23.23% 27.01%
Number of salaries quoted 8,322 17,485 22,575
10th Percentile £36,750 £36,750 £35,457
25th Percentile £46,875 £46,250 £42,625
Median annual salary (50th Percentile) £60,000 £62,500 £58,500
Median % change year-on-year -4.00% +6.84% +6.36%
75th Percentile £80,000 £82,500 £77,500
90th Percentile £95,000 £100,000 £95,000
UK excluding London median annual salary £55,000 £55,000 £50,000
% change year-on-year - +10.00% +2.04%

Relational Database
Job Vacancy Trend

Job postings citing Relational Database as a proportion of all IT jobs advertised.
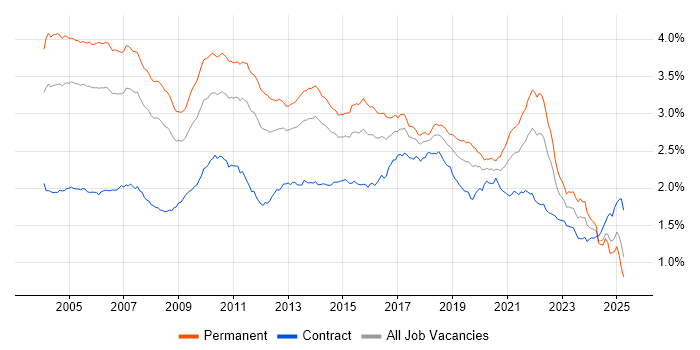
Job vacancy trend for Relational Database in the UK

Relational Database
Salary Trend

3-month moving average salary quoted in jobs citing Relational Database.

Salary trend for Relational Database in the UK

Relational Database
Salary Histogram

Salary distribution for jobs citing Relational Database over the 6 months to 10 December 2023.

Salary histogram for Relational Database in the UK

Relational Database
Top 17 Job Locations

The table below looks at the demand and provides a guide to the median salaries quoted in IT jobs citing Relational Database within the UK over the 6 months to 10 December 2023. The 'Rank Change' column provides an indication of the change in demand within each location based on the same 6 month period last year.

Location Rank Change
on Same Period
Last Year
Matching
Permanent
IT Job Ads
Median Salary
Past 6 Months
Median Salary
% Change
on Same Period
Last Year
Live
Jobs
England -25 850 £62,000 -0.80% 357
Work from Home +29 595 £62,500 +4.17% 183
UK excluding London -7 549 £52,700 -4.18% 236
London -18 406 £75,000 - 157
North of England +21 152 £50,000 -9.09% 69
South East +19 126 £55,000 - 61
Scotland +11 84 £65,000 +44.44% 21
North West +42 75 £50,000 +11.11% 33
Yorkshire +28 72 £50,000 -25.93% 34
South West -10 68 £62,500 +19.05% 29
Midlands -8 55 £47,000 -10.48% 28
West Midlands -3 31 £37,500 -28.57% 22
East of England +57 25 £52,500 -27.08% 18
East Midlands +42 24 £55,000 +1.85% 6
Wales +26 24 £43,190 -1.84% 4
Northern Ireland -3 16 £37,500 -16.67% 6
North East +11 5 £45,000 -4.26% 3

Relational Database
Co-occurring Skills and Capabilities by Category

The follow tables expand on the table above by listing co-occurrences grouped by category. The same employment type, locality and period is covered with up to 20 co-occurrences shown in each of the following categories:

Application Platforms
1 73 (7.01%) Apache Spark
2 69 (6.63%) Apache
3 21 (2.02%) Confluence
4 15 (1.44%) OpenStack
5 14 (1.34%) Umbraco
6 13 (1.25%) JBoss
7 11 (1.06%) IIS
8 9 (0.86%) Red Hat Fuse
9 8 (0.77%) Apache Airflow
9 8 (0.77%) OpenEdge
10 7 (0.67%) SharePoint
11 5 (0.48%) WebSphere
12 4 (0.38%) Jupyter
12 4 (0.38%) Luigi
12 4 (0.38%) Tomcat
13 3 (0.29%) Tornado
14 2 (0.19%) Apache Solr
14 2 (0.19%) nginx
14 2 (0.19%) Oracle SOA Suite
14 2 (0.19%) Oracle Workflow
Applications
1 22 (2.11%) Microsoft Excel
2 20 (1.92%) Microsoft Office
3 5 (0.48%) Spreadsheet
4 4 (0.38%) Microsoft PowerPoint
5 3 (0.29%) MS Visio
6 2 (0.19%) InDesign
6 2 (0.19%) Trello
7 1 (0.096%) Microsoft Project
7 1 (0.096%) SPSS
Business Applications
1 73 (7.01%) Endur
2 17 (1.63%) Elite 3E
2 17 (1.63%) Remedy ITSM
3 9 (0.86%) Dynamics CRM
4 6 (0.58%) OpenLink RightAngle
5 2 (0.19%) Aladdin
5 2 (0.19%) Distributed Ledger
5 2 (0.19%) Oracle Cash Management
5 2 (0.19%) Siebel CRM
5 2 (0.19%) thinkFolio
6 1 (0.096%) Dynamics AX
6 1 (0.096%) IBM Planning Analytics
6 1 (0.096%) Oracle FAH
6 1 (0.096%) Oracle General Ledger
Cloud Services
1 248 (23.82%) Azure
2 205 (19.69%) AWS
3 159 (15.27%) Serverless
4 130 (12.49%) Power Platform
5 96 (9.22%) GCP
6 67 (6.44%) GitHub
7 57 (5.48%) SaaS
8 49 (4.71%) GitHub Actions
9 48 (4.61%) Azure DevOps
10 47 (4.51%) Vertex AI
11 37 (3.55%) AWS Lambda
12 36 (3.46%) Amazon ECS
13 35 (3.36%) Amazon EKS
14 28 (2.69%) Amazon S3
14 28 (2.69%) Azure Data Factory
15 24 (2.31%) PaaS
16 21 (2.02%) Cloud Computing
17 20 (1.92%) Amazon SQS
17 20 (1.92%) Azure Service Bus
18 17 (1.63%) Azure Synapse Analytics
Communications & Networking
1 18 (1.73%) Internet
2 16 (1.54%) Firewall
3 7 (0.67%) HTTP
4 6 (0.58%) DNS
4 6 (0.58%) TCP/IP
5 5 (0.48%) VPN
6 4 (0.38%) LAN
6 4 (0.38%) Network Security
6 4 (0.38%) Remote Desktop
6 4 (0.38%) WAN
7 3 (0.29%) AMQP
8 2 (0.19%) Asterisk PBX
8 2 (0.19%) FTP
8 2 (0.19%) Intranet
8 2 (0.19%) PBX
8 2 (0.19%) VoIP
8 2 (0.19%) Wireless
9 1 (0.096%) Kerberos
9 1 (0.096%) SSH
9 1 (0.096%) SSL
Database & Business Intelligence
1 377 (36.22%) RDBMS
2 350 (33.62%) SQL Server
3 193 (18.54%) MySQL
4 157 (15.08%) PostgreSQL
5 150 (14.41%) NoSQL
6 122 (11.72%) Power BI
7 105 (10.09%) Oracle Database
8 93 (8.93%) Big Data
9 86 (8.26%) Data Warehouse
10 85 (8.17%) Data Lake
11 67 (6.44%) Tableau
12 57 (5.48%) Looker
13 55 (5.28%) BigQuery
14 51 (4.90%) Bigtable
15 48 (4.61%) MongoDB
16 44 (4.23%) SQL Server Integration Services
17 29 (2.79%) Elasticsearch
18 27 (2.59%) SQL Server Reporting Services
19 22 (2.11%) Redis
20 19 (1.83%) Hadoop
Development Applications
1 243 (23.34%) Git
2 96 (9.22%) Jenkins
3 36 (3.46%) JDeveloper
3 36 (3.46%) JIRA
4 30 (2.88%) Jasmine
5 28 (2.69%) Visual Studio
6 26 (2.50%) Mockito
7 24 (2.31%) SQL Server Management Studio (SSMS)
8 23 (2.21%) JUnit
9 22 (2.11%) IntelliJ
10 20 (1.92%) Eclipse
10 20 (1.92%) Selenium
11 18 (1.73%) Team Foundation Server
12 15 (1.44%) Postman
13 14 (1.34%) Maven
14 10 (0.96%) TeamCity
15 7 (0.67%) Moq
15 7 (0.67%) Oracle Forms
16 6 (0.58%) Gradle
17 5 (0.48%) Cucumber
General
1 268 (25.74%) Social Skills
2 207 (19.88%) Finance
3 130 (12.49%) Analytical Skills
4 84 (8.07%) Games
5 80 (7.68%) Banking
6 64 (6.15%) Marketing
7 56 (5.38%) Public Sector
8 55 (5.28%) Police
9 48 (4.61%) Retail
10 45 (4.32%) Law
11 44 (4.23%) Inclusion and Diversity
12 36 (3.46%) Legal
13 19 (1.83%) Front Office
14 17 (1.63%) Documentation Skills
14 17 (1.63%) Presentation Skills
15 16 (1.54%) Local Government
16 14 (1.34%) Advertising
17 13 (1.25%) Financial Institution
17 13 (1.25%) Health Technology
18 11 (1.06%) Organisational Skills
Job Titles
1 378 (36.31%) Developer
2 173 (16.62%) Senior
3 146 (14.02%) Software Engineer
4 103 (9.89%) Senior Developer
5 102 (9.80%) Java Developer
6 87 (8.36%) Ruby Engineer
7 80 (7.68%) Architect
8 79 (7.59%) Lead
9 76 (7.30%) Data Engineer
10 68 (6.53%) DBA
11 65 (6.24%) Full Stack Developer
12 57 (5.48%) .NET Developer
13 53 (5.09%) Analyst
14 44 (4.23%) Software Developer
15 39 (3.75%) C# Developer
16 35 (3.36%) MySQL DBA
16 35 (3.36%) SQL Developer
17 32 (3.07%) Data Architect
18 29 (2.79%) Administrator
19 28 (2.69%) Solutions Architect
Libraries, Frameworks & Software Standards
1 215 (20.65%) React
2 172 (16.52%) Node.js
3 154 (14.79%) HTML
4 151 (14.51%) .NET
5 139 (13.35%) CSS
6 115 (11.05%) REST
7 104 (9.99%) AngularJS
8 103 (9.89%) Spring
9 101 (9.70%) Web Services
10 100 (9.61%) Kafka
11 97 (9.32%) RESTful
12 91 (8.74%) JSON
13 82 (7.88%) Spring Boot
14 72 (6.92%) XML
15 60 (5.76%) SOAP
16 58 (5.57%) .NET Framework
17 57 (5.48%) ASP.NET
18 47 (4.51%) .NET Core
19 45 (4.32%) RabbitMQ
20 31 (2.98%) jQuery
Miscellaneous
1 73 (7.01%) Swaptions
2 55 (5.28%) Virtual Team
3 43 (4.13%) Public Cloud
4 39 (3.75%) Data Structures
4 39 (3.75%) Distributed Systems
5 38 (3.65%) Management Information System
6 36 (3.46%) Self-Motivation
7 31 (2.98%) Product Ownership
8 26 (2.50%) Legacy Systems
8 26 (2.50%) Onboarding
9 22 (2.11%) Algorithms
10 19 (1.83%) Cloud Native
11 16 (1.54%) Enterprise Software
11 16 (1.54%) Fixed Income
11 16 (1.54%) Hybrid Cloud
12 14 (1.34%) Mobile App
13 13 (1.25%) Greenfield Project
14 12 (1.15%) Clustering
14 12 (1.15%) Data Centre
15 10 (0.96%) Derivative
Operating Systems
1 104 (9.99%) Linux
2 83 (7.97%) Windows
3 54 (5.19%) Unix
4 8 (0.77%) Windows Server
5 4 (0.38%) Android
5 4 (0.38%) Apple iOS
5 4 (0.38%) Debian
5 4 (0.38%) Ubuntu
5 4 (0.38%) Windows 10
5 4 (0.38%) Windows Server 2016
5 4 (0.38%) Windows Server 2019
6 2 (0.19%) CentOS
6 2 (0.19%) Solaris
6 2 (0.19%) VMS
7 1 (0.096%) AIX
7 1 (0.096%) Mac OS
Processes & Methodologies
1 404 (38.81%) Agile
2 301 (28.91%) Problem-Solving
3 254 (24.40%) DevOps
4 231 (22.19%) Software Engineering
5 228 (21.90%) Microservices
6 195 (18.73%) CI/CD
7 190 (18.25%) Unit Testing
8 174 (16.71%) Design Patterns
9 170 (16.33%) SDLC
10 167 (16.04%) Analytics
11 165 (15.85%) Containerisation
12 159 (15.27%) Business Intelligence
13 156 (14.99%) Data Modelling
14 149 (14.31%) ETL
15 142 (13.64%) Full Stack Development
16 139 (13.35%) Continuous Integration
17 128 (12.30%) Actionable Insight
18 113 (10.85%) Code Quality
19 109 (10.47%) Scrum
19 109 (10.47%) TDD
Programming Languages
1 409 (39.29%) Java
1 409 (39.29%) SQL
2 321 (30.84%) JavaScript
3 238 (22.86%) Python
4 177 (17.00%) C#
5 123 (11.82%) Perl
6 102 (9.80%) Go
7 95 (9.13%) Bash
8 91 (8.74%) Ruby
9 73 (7.01%) VB
10 72 (6.92%) T-SQL
11 46 (4.42%) TypeScript
12 34 (3.27%) Scala
13 31 (2.98%) C++
14 25 (2.40%) PHP
15 22 (2.11%) Shell Script
16 18 (1.73%) PL/SQL
17 17 (1.63%) C
17 17 (1.63%) PowerShell
18 12 (1.15%) VB.NET
Qualifications
1 152 (14.60%) Degree
2 150 (14.41%) Security Cleared
3 131 (12.58%) SC Cleared
4 55 (5.28%) Computer Science Degree
5 16 (1.54%) Azure Certification
6 15 (1.44%) Microsoft Certification
7 12 (1.15%) BPSS Clearance
7 12 (1.15%) Master's Degree
8 10 (0.96%) AWS Certification
9 5 (0.48%) CTC Cleared
9 5 (0.48%) MCSA
9 5 (0.48%) MCSE
10 4 (0.38%) MCP
11 3 (0.29%) HND
12 2 (0.19%) DV Cleared
12 2 (0.19%) IIBA
12 2 (0.19%) ISTQB
12 2 (0.19%) ITIL Foundation Certificate
12 2 (0.19%) Numerate Degree
13 1 (0.096%) CBAP
Quality Assurance & Compliance
1 154 (14.79%) QA
2 39 (3.75%) Data Quality
3 9 (0.86%) PMO
4 8 (0.77%) Accessibility
5 5 (0.48%) GDPR
5 5 (0.48%) PCI DSS
6 4 (0.38%) GxP
6 4 (0.38%) SLA
7 2 (0.19%) ISO 9001
7 2 (0.19%) ISO/IEC 27001
8 1 (0.096%) Actionable Recommendations
8 1 (0.096%) COREP
8 1 (0.096%) IFRS
8 1 (0.096%) IFRS 17
8 1 (0.096%) IFRS 9
8 1 (0.096%) Sarbanes-Oxley
8 1 (0.096%) SOC 1
8 1 (0.096%) Software Quality Assurance
8 1 (0.096%) WCAG
System Software
1 119 (11.43%) Docker
2 13 (1.25%) Hyper-V
3 11 (1.06%) Active Directory
4 4 (0.38%) FreeRADIUS
4 4 (0.38%) VMware Infrastructure
5 3 (0.29%) Virtual Machines
6 2 (0.19%) Kamailio
6 2 (0.19%) OpenSIPS
7 1 (0.096%) HDFS
7 1 (0.096%) Microsoft Virtual Server
7 1 (0.096%) Shibboleth
7 1 (0.096%) Virtual Servers
Systems Management
1 104 (9.99%) Kubernetes
2 80 (7.68%) Terraform
3 33 (3.17%) Ansible
4 14 (1.34%) Grafana
5 6 (0.58%) Failover Clustering
6 5 (0.48%) Prometheus
7 4 (0.38%) Kibana
7 4 (0.38%) Progress Chef
7 4 (0.38%) Puppet
7 4 (0.38%) Single Sign-On
8 3 (0.29%) Docker Swarm
9 2 (0.19%) HAProxy
9 2 (0.19%) Istio
9 2 (0.19%) Microsoft Clustering
9 2 (0.19%) Microsoft Intune
Vendors
1 286 (27.47%) Oracle
2 159 (15.27%) Microsoft
3 77 (7.40%) Google
4 75 (7.20%) Sybase
4 75 (7.20%) TIBCO
5 73 (7.01%) OpenLink
6 33 (3.17%) VMware
7 29 (2.79%) IBM
8 25 (2.40%) Databricks
9 24 (2.31%) ServiceNow
10 20 (1.92%) Remedy
11 17 (1.63%) BMC
11 17 (1.63%) HP
12 15 (1.44%) WSO2
13 14 (1.34%) Salesforce
13 14 (1.34%) Splunk
14 13 (1.25%) Bloomberg
14 13 (1.25%) MarketAxess
14 13 (1.25%) Tradeweb
14 13 (1.25%) Zoho