Organisational Skills
UK

The table below looks at the prevalence of the term Organisational Skills in permanent job vacancies. Included is a benchmarking guide to the salaries offered in vacancies that have cited Organisational Skills over the 6 months to 7 December 2023 with a comparison to the same period over the previous 2 years.

6 months to
7 Dec 2023
Same period 2022 Same period 2021
Rank 148 154 167
Rank change year-on-year +6 +13 +43
Permanent jobs citing Organisational Skills 1,204 2,905 2,956
As % of all permanent jobs advertised in the UK 2.27% 2.36% 2.31%
As % of the General category 3.46% 3.44% 3.85%
Number of salaries quoted 834 1,668 1,768
10th Percentile £25,750 £25,420 £25,500
25th Percentile £31,218 £34,211 £34,119
Median annual salary (50th Percentile) £45,000 £50,000 £48,500
Median % change year-on-year -10.00% +3.09% -7.62%
75th Percentile £60,000 £65,000 £65,000
90th Percentile £75,000 £82,500 £80,000
UK excluding London median annual salary £40,000 £42,500 £42,500
% change year-on-year -5.88% - -

All General Skills
UK

Organisational Skills is in the General Skills category. The following table is for comparison with the above and provides summary statistics for all permanent job vacancies with a requirement for common skills.

Permanent vacancies with a requirement for common skills 34,825 84,481 76,781
As % of all permanent jobs advertised in the UK 65.73% 68.77% 59.91%
Number of salaries quoted 24,374 48,187 48,005
10th Percentile £30,500 £32,500 £31,500
25th Percentile £42,500 £45,000 £42,250
Median annual salary (50th Percentile) £60,000 £60,000 £57,500
Median % change year-on-year - +4.35% +4.55%
75th Percentile £80,000 £82,500 £78,750
90th Percentile £100,000 £100,000 £97,500
UK excluding London median annual salary £50,000 £52,500 £49,250
% change year-on-year -4.76% +6.60% +3.68%

Organisational Skills
Job Vacancy Trend

Job postings citing Organisational Skills as a proportion of all IT jobs advertised.
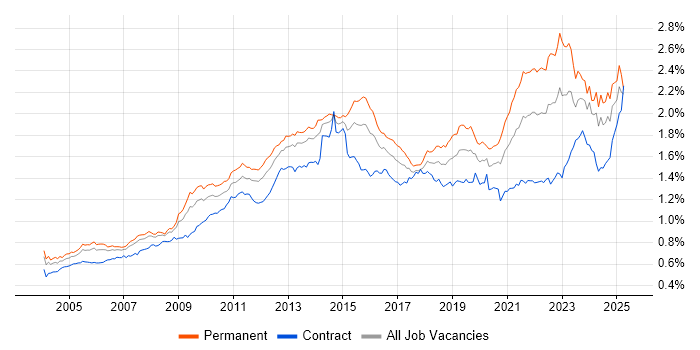
Job vacancy trend for Organisational Skills in the UK

Organisational Skills
Salary Trend

3-month moving average salary quoted in jobs citing Organisational Skills.

Salary trend for Organisational Skills in the UK

Organisational Skills
Salary Histogram

Salary distribution for jobs citing Organisational Skills over the 6 months to 7 December 2023.

Salary histogram for Organisational Skills in the UK

Organisational Skills
Top 17 Job Locations

The table below looks at the demand and provides a guide to the median salaries quoted in IT jobs citing Organisational Skills within the UK over the 6 months to 7 December 2023. The 'Rank Change' column provides an indication of the change in demand within each location based on the same 6 month period last year.

Location Rank Change
on Same Period
Last Year
Matching
Permanent
IT Job Ads
Median Salary
Past 6 Months
Median Salary
% Change
on Same Period
Last Year
Live
Jobs
England +2 1,085 £45,000 -9.09% 1,082
UK excluding London +4 810 £40,000 -5.88% 808
Work from Home -4 490 £50,000 -4.76% 377
London +24 359 £54,195 -9.68% 335
South East +11 223 £42,971 -4.51% 213
North of England -11 164 £35,000 -17.65% 200
Midlands +32 143 £40,000 -11.11% 125
South West -2 98 £33,250 -21.76% 97
East of England +34 97 £47,500 +46.15% 109
West Midlands +38 82 £55,000 +22.22% 84
Yorkshire -3 75 £39,000 -12.11% 75
North West +10 73 £40,000 -5.88% 105
East Midlands +15 61 £26,500 -29.33% 41
Scotland +21 58 £45,000 +7.14% 65
Northern Ireland +35 19 £32,500 -16.13% 14
North East +38 16 £28,000 -46.67% 22
Wales -4 16 £46,250 +23.33% 21

Organisational Skills
Co-occurring Skills and Capabilities by Category

The follow tables expand on the table above by listing co-occurrences grouped by category. The same employment type, locality and period is covered with up to 20 co-occurrences shown in each of the following categories:

Application Platforms
1 59 (4.90%) SharePoint
2 14 (1.16%) MS Exchange
3 5 (0.42%) IIS
4 4 (0.33%) CMS
4 4 (0.33%) Confluence
5 3 (0.25%) Exchange Server 2010
5 3 (0.25%) OpenStack
6 2 (0.17%) Apache
6 2 (0.17%) Exchange Server 2013
7 1 (0.083%) EPiServer
7 1 (0.083%) JBoss
7 1 (0.083%) Kentico
7 1 (0.083%) Moodle
7 1 (0.083%) nginx
7 1 (0.083%) Sitecore CMS
7 1 (0.083%) Umbraco
7 1 (0.083%) WordPress
Applications
1 176 (14.62%) Microsoft Office
2 118 (9.80%) Microsoft Excel
3 51 (4.24%) Microsoft PowerPoint
4 20 (1.66%) MS Visio
5 17 (1.41%) Microsoft Project
6 7 (0.58%) Spreadsheet
7 4 (0.33%) Adobe Creative Suite
8 2 (0.17%) Adobe Illustrator
8 2 (0.17%) InDesign
8 2 (0.17%) Photoshop
9 1 (0.083%) Adobe Captivate
9 1 (0.083%) Adobe Premiere
9 1 (0.083%) Adobe XD
9 1 (0.083%) Simulink
9 1 (0.083%) Sketch
9 1 (0.083%) Trello
Business Applications
1 10 (0.83%) Dynamics NAV
2 9 (0.75%) Dynamics CRM
3 8 (0.66%) ResourceLink
3 8 (0.66%) SAP QM
4 6 (0.50%) Dynamics AX
4 6 (0.50%) Sage 200
5 5 (0.42%) SystmOne
6 4 (0.33%) Remedy ITSM
7 2 (0.17%) iTrent
7 2 (0.17%) Misys Equation
7 2 (0.17%) NetSuite
7 2 (0.17%) SAP GTS
7 2 (0.17%) Sparx Enterprise Architect
8 1 (0.083%) Cognos Controller
8 1 (0.083%) IBM Planning Analytics
8 1 (0.083%) JDE EnterpriseOne
8 1 (0.083%) Oracle Financials
8 1 (0.083%) SAP CRM
8 1 (0.083%) SAP S/4HANA
8 1 (0.083%) Workfront
Cloud Services
1 165 (13.70%) Azure
2 141 (11.71%) Microsoft 365
3 75 (6.23%) SaaS
4 51 (4.24%) IaaS
5 50 (4.15%) Power Platform
6 49 (4.07%) PaaS
7 37 (3.07%) AWS
8 26 (2.16%) Dynamics 365
8 26 (2.16%) Entra ID
9 17 (1.41%) OneDrive
9 17 (1.41%) WhatsApp
10 13 (1.08%) Azure DevOps
10 13 (1.08%) Cloud Computing
11 10 (0.83%) GCP
11 10 (0.83%) Smartsheet
12 9 (0.75%) Google Workspace
13 7 (0.58%) Serverless
14 6 (0.50%) Asana
14 6 (0.50%) Azure Sentinel
15 5 (0.42%) Figma
Communications & Networking
1 70 (5.81%) SAN
2 64 (5.32%) Firewall
2 64 (5.32%) LAN
2 64 (5.32%) WAN
3 40 (3.32%) DNS
4 39 (3.24%) DHCP
5 32 (2.66%) Wireless
6 31 (2.57%) Internet
7 30 (2.49%) VPN
8 29 (2.41%) TCP/IP
9 26 (2.16%) Wi-Fi
10 23 (1.91%) SD-WAN
11 21 (1.74%) VLAN
12 20 (1.66%) 5G
13 19 (1.58%) WLAN
14 15 (1.25%) Intranet
15 13 (1.08%) OSPF
16 12 (1.00%) BGP
17 10 (0.83%) iSCSI
17 10 (0.83%) NAS
Database & Business Intelligence
1 104 (8.64%) Electronic Patient Records
2 36 (2.99%) Power BI
3 30 (2.49%) SQL Server
4 12 (1.00%) Data Warehouse
5 11 (0.91%) Relational Database
6 10 (0.83%) Tableau
7 9 (0.75%) NoSQL
8 7 (0.58%) MySQL
9 6 (0.50%) Data Lake
9 6 (0.50%) SQL Server Reporting Services
10 5 (0.42%) Amazon RDS
10 5 (0.42%) BusinessObjects
11 4 (0.33%) Elasticsearch
11 4 (0.33%) GIS
11 4 (0.33%) MongoDB
11 4 (0.33%) PostgreSQL
11 4 (0.33%) Power Query
11 4 (0.33%) SQL Server Analysis Services
11 4 (0.33%) SQL Server Integration Services
12 3 (0.25%) Metadata
Development Applications
1 25 (2.08%) Git
2 21 (1.74%) Jenkins
3 18 (1.50%) MSI
4 16 (1.33%) AdminStudio
4 16 (1.33%) InstallShield
4 16 (1.33%) JIRA
5 14 (1.16%) IBM UrbanCode
5 14 (1.16%) SonarQube
6 9 (0.75%) Visual Studio
7 5 (0.42%) Bitbucket
8 4 (0.33%) Atlassian Bamboo
9 3 (0.25%) ERwin
9 3 (0.25%) Selenium
10 2 (0.17%) Subversion
10 2 (0.17%) Vagrant
11 1 (0.083%) PowerDesigner
11 1 (0.083%) Ranorex
11 1 (0.083%) SpecFlow
11 1 (0.083%) TeamCity
11 1 (0.083%) WebDriver
General
1 771 (64.04%) Social Skills
2 344 (28.57%) Finance
3 185 (15.37%) Analytical Skills
4 122 (10.13%) Presentation Skills
5 100 (8.31%) Public Sector
6 68 (5.65%) Retail
7 66 (5.48%) Law
8 64 (5.32%) Marketing
9 61 (5.07%) Billing
10 52 (4.32%) Legal
11 42 (3.49%) Inclusion and Diversity
12 39 (3.24%) Manufacturing
13 38 (3.16%) Telecoms
14 35 (2.91%) Banking
15 32 (2.66%) Influencing Skills
16 20 (1.66%) Aerospace
17 16 (1.33%) Retail Banking
18 15 (1.25%) Advertising
19 14 (1.16%) Financial Institution
20 13 (1.08%) Documentation Skills
Job Titles
1 233 (19.35%) Analyst
2 117 (9.72%) Project Manager
3 112 (9.30%) Senior
4 68 (5.65%) Support Engineer
5 66 (5.48%) Architect
5 66 (5.48%) Lead
6 65 (5.40%) IT Manager
7 60 (4.98%) Billing Analyst
8 54 (4.49%) Infrastructure Architect
9 50 (4.15%) Field Engineer
10 47 (3.90%) Field Service Engineer
11 44 (3.65%) Developer
12 42 (3.49%) IT Support
13 36 (2.99%) Consultant
14 35 (2.91%) Administrator
15 32 (2.66%) Desktop Support
16 31 (2.57%) IT Engineer
17 30 (2.49%) Infrastructure Engineer
17 30 (2.49%) Infrastructure Manager
18 29 (2.41%) Infrastructure Project Manager
Libraries, Frameworks & Software Standards
1 26 (2.16%) .NET
2 25 (2.08%) CSS
2 25 (2.08%) HTML
3 23 (1.91%) AngularJS
4 21 (1.74%) Web Services
5 19 (1.58%) XML
6 18 (1.50%) REST
7 14 (1.16%) ASP.NET
8 13 (1.08%) Classic ASP
9 10 (0.83%) EDI
10 9 (0.75%) Vue
11 7 (0.58%) Node.js
12 6 (0.50%) React
13 5 (0.42%) jQuery
14 4 (0.33%) ADO
14 4 (0.33%) J2EE
14 4 (0.33%) JSON
14 4 (0.33%) Redux
14 4 (0.33%) Spring
15 3 (0.25%) Kafka
Miscellaneous
1 130 (10.80%) Self-Motivation
2 85 (7.06%) Driving Licence
3 80 (6.64%) Management Information System
4 57 (4.73%) Virtual Team
5 47 (3.90%) Private Cloud
6 45 (3.74%) Public Cloud
7 23 (1.91%) iPhone
8 20 (1.66%) Data Centre
9 16 (1.33%) EPoS
9 16 (1.33%) Shadow IT
10 15 (1.25%) GNSS
10 15 (1.25%) Robotics
11 14 (1.16%) Online Banking
12 11 (0.91%) Animation
12 11 (0.91%) Onboarding
12 11 (0.91%) Social Media
13 10 (0.83%) Security Operations Centre
14 9 (0.75%) Biopharmaceutical
14 9 (0.75%) Housing Association
14 9 (0.75%) Product Ownership
Operating Systems
1 281 (23.34%) Windows
2 93 (7.72%) Linux
2 93 (7.72%) Windows 10
3 54 (4.49%) Windows Server
4 40 (3.32%) Windows 7
5 33 (2.74%) Android
6 29 (2.41%) Windows Server 2016
7 18 (1.50%) Windows Server 2012
7 18 (1.50%) Windows Server 2019
8 7 (0.58%) Mac OS
9 6 (0.50%) Windows Server 2003
10 5 (0.42%) Windows 8
11 4 (0.33%) Apple iOS
11 4 (0.33%) Red Hat Enterprise Linux
11 4 (0.33%) Unix
11 4 (0.33%) Windows Vista
12 2 (0.17%) VMS
12 2 (0.17%) Windows Server 2008
13 1 (0.083%) CentOS
13 1 (0.083%) Ubuntu
Processes & Methodologies
1 294 (24.42%) Project Management
2 274 (22.76%) Problem-Solving
3 272 (22.59%) Project Delivery
4 263 (21.84%) Customer Service
5 245 (20.35%) Agile
6 212 (17.61%) Stakeholder Management
7 195 (16.20%) Time Management
8 179 (14.87%) Change Management
9 175 (14.53%) ITIL
10 133 (11.05%) People Management
11 116 (9.63%) Mentoring
12 112 (9.30%) Digital Transformation Programme
13 103 (8.55%) Waterfall
14 102 (8.47%) Actionable Insight
15 99 (8.22%) PRINCE2
16 96 (7.97%) Programme Governance
17 89 (7.39%) Service Delivery
18 76 (6.31%) Service Management
19 68 (5.65%) B2B
20 67 (5.56%) Infrastructure as Code
Programming Languages
1 77 (6.40%) SQL
2 52 (4.32%) Python
3 51 (4.24%) JavaScript
4 44 (3.65%) PowerShell
5 26 (2.16%) C#
5 26 (2.16%) Java
6 20 (1.66%) T-SQL
7 19 (1.58%) VB
8 15 (1.25%) Bash
9 13 (1.08%) Perl
10 12 (1.00%) TypeScript
11 10 (0.83%) C++
12 8 (0.66%) Ruby
13 6 (0.50%) R
13 6 (0.50%) VBA
14 5 (0.42%) PL/SQL
15 4 (0.33%) Kotlin
16 3 (0.25%) MATLAB
16 3 (0.25%) PHP
17 2 (0.17%) Rust
Qualifications
1 197 (16.36%) Degree
2 150 (12.46%) Security Cleared
3 124 (10.30%) SC Cleared
4 47 (3.90%) DV Cleared
5 35 (2.91%) ITIL Certification
6 30 (2.49%) Microsoft Certification
7 21 (1.74%) DBS Check
8 18 (1.50%) Cisco Certification
9 16 (1.33%) Computer Science Degree
10 13 (1.08%) PMI Certification
11 12 (1.00%) MCSE
12 11 (0.91%) CCNA
13 10 (0.83%) Azure Certification
13 10 (0.83%) CCNP
13 10 (0.83%) PMP
14 9 (0.75%) Master's Degree
15 7 (0.58%) APMP
16 6 (0.50%) CISSP
17 5 (0.42%) ISACA
17 5 (0.42%) ISTQB
Quality Assurance & Compliance
1 56 (4.65%) QA
2 48 (3.99%) PMO
3 45 (3.74%) SLA
4 25 (2.08%) ISO/IEC 27001
5 11 (0.91%) NIST
6 9 (0.75%) Accessibility
6 9 (0.75%) ISO/IEC 20000
7 8 (0.66%) Data Quality
8 5 (0.42%) COBIT
8 5 (0.42%) Cyber Essentials
9 4 (0.33%) Cyber Essentials PLUS
9 4 (0.33%) GDPR
10 3 (0.25%) GRC
10 3 (0.25%) PCI DSS
10 3 (0.25%) RMADS
11 2 (0.17%) NCSC
12 1 (0.083%) Actionable Recommendations
12 1 (0.083%) DICOM
12 1 (0.083%) GLP
12 1 (0.083%) HL7
System Software
1 134 (11.13%) Active Directory
2 52 (4.32%) VMware Infrastructure
3 32 (2.66%) Hyper-V
4 27 (2.24%) Docker
5 16 (1.33%) Microsoft App-V
6 12 (1.00%) Firmware
7 9 (0.75%) Terminal Server
7 9 (0.75%) Virtual Machines
7 9 (0.75%) Virtual Servers
7 9 (0.75%) VMware ESXi
8 8 (0.66%) KVM
8 8 (0.66%) Virtual Desktop
9 6 (0.50%) XenApp
9 6 (0.50%) XenDesktop
10 4 (0.33%) Microsoft Virtual Server
11 3 (0.25%) VirtualBox
12 1 (0.083%) Ceph
12 1 (0.083%) Citrix Hypervisor
12 1 (0.083%) NFS
12 1 (0.083%) vSphere
Systems Management
1 52 (4.32%) Terraform
2 51 (4.24%) SCCM
3 45 (3.74%) Ansible
4 27 (2.24%) Kubernetes
5 18 (1.50%) Microsoft Intune
6 17 (1.41%) WSUS
7 10 (0.83%) Puppet
8 8 (0.66%) FortiGate
8 8 (0.66%) vCenter Server
9 7 (0.58%) Microsoft Data Protection Manager
9 7 (0.58%) Nagios
10 5 (0.42%) Cacti
10 5 (0.42%) Icinga
11 4 (0.33%) Failover Clustering
11 4 (0.33%) VxRail
12 3 (0.25%) McAfee ePO
12 3 (0.25%) Oracle RMAN
12 3 (0.25%) Progress Chef
12 3 (0.25%) vRealize
13 2 (0.17%) Backup Exec
Vendors
1 300 (24.92%) Microsoft
2 66 (5.48%) Dell
3 62 (5.15%) ServiceNow
4 61 (5.07%) VMware
5 59 (4.90%) HP
6 51 (4.24%) Oracle
7 36 (2.99%) SAP
8 30 (2.49%) IBM
9 25 (2.08%) Cisco
10 23 (1.91%) Google
11 21 (1.74%) Salesforce
12 18 (1.50%) Autodesk
13 14 (1.16%) Meraki
13 14 (1.16%) Veracode
14 13 (1.08%) NetApp
15 12 (1.00%) Sage
16 11 (0.91%) Apple
16 11 (0.91%) Aruba
17 9 (0.75%) Citrix
17 9 (0.75%) Fortinet