Clustering
UK

The table below looks at the prevalence of the term Clustering in permanent job vacancies. Included is a benchmarking guide to the salaries offered in vacancies that have cited Clustering over the 6 months to 5 December 2023 with a comparison to the same period over the previous 2 years.

6 months to
5 Dec 2023
Same period 2022 Same period 2021
Rank 521 675 633
Rank change year-on-year +154 -42 -126
Permanent jobs citing Clustering 220 433 522
As % of all permanent jobs advertised in the UK 0.41% 0.35% 0.41%
As % of the Miscellaneous category 1.12% 0.81% 0.93%
Number of salaries quoted 209 302 422
10th Percentile £31,250 £41,250 £36,250
25th Percentile £38,250 £45,000 £42,500
Median annual salary (50th Percentile) £50,000 £52,500 £53,350
Median % change year-on-year -4.76% -1.59% +4.61%
75th Percentile £62,500 £62,500 £70,000
90th Percentile £74,000 £83,750 £87,500
UK excluding London median annual salary £47,500 £48,500 £50,000
% change year-on-year -2.06% -3.00% +5.26%

All Generic Skills
UK

Clustering is in the General and Transferable Skills category. The following table is for comparison with the above and provides summary statistics for all permanent job vacancies with a requirement for generic IT skills.

Permanent vacancies with a requirement for generic IT skills 19,682 53,728 56,126
As % of all permanent jobs advertised in the UK 36.84% 43.27% 44.07%
Number of salaries quoted 14,421 29,894 33,440
10th Percentile £33,210 £34,923 £33,750
25th Percentile £45,000 £46,250 £45,000
Median annual salary (50th Percentile) £62,500 £63,675 £60,000
Median % change year-on-year -1.85% +6.13% -
75th Percentile £84,056 £85,000 £82,500
90th Percentile £107,500 £105,000 £100,000
UK excluding London median annual salary £55,000 £55,000 £50,000
% change year-on-year - +10.00% -

Clustering
Job Vacancy Trend

Job postings citing Clustering as a proportion of all IT jobs advertised.
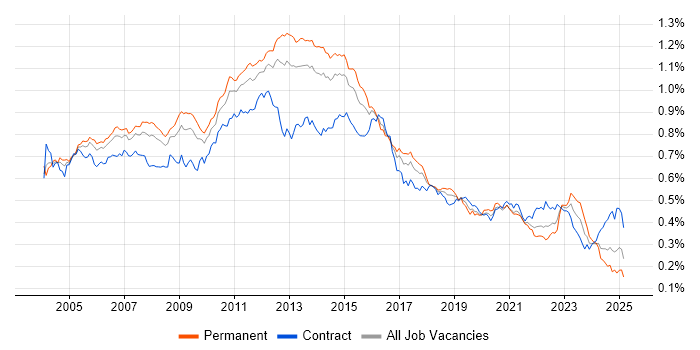
Job vacancy trend for Clustering in the UK

Clustering
Salary Trend

3-month moving average salary quoted in jobs citing Clustering.

Salary trend for Clustering in the UK

Clustering
Salary Histogram

Salary distribution for jobs citing Clustering over the 6 months to 5 December 2023.

Salary histogram for Clustering in the UK

Clustering
Top 16 Job Locations

The table below looks at the demand and provides a guide to the median salaries quoted in IT jobs citing Clustering within the UK over the 6 months to 5 December 2023. The 'Rank Change' column provides an indication of the change in demand within each location based on the same 6 month period last year.

Location Rank Change
on Same Period
Last Year
Matching
Permanent
IT Job Ads
Median Salary
Past 6 Months
Median Salary
% Change
on Same Period
Last Year
Live
Jobs
England +138 191 £51,500 -1.90% 88
UK excluding London +119 163 £47,500 -2.06% 62
Work from Home +108 62 £60,000 +9.09% 36
London +183 47 £70,000 +7.69% 37
Midlands +84 46 £50,000 +5.26% 14
West Midlands +102 40 £50,000 +5.26% 10
South East +131 36 £46,000 -12.38% 19
North of England +103 33 £34,500 -23.33% 12
Yorkshire +77 26 £34,500 -23.33% 4
Scotland +75 21 £32,500 -32.81% 5
South West +68 20 £51,000 -12.82% 7
East Midlands +24 6 £50,000 - 4
East of England +91 4 £43,500 -17.14% 6
North East +50 4 £60,000 +20.00% 2
North West +100 3 £52,500 -4.55% 6
Wales +19 3 £43,000 -11.34%

Clustering
Co-occurring Skills and Capabilities by Category

The follow tables expand on the table above by listing co-occurrences grouped by category. The same employment type, locality and period is covered with up to 20 co-occurrences shown in each of the following categories:

Application Platforms
1 45 (20.45%) IIS
2 16 (7.27%) SharePoint
3 9 (4.09%) MS Exchange
4 4 (1.82%) IBM HTTP Server
4 4 (1.82%) Oracle HTTP Server
4 4 (1.82%) WebSphere
4 4 (1.82%) WebSphere Application Server
5 1 (0.45%) Apache
5 1 (0.45%) Exchange Server 2010
5 1 (0.45%) OpenStack
5 1 (0.45%) Site Server
5 1 (0.45%) Tomcat
Applications
1 2 (0.91%) Microsoft Excel
Business Applications
1 5 (2.27%) Unit4 Business World
2 4 (1.82%) Oracle Cash Management
Cloud Services
1 129 (58.64%) Azure
2 67 (30.45%) Microsoft 365
3 45 (20.45%) AWS
4 24 (10.91%) Cloud Computing
5 16 (7.27%) IaaS
6 14 (6.36%) Entra ID
7 10 (4.55%) PaaS
8 8 (3.64%) Power Platform
9 6 (2.73%) Azure DevOps
10 5 (2.27%) Rubrik
11 4 (1.82%) Amazon S3
11 4 (1.82%) GCP
11 4 (1.82%) SaaS
12 3 (1.36%) Azure Storage
12 3 (1.36%) GitHub
12 3 (1.36%) OpenShift
13 2 (0.91%) Azure App Service
13 2 (0.91%) Snowflake
14 1 (0.45%) dbt
14 1 (0.45%) Fivetran
Communications & Networking
1 60 (27.27%) Firewall
2 56 (25.45%) WAN
3 41 (18.64%) DNS
4 37 (16.82%) DHCP
5 34 (15.45%) SAN
6 30 (13.64%) VPN
7 24 (10.91%) TCP/IP
8 21 (9.55%) Wireless
9 16 (7.27%) NAS
10 14 (6.36%) LAN
11 12 (5.45%) Skype
11 12 (5.45%) VLAN
12 9 (4.09%) Internet
13 8 (3.64%) iSCSI
14 6 (2.73%) Remote Desktop
15 4 (1.82%) HTTP
16 3 (1.36%) BGP
16 3 (1.36%) OSPF
16 3 (1.36%) SNMP
16 3 (1.36%) tcpdump
Database & Business Intelligence
1 85 (38.64%) SQL Server
2 24 (10.91%) NoSQL
3 21 (9.55%) Amazon RDS
3 21 (9.55%) SQL Server Integration Services
4 16 (7.27%) SQL Server Reporting Services
5 13 (5.91%) Data Warehouse
6 12 (5.45%) Relational Database
7 11 (5.00%) MySQL
8 10 (4.55%) Azure SQL Database
8 10 (4.55%) SQL Server Analysis Services
9 9 (4.09%) Oracle Database
10 8 (3.64%) PostgreSQL
10 8 (3.64%) Power BI
11 7 (3.18%) Oracle Database 12c
12 6 (2.73%) Data Mining
12 6 (2.73%) Elasticsearch
13 5 (2.27%) Hadoop
14 4 (1.82%) Big Data
14 4 (1.82%) MongoDB
15 3 (1.36%) RDBMS
Development Applications
1 3 (1.36%) Jenkins
1 3 (1.36%) SQL Server Management Studio (SSMS)
2 2 (0.91%) Git
3 1 (0.45%) Visual Studio Team System
General
1 50 (22.73%) Social Skills
2 48 (21.82%) Finance
3 16 (7.27%) Military
4 11 (5.00%) Analytical Skills
4 11 (5.00%) Retail
5 10 (4.55%) Law
6 7 (3.18%) Organisational Skills
7 6 (2.73%) Documentation Skills
8 5 (2.27%) Banking
9 4 (1.82%) Telecoms
10 3 (1.36%) Legal
11 1 (0.45%) Public Sector
11 1 (0.45%) Tech for Good
Job Titles
1 66 (30.00%) Infrastructure Engineer
2 56 (25.45%) Senior
3 43 (19.55%) DBA
4 40 (18.18%) Systems Engineer
5 34 (15.45%) SQL DBA
6 33 (15.00%) Administrator
7 27 (12.27%) IT Engineer
8 21 (9.55%) Wintel Engineer
9 18 (8.18%) Senior Infrastructure Engineer
10 15 (6.82%) Senior Systems Engineer
11 14 (6.36%) Senior Wintel Engineer
12 12 (5.45%) Linux Engineer
13 11 (5.00%) Support Engineer
14 10 (4.55%) Architect
14 10 (4.55%) IT Infrastructure Engineer
14 10 (4.55%) IT Support
14 10 (4.55%) Linux Infrastructure Engineer
14 10 (4.55%) Server Engineer
15 9 (4.09%) 3rd Line Engineer
15 9 (4.09%) Wintel Infrastructure Engineer
Libraries, Frameworks & Software Standards
1 22 (10.00%) REST
2 21 (9.55%) WebRTC
3 13 (5.91%) .NET
4 8 (3.64%) XML
5 7 (3.18%) Node.js
6 6 (2.73%) JSON
7 5 (2.27%) Web Services
7 5 (2.27%) WSH
8 4 (1.82%) J2EE
8 4 (1.82%) JDBC
8 4 (1.82%) JMS
8 4 (1.82%) JNDI
8 4 (1.82%) SOAP
8 4 (1.82%) YAML
9 2 (0.91%) Elastic Stack
9 2 (0.91%) PyTorch
9 2 (0.91%) TensorFlow
10 1 (0.45%) 802.1X
10 1 (0.45%) Pandas
10 1 (0.45%) scikit-learn
Miscellaneous
1 26 (11.82%) Replication
2 25 (11.36%) Public Cloud
3 23 (10.45%) Distributed Systems
4 22 (10.00%) PKI
5 20 (9.09%) Data Centre
6 16 (7.27%) Fat Client
6 16 (7.27%) Thin Client
7 10 (4.55%) NHS
8 5 (2.27%) Enterprise Software
8 5 (2.27%) FPGA
8 5 (2.27%) Management Information System
9 3 (1.36%) Legacy Systems
9 3 (1.36%) Private Cloud
9 3 (1.36%) SCADA
10 2 (0.91%) Driving Licence
10 2 (0.91%) Enterprise Storage
10 2 (0.91%) Hybrid Cloud
11 1 (0.45%) Augmented Reality
11 1 (0.45%) Cyber Threat
11 1 (0.45%) Linux Command Line
Operating Systems
1 109 (49.55%) Windows
2 82 (37.27%) Windows Server
3 48 (21.82%) Windows Server 2016
4 44 (20.00%) Windows Server 2012
5 42 (19.09%) Linux
6 29 (13.18%) Windows Server 2019
7 13 (5.91%) Unix
8 10 (4.55%) Red Hat Enterprise Linux
9 9 (4.09%) Windows Server 2003
10 7 (3.18%) Windows Server 2008
11 5 (2.27%) Windows 2000
12 3 (1.36%) SUSE
12 3 (1.36%) Windows XP
13 2 (0.91%) VMS
13 2 (0.91%) Windows 10
13 2 (0.91%) Windows 7
14 1 (0.45%) AIX
Processes & Methodologies
1 99 (45.00%) High Availability
2 85 (38.64%) Problem-Solving
3 80 (36.36%) Infrastructure Engineering
4 47 (21.36%) Disaster Recovery
5 39 (17.73%) Load Balancing
6 33 (15.00%) Capacity Planning
7 29 (13.18%) CI/CD
8 27 (12.27%) Prototyping
9 26 (11.82%) Performance Tuning
9 26 (11.82%) Software Testing
10 24 (10.91%) Database Mirroring
11 23 (10.45%) API Design
11 23 (10.45%) API Development
11 23 (10.45%) Continuous Delivery
11 23 (10.45%) Continuous Integration
11 23 (10.45%) ITIL
11 23 (10.45%) Performance Analysis
11 23 (10.45%) TDD
12 22 (10.00%) Validation
13 20 (9.09%) Patch Management
Programming Languages
1 117 (53.18%) SQL
2 55 (25.00%) PowerShell
3 23 (10.45%) Java
3 23 (10.45%) T-SQL
4 21 (9.55%) Python
5 13 (5.91%) C#
6 10 (4.55%) Bash
7 8 (3.64%) VBScript
8 7 (3.18%) C
8 7 (3.18%) Go
9 6 (2.73%) C++
10 5 (2.27%) Perl
11 3 (1.36%) Bicep
11 3 (1.36%) PL/SQL
11 3 (1.36%) VB
12 1 (0.45%) Fortran
12 1 (0.45%) JavaScript
12 1 (0.45%) Korn
12 1 (0.45%) R
12 1 (0.45%) Rust
Qualifications
1 71 (32.27%) Security Cleared
2 49 (22.27%) SC Cleared
3 36 (16.36%) Degree
4 20 (9.09%) DV Cleared
5 19 (8.64%) Azure Certification
6 9 (4.09%) Microsoft Certification
7 5 (2.27%) BPSS Clearance
7 5 (2.27%) Computer Science Degree
8 4 (1.82%) MCSA
9 3 (1.36%) MCSE
9 3 (1.36%) VMware Certified Professional (VCP)
10 2 (0.91%) CCNP
10 2 (0.91%) Cisco Certification
10 2 (0.91%) ITIL Foundation Certificate
10 2 (0.91%) Master's Degree
11 1 (0.45%) CCNA
11 1 (0.45%) DBS Check
11 1 (0.45%) MCDBA
11 1 (0.45%) MCITP
11 1 (0.45%) MCT
Quality Assurance & Compliance
1 20 (9.09%) SLA
2 6 (2.73%) Accessibility
3 5 (2.27%) Disclosure Scotland
4 3 (1.36%) GDPR
4 3 (1.36%) ISO/IEC 27001
5 2 (0.91%) Cyber Essentials
5 2 (0.91%) Cyber Essentials PLUS
6 1 (0.45%) Data Quality
6 1 (0.45%) NIST
6 1 (0.45%) QA
System Software
1 95 (43.18%) Active Directory
2 74 (33.64%) VMware Infrastructure
3 60 (27.27%) Hyper-V
4 43 (19.55%) VMware NSX
5 28 (12.73%) vSphere
6 21 (9.55%) Firmware
7 17 (7.73%) Virtual Machines
8 15 (6.82%) VMware ESXi
9 10 (4.55%) Terminal Services
10 7 (3.18%) Docker
11 4 (1.82%) Oracle RAC
11 4 (1.82%) Squid
11 4 (1.82%) XenApp
12 3 (1.36%) KVM
13 2 (0.91%) Microsoft Virtual Server
13 2 (0.91%) Virtual Servers
14 1 (0.45%) PowerHA
Systems Management
1 62 (28.18%) Failover Clustering
2 52 (23.64%) Microsoft Clustering
3 32 (14.55%) Microsoft Data Protection Manager
4 30 (13.64%) FortiGate
5 27 (12.27%) Microsoft Intune
6 19 (8.64%) SCOM
7 18 (8.18%) Puppet
8 17 (7.73%) Active Directory Federation Services
8 17 (7.73%) SCCM
9 11 (5.00%) vCenter Server
10 10 (4.55%) Red Hat Satellite
10 10 (4.55%) Tivoli
10 10 (4.55%) Tivoli Storage Manager
11 9 (4.09%) Ansible
12 8 (3.64%) Oracle RMAN
12 8 (3.64%) Terraform
13 6 (2.73%) Kubernetes
13 6 (2.73%) Nagios
14 5 (2.27%) McAfee ePO
14 5 (2.27%) Single Sign-On
Vendors
1 151 (68.64%) Microsoft
2 128 (58.18%) VMware
3 26 (11.82%) Citrix
4 21 (9.55%) Cisco
5 17 (7.73%) CheckPoint
5 17 (7.73%) Commvault
5 17 (7.73%) Veeam
6 16 (7.27%) Veritas
7 14 (6.36%) Aruba
7 14 (6.36%) Barracuda Networks
7 14 (6.36%) Kaseya
7 14 (6.36%) Oracle
8 10 (4.55%) IBM
8 10 (4.55%) Red Hat
8 10 (4.55%) SonicWALL
9 8 (3.64%) HP
10 6 (2.73%) 3PAR
10 6 (2.73%) Nimble Storage
11 5 (2.27%) RedGate
11 5 (2.27%) SolarWinds