IBM
UK

The table below provides summary statistics for permanent job vacancies requiring knowledge or experience of IBM products and/or services. It includes a benchmarking guide to the annual salaries offered in vacancies that cited IBM over the 6 months leading up to 30 April 2025, comparing them to the same period in the previous two years.

The figures below represent the IT labour market in general and are not representative of salaries within the International Business Machines Corporation.

6 months to
30 Apr 2025
Same period 2024 Same period 2023
Rank 175 283 376
Rank change year-on-year +108 +93 +37
Permanent jobs citing IBM 905 1,008 920
As % of all permanent jobs advertised in the UK 1.74% 1.02% 0.88%
As % of the Vendors category 4.72% 2.77% 2.12%
Number of salaries quoted 603 476 410
10th Percentile £37,574 £35,000 £33,400
25th Percentile £45,000 £45,188 £46,454
Median annual salary (50th Percentile) £62,000 £60,000 £60,000
Median % change year-on-year +3.33% - -2.76%
75th Percentile £70,600 £73,914 £75,000
90th Percentile £72,500 £85,000 £87,500
UK excluding London median annual salary £62,000 £55,000 £54,882
% change year-on-year +12.73% +0.22% -0.21%

All Vendors
UK

IBM falls under the Vendor Products and Services category. For comparison with the information above, the following table provides summary statistics for all permanent job vacancies requiring knowledge or experience of all vendor products and services.

Permanent vacancies with a requirement for knowledge or experience of vendor products and services 19,185 36,439 43,331
As % of all permanent jobs advertised in the UK 36.78% 37.05% 41.66%
Number of salaries quoted 11,735 25,145 24,687
10th Percentile £27,000 £26,700 £31,000
25th Percentile £37,574 £36,000 £41,250
Median annual salary (50th Percentile) £55,000 £50,000 £57,500
Median % change year-on-year +10.00% -13.04% +4.55%
75th Percentile £70,600 £68,750 £76,250
90th Percentile £90,000 £87,500 £92,500
UK excluding London median annual salary £50,000 £45,000 £50,000
% change year-on-year +11.11% -10.00% +5.26%

IBM
Job Vacancy Trend

Job postings citing IBM as a proportion of all IT jobs advertised.
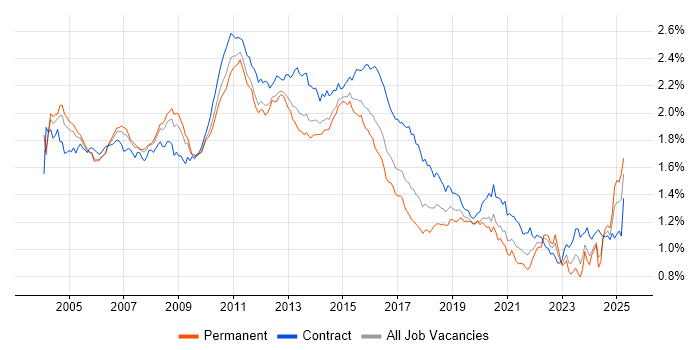
Job vacancy trend for IBM in the UK

IBM
Salary Trend

3-month moving average salary quoted in jobs citing IBM.

Salary trend for IBM in the UK

IBM
Salary Histogram

Salary distribution for jobs citing IBM over the 6 months to 30 April 2025.

Salary histogram for IBM in the UK

IBM
Top 16 Job Locations

The table below looks at the demand and provides a guide to the median salaries quoted in IT jobs citing IBM within the UK over the 6 months to 30 April 2025. The 'Rank Change' column provides an indication of the change in demand within each location based on the same 6 month period last year.

Location Rank Change
on Same Period
Last Year
Matching
Permanent
IT Job Ads
Median Salary
Past 6 Months
Median Salary
% Change
on Same Period
Last Year
Live
Jobs
UK excluding London +116 796 £62,000 +12.73% 180
England +85 789 £62,000 +8.77% 261
South East +145 404 £65,000 +18.18% 53
Work from Home +152 298 £70,600 +12.96% 124
South West +137 116 £45,000 -10.00% 30
North of England -52 96 £44,750 -31.15% 27
London +32 93 £76,000 +16.92% 99
Midlands 0 60 £60,000 +33.33% 38
Wales +77 57 £62,000 +14.74%
Yorkshire +64 53 £42,550 -36.17% 12
Scotland +147 43 £40,101 -47.01% 18
North West -96 43 £44,750 -31.15% 15
East Midlands +10 36 £50,050 +11.22% 27
West Midlands +27 24 £60,000 +33.33% 11
East of England +29 20 £40,101 -23.62% 14
Northern Ireland +30 1 £50,000 +78.57% 4

IBM
Co-occurring Skills and Capabilities by Category

The follow tables expand on the table above by listing co-occurrences grouped by category. The same employment type, locality and period is covered with up to 20 co-occurrences shown in each of the following categories:

Application Platforms
1 10 (1.10%) nginx
2 9 (0.99%) CICS
3 8 (0.88%) Apache
3 8 (0.88%) Camunda
3 8 (0.88%) Confluence
4 7 (0.77%) Oracle SOA Suite
5 6 (0.66%) Tomcat
6 5 (0.55%) NetWeaver
7 4 (0.44%) Apache Airflow
7 4 (0.44%) IBM Domino
8 2 (0.22%) Microsoft Exchange
8 2 (0.22%) SAS
9 1 (0.11%) IIS
9 1 (0.11%) Oracle HTTP Server
9 1 (0.11%) SharePoint
9 1 (0.11%) WebLogic
Applications
1 145 (16.02%) Simulink
2 8 (0.88%) Microsoft Office
3 4 (0.44%) Microsoft Excel
4 2 (0.22%) Microsoft PowerPoint
Business Applications
1 145 (16.02%) Teamcenter
2 13 (1.44%) Postilion
3 12 (1.33%) IBM Planning Analytics
3 12 (1.33%) PeopleSoft HCM
4 8 (0.88%) Oracle EBS
4 8 (0.88%) Oracle SCM
5 6 (0.66%) Oracle Procure-to-Pay
6 5 (0.55%) Oracle Subledger Accounting
7 4 (0.44%) Maximo
7 4 (0.44%) SAP S/4HANA
8 2 (0.22%) Infor SunSystems
8 2 (0.22%) SAP Oil and Gas
9 1 (0.11%) Dynamics CRM
Cloud Services
1 110 (12.15%) Azure
2 96 (10.61%) AWS
3 67 (7.40%) IBM Cloud
4 39 (4.31%) SaaS
5 28 (3.09%) Power Platform
6 26 (2.87%) OCI
7 24 (2.65%) PaaS
8 23 (2.54%) Amazon S3
9 22 (2.43%) Amazon EKS
10 21 (2.32%) Azure DevOps
10 21 (2.32%) Serverless
11 19 (2.10%) AWS Lambda
12 18 (1.99%) Amazon EC2
13 14 (1.55%) Datadog
13 14 (1.55%) GCP
14 10 (1.10%) GitHub
14 10 (1.10%) OpenShift
15 9 (0.99%) IBM Watson
15 9 (0.99%) Microsoft 365
15 9 (0.99%) Microsoft Purview
Communications & Networking
1 13 (1.44%) ATM
2 8 (0.88%) SAN
3 7 (0.77%) DNS
3 7 (0.77%) Firewall
4 6 (0.66%) FTP
4 6 (0.66%) Multicast
4 6 (0.66%) TCP/IP
5 4 (0.44%) VPN
6 3 (0.33%) HTTP
6 3 (0.33%) HTTPS
6 3 (0.33%) LAN
6 3 (0.33%) PuTTY
6 3 (0.33%) SSH
6 3 (0.33%) VSAN
7 2 (0.22%) DHCP
7 2 (0.22%) Reverse Proxy
7 2 (0.22%) SNA
7 2 (0.22%) SSL
7 2 (0.22%) WAN
7 2 (0.22%) Wireless
Database & Business Intelligence
1 32 (3.54%) DB2
2 31 (3.43%) SQL Server
3 28 (3.09%) Power BI
4 26 (2.87%) NoSQL
5 18 (1.99%) MongoDB
6 13 (1.44%) Tableau
7 12 (1.33%) Oracle Reports
8 10 (1.10%) Oracle Database
8 10 (1.10%) QlikView
9 9 (0.99%) BusinessObjects
9 9 (0.99%) IBM InfoSphere
9 9 (0.99%) Metadata
9 9 (0.99%) SAP HANA
10 7 (0.77%) Oracle ODI
11 5 (0.55%) Amazon RDS
11 5 (0.55%) PostgreSQL
11 5 (0.55%) Relational Database
11 5 (0.55%) SAP BW
11 5 (0.55%) SAP Data Services
12 4 (0.44%) SQL Server Reporting Services
Development Applications
1 533 (58.90%) Rational DOORS
2 60 (6.63%) JIRA
3 48 (5.30%) Git
4 39 (4.31%) JUnit
5 38 (4.20%) IntelliJ
6 36 (3.98%) Jenkins
6 36 (3.98%) Mockito
7 29 (3.20%) Maven
8 22 (2.43%) Eclipse
8 22 (2.43%) Jasmine
8 22 (2.43%) Karma Test Runner
8 22 (2.43%) Protractor
9 20 (2.21%) GitLab
10 19 (2.10%) Cucumber
11 11 (1.22%) Oracle Forms
12 7 (0.77%) SonarQube
13 6 (0.66%) JDeveloper
14 5 (0.55%) TeamCity
15 4 (0.44%) Artifactory
15 4 (0.44%) Octopus Deploy
General
1 418 (46.19%) Electronics
2 256 (28.29%) Social Skills
3 147 (16.24%) Aerospace
4 130 (14.36%) Finance
5 71 (7.85%) Banking
6 69 (7.62%) Public Sector
7 66 (7.29%) Inclusion and Diversity
8 30 (3.31%) Law
9 26 (2.87%) Analytical Skills
10 20 (2.21%) Legal
11 15 (1.66%) Retail
12 11 (1.22%) Marketing
13 10 (1.10%) Manufacturing
13 10 (1.10%) Telecoms
14 7 (0.77%) Presentation Skills
15 5 (0.55%) Automotive
15 5 (0.55%) General Ledger
15 5 (0.55%) Investment Banking
16 4 (0.44%) Influencing Skills
17 3 (0.33%) Front Office
Job Titles
1 422 (46.63%) Systems Engineer
2 213 (23.54%) Senior
3 203 (22.43%) Principal Engineer
3 203 (22.43%) Principal Systems Engineer
4 145 (16.02%) Junior
4 145 (16.02%) Junior Systems Engineer
5 130 (14.36%) Senior Systems Engineer
6 107 (11.82%) Architect
7 62 (6.85%) Developer
8 56 (6.19%) Systems Architect
9 50 (5.52%) Lead
10 40 (4.42%) Java Developer
11 35 (3.87%) Solutions Architect
12 34 (3.76%) Senior DevOps
13 32 (3.54%) DevOps Engineer
14 25 (2.76%) Consultant
15 24 (2.65%) AWS DevOps
16 20 (2.21%) Senior Developer
17 19 (2.10%) Oracle Consultant
17 19 (2.10%) SaaS Developer
Libraries, Frameworks & Software Standards
1 37 (4.09%) React
2 34 (3.76%) AngularJS
3 27 (2.98%) RabbitMQ
4 23 (2.54%) Hibernate
4 23 (2.54%) JPA
5 18 (1.99%) Spring
5 18 (1.99%) Spring Boot
6 17 (1.88%) JMS
7 16 (1.77%) JSON
8 14 (1.55%) ActiveMQ
9 13 (1.44%) REST
9 13 (1.44%) SOAP
9 13 (1.44%) Web Services
9 13 (1.44%) XML
10 8 (0.88%) .NET
10 8 (0.88%) IBM Integration Bus
10 8 (0.88%) KeystoneJS
10 8 (0.88%) Node.js
10 8 (0.88%) Swagger
11 7 (0.77%) Middleware
Miscellaneous
1 293 (32.38%) Algorithms
2 90 (9.94%) Hybrid Cloud
3 84 (9.28%) Management Information System
4 64 (7.07%) Blockchain
5 53 (5.86%) e-Learning
6 31 (3.43%) Mainframe
7 20 (2.21%) Enterprise Software
8 18 (1.99%) IBM Mainframe
9 17 (1.88%) Hackathon
9 17 (1.88%) Learning Management System
9 17 (1.88%) Mobile App
10 14 (1.55%) Credit Derivative
11 10 (1.10%) Product Ownership
11 10 (1.10%) Replication
11 10 (1.10%) Self-Motivation
12 9 (0.99%) Cloud Native
12 9 (0.99%) Data Centre
12 9 (0.99%) Robotics
12 9 (0.99%) Virtual Team
13 7 (0.77%) DataPower
Operating Systems
1 73 (8.07%) Linux
2 34 (3.76%) zOS
3 21 (2.32%) Windows
4 11 (1.22%) Unix
4 11 (1.22%) Windows Server
5 10 (1.10%) AIX
6 9 (0.99%) Red Hat Enterprise Linux
7 7 (0.77%) Android
7 7 (0.77%) Apple iOS
8 6 (0.66%) Windows 10
8 6 (0.66%) Windows Server 2012
8 6 (0.66%) Windows Server 2016
8 6 (0.66%) Windows Server 2019
9 2 (0.22%) CentOS
9 2 (0.22%) Oracle Linux
10 1 (0.11%) SUSE
10 1 (0.11%) Ubuntu
Processes & Methodologies
1 532 (58.78%) Systems Engineering
2 301 (33.26%) Technical Leadership
3 270 (29.83%) Signal Processing
4 249 (27.51%) Mentoring
5 206 (22.76%) Problem-Solving
6 192 (21.22%) Model-Based Systems Engineering
7 173 (19.12%) Continuous Improvement
8 166 (18.34%) PLM
9 155 (17.13%) UML
10 153 (16.91%) Project Management
11 147 (16.24%) Mathematics
11 147 (16.24%) Stakeholder Engagement
12 146 (16.13%) Computer Science
13 145 (16.02%) Creative Problem-Solving
13 145 (16.02%) Physics
13 145 (16.02%) SysML
14 144 (15.91%) Test Planning
15 140 (15.47%) Agile
16 115 (12.71%) DevOps
17 109 (12.04%) Artificial Intelligence
Programming Languages
1 145 (16.02%) MATLAB
2 127 (14.03%) R
3 108 (11.93%) Java
4 63 (6.96%) SQL
5 52 (5.75%) Python
6 33 (3.65%) JavaScript
7 24 (2.65%) C#
8 19 (2.10%) C++
9 17 (1.88%) Kotlin
10 12 (1.33%) JCL
11 10 (1.10%) C
12 9 (0.99%) COBOL
13 8 (0.88%) Lua
14 7 (0.77%) Groovy
15 6 (0.66%) Perl
15 6 (0.66%) PL/SQL
16 5 (0.55%) Bash
16 5 (0.55%) RPG
16 5 (0.55%) RPG IV
16 5 (0.55%) Shell Script
Qualifications
1 472 (52.15%) BPSS Clearance
2 243 (26.85%) Degree
3 115 (12.71%) Chartered Engineer
4 44 (4.86%) Security Cleared
5 19 (2.10%) Master's Degree
6 18 (1.99%) PhD
7 5 (0.55%) SC Cleared
8 4 (0.44%) ACCA
8 4 (0.44%) AWS Certification
8 4 (0.44%) CIMA
9 3 (0.33%) AWS Certified Solutions Architect
9 3 (0.33%) DV Cleared
9 3 (0.33%) OCP
9 3 (0.33%) Oracle Certification
10 2 (0.22%) Azure Certification
11 1 (0.11%) Computer Science Degree
11 1 (0.11%) ITIL Certification
Quality Assurance & Compliance
1 326 (36.02%) ISO/IEC 15288
2 10 (1.10%) Accessibility
2 10 (1.10%) Data Quality
2 10 (1.10%) GDPR
3 8 (0.88%) ISO/IEC 27001
3 8 (0.88%) SLA
4 7 (0.77%) QA
4 7 (0.77%) Sarbanes-Oxley
5 4 (0.44%) SOC 2
6 2 (0.22%) Automotive SPICE
6 2 (0.22%) Cyber Essentials
6 2 (0.22%) ISO 26262
7 1 (0.11%) ISO 15022
7 1 (0.11%) ISO 20022
7 1 (0.11%) NCSC
7 1 (0.11%) NIST
System Software
1 41 (4.53%) Docker
2 13 (1.44%) Active Directory
3 10 (1.10%) Hyper-V
4 6 (0.66%) VMware Infrastructure
5 4 (0.44%) Time Sharing Option
6 3 (0.33%) PowerHA
6 3 (0.33%) VMware ESXi
7 2 (0.22%) Job Entry Subsystem
7 2 (0.22%) KVM
7 2 (0.22%) Postfix
7 2 (0.22%) Sendmail
8 1 (0.11%) ACF2
8 1 (0.11%) EMC RecoverPoint
8 1 (0.11%) NFS
8 1 (0.11%) RACF
8 1 (0.11%) VMware NSX
Systems Management
1 35 (3.87%) Ansible
2 33 (3.65%) Terraform
3 14 (1.55%) Kubernetes
4 7 (0.77%) Prometheus
4 7 (0.77%) Tivoli Storage Manager
5 6 (0.66%) Nagios
6 5 (0.55%) Grafana
7 4 (0.44%) CA Endevor
7 4 (0.44%) Graylog
7 4 (0.44%) Nessus
7 4 (0.44%) Opsgenie
7 4 (0.44%) Packer
8 3 (0.33%) Argo
8 3 (0.33%) Istio
8 3 (0.33%) Progress Chef
8 3 (0.33%) vCenter Server
9 2 (0.22%) MAINVIEW
9 2 (0.22%) NetBackup
9 2 (0.22%) QRadar
9 2 (0.22%) Tivoli NetView
Vendors
1 85 (9.39%) Oracle
2 81 (8.95%) Red Hat
3 78 (8.62%) Microsoft
4 39 (4.31%) SAP
5 26 (2.87%) Google
6 20 (2.21%) Cisco
7 12 (1.33%) PeopleSoft
8 11 (1.22%) Databricks
9 10 (1.10%) Salesforce
10 9 (0.99%) Informatica
10 9 (0.99%) VMware
11 8 (0.88%) ServiceNow
12 7 (0.77%) Atlassian
12 7 (0.77%) Dell
12 7 (0.77%) Dynatrace
12 7 (0.77%) IBM Sterling
13 6 (0.66%) Apple
13 6 (0.66%) Cognos
13 6 (0.66%) SolarWinds
13 6 (0.66%) Veeam