Infrastructure Engineer Jobs

Infrastructure Engineer
UK

The median Infrastructure Engineer salary in the UK is £52,500 per year according to job vacancies posted during the 6 months to 29 November 2023.

The first table below provides salary benchmarking and summary statistics including a comparison to same period in the previous 2 years.

6 months to
29 Nov 2023
Same period 2022 Same period 2021
Rank 130 223 261
Rank change year-on-year +93 +38 -86
Permanent jobs requiring an Infrastructure Engineer 1,395 2,149 1,845
As % of all permanent jobs advertised in the UK 2.58% 1.71% 1.43%
As % of the Job Titles category 2.70% 1.79% 1.50%
Number of salaries quoted 1,091 1,710 1,636
10th Percentile £36,250 £35,922 £34,000
25th Percentile £42,500 £41,250 £37,688
Median annual salary (50th Percentile) £52,500 £50,000 £47,500
Median % change year-on-year +5.00% +5.26% +2.70%
75th Percentile £63,750 £60,000 £57,625
90th Percentile £76,250 £72,647 £68,750
UK excluding London median annual salary £47,500 £45,000 £45,000
% change year-on-year +5.56% - +3.45%

All Permanent IT Job Vacancies
UK

The following table is for comparison with the above and includes summary statistics for all permanent IT job vacancies. Most job vacancies include a discernible job title that can be normalized. As such, the figures in the second row provide an indication of the number of permanent jobs in our overall sample.

Permanent vacancies in the UK with a recognized job title 51,668 119,945 122,710
% of permanent jobs with a recognized job title 95.49% 95.32% 95.07%
Number of salaries quoted 37,837 75,409 83,805
10th Percentile £31,250 £32,750 £32,000
25th Percentile £42,500 £45,000 £42,500
Median annual salary (50th Percentile) £60,000 £60,000 £57,500
Median % change year-on-year - +4.35% +4.55%
75th Percentile £80,000 £81,250 £77,500
90th Percentile £97,500 £97,750 £95,000
UK excluding London median annual salary £52,500 £52,500 £50,000
% change year-on-year - +5.00% +5.26%

Infrastructure Engineer
Job Vacancy Trend

Job postings that featured Infrastructure Engineer in the job title as a proportion of all IT jobs advertised.
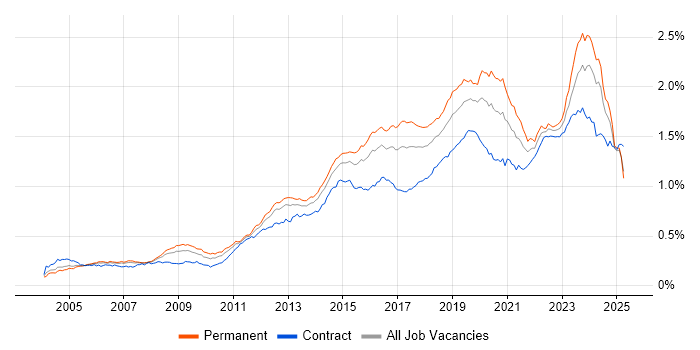
Job vacancy trend for Infrastructure Engineer in the UK

Infrastructure Engineer
Salary Trend

3-month moving average salary quoted in jobs citing Infrastructure Engineer.

Salary trend for Infrastructure Engineer in the UK

Infrastructure Engineer
Salary Histogram

Salary distribution for jobs citing Infrastructure Engineer over the 6 months to 29 November 2023.

Salary histogram for Infrastructure Engineer in the UK

Infrastructure Engineer
Top 17 Job Locations

The table below looks at the demand and provides a guide to the median salaries quoted in IT jobs citing Infrastructure Engineer within the UK over the 6 months to 29 November 2023. The 'Rank Change' column provides an indication of the change in demand within each location based on the same 6 month period last year.

Location Rank Change
on Same Period
Last Year
Matching
Permanent
IT Job Ads
Median Salary
Past 6 Months
Median Salary
% Change
on Same Period
Last Year
Live
Jobs
England +89 1,266 £52,500 +1.80% 396
UK excluding London +68 987 £47,500 +5.56% 347
Work from Home +51 505 £52,500 +1.98% 188
London +114 357 £65,000 +8.33% 86
South East +90 276 £50,000 - 67
South West +69 219 £50,000 +11.11% 52
Midlands +44 184 £47,500 +5.56% 72
North of England +7 168 £45,000 - 103
West Midlands +48 131 £45,000 - 42
Yorkshire +51 81 £42,500 -5.56% 40
North West +7 75 £47,500 +3.26% 55
Scotland +52 57 £52,000 +9.47% 17
East Midlands +22 53 £52,500 +5.00% 30
East of England +60 46 £52,500 - 28
Wales +5 23 £42,500 +8.08% 10
Northern Ireland +16 17 £47,500 +20.80% 7
North East +20 13 £47,500 +20.80% 11

Infrastructure Engineer Skill Set
Top 30 Co-occurring Skills and Capabilities

For the 6 months to 29 November 2023, Infrastructure Engineer job roles required the following skills and capabilities in order of popularity. The figures indicate the absolute number co-occurrences and as a proportion of all permanent job ads featuring Infrastructure Engineer in the job title.

1 1,367 (97.99%) Infrastructure Engineering
2 873 (62.58%) Windows
3 831 (59.57%) Azure
4 702 (50.32%) VMware
5 656 (47.03%) Active Directory
6 633 (45.38%) Microsoft
7 544 (39.00%) Windows Server
8 513 (36.77%) Microsoft 365
9 487 (34.91%) VMware Infrastructure
10 467 (33.48%) PowerShell
11 377 (27.03%) AWS
12 376 (26.95%) DNS
13 374 (26.81%) Linux
14 328 (23.51%) DHCP
15 307 (22.01%) Firewall
16 278 (19.93%) Security Cleared
17 276 (19.78%) Hyper-V
18 263 (18.85%) Problem-Solving
19 261 (18.71%) Cisco
20 249 (17.85%) Ansible
21 246 (17.63%) Python
22 240 (17.20%) Degree
23 233 (16.70%) ITIL
24 232 (16.63%) Social Skills
25 211 (15.13%) WAN
26 204 (14.62%) TCP/IP
27 185 (13.26%) SQL
27 185 (13.26%) SQL Server
28 181 (12.97%) Finance
29 174 (12.47%) Puppet

Infrastructure Engineer Skill Set
Co-occurring Skills and Capabilities by Category

The follow tables expand on the table above by listing co-occurrences grouped by category. The same employment type, locality and period is covered with up to 20 co-occurrences shown in each of the following categories:

Application Platforms
1 114 (8.17%) SharePoint
2 105 (7.53%) MS Exchange
3 44 (3.15%) IIS
4 25 (1.79%) Apache
5 7 (0.50%) Tomcat
5 7 (0.50%) WebSphere
6 5 (0.36%) nginx
7 4 (0.29%) Exchange Server 2010
7 4 (0.29%) Skype for Business
7 4 (0.29%) WebLogic
8 3 (0.22%) Apache Spark
8 3 (0.22%) Exchange Server 2003
8 3 (0.22%) Exchange Server 2013
8 3 (0.22%) OpenStack
9 2 (0.14%) Confluence
9 2 (0.14%) JBoss
9 2 (0.14%) Oracle Workflow
10 1 (0.072%) Exchange Server 2007
10 1 (0.072%) SugarCRM
10 1 (0.072%) WordPress
Applications
1 41 (2.94%) Microsoft Office
2 8 (0.57%) AutoCAD
3 6 (0.43%) PTC Creo
3 6 (0.43%) SOLIDWORKS
4 4 (0.29%) Microsoft Excel
4 4 (0.29%) Microsoft PowerPoint
5 3 (0.22%) MS Visio
Business Applications
1 2 (0.14%) Dynamics CRM
1 2 (0.14%) Remedy ITSM
2 1 (0.072%) Fidessa
2 1 (0.072%) PlanetPress Connect
Cloud Services
1 831 (59.57%) Azure
2 513 (36.77%) Microsoft 365
3 377 (27.03%) AWS
4 156 (11.18%) Entra ID
5 119 (8.53%) IaaS
6 94 (6.74%) SaaS
7 85 (6.09%) PaaS
8 68 (4.87%) OpenShift
9 61 (4.37%) GCP
10 59 (4.23%) Cloud Computing
11 31 (2.22%) GitHub
12 30 (2.15%) Azure Sentinel
13 28 (2.01%) Serverless
14 27 (1.94%) Azure DevOps
14 27 (1.94%) Nutanix
15 22 (1.58%) Power Platform
16 20 (1.43%) Azure Monitor
16 20 (1.43%) Mimecast
17 18 (1.29%) Power Automate
17 18 (1.29%) Rubrik
Communications & Networking
1 376 (26.95%) DNS
2 328 (23.51%) DHCP
3 307 (22.01%) Firewall
4 211 (15.13%) WAN
5 204 (14.62%) TCP/IP
6 163 (11.68%) LAN
7 144 (10.32%) SAN
8 138 (9.89%) VPN
9 96 (6.88%) Wi-Fi
10 91 (6.52%) HTTP
11 83 (5.95%) Network Security
12 77 (5.52%) VLAN
13 73 (5.23%) Wireless
14 53 (3.80%) SD-WAN
15 32 (2.29%) NAS
16 30 (2.15%) SMTP
17 29 (2.08%) Software-Defined Networking
17 29 (2.08%) SSL
18 25 (1.79%) Internet
18 25 (1.79%) SNMP
Database & Business Intelligence
1 185 (13.26%) SQL Server
2 36 (2.58%) Amazon RDS
3 20 (1.43%) PostgreSQL
4 15 (1.08%) MongoDB
5 12 (0.86%) Power BI
6 11 (0.79%) NoSQL
7 8 (0.57%) Apache Accumulo
7 8 (0.57%) Azure SQL Database
8 7 (0.50%) Big Data
8 7 (0.50%) MySQL
8 7 (0.50%) SAP HANA
9 6 (0.43%) Elasticsearch
10 3 (0.22%) Amazon Aurora
10 3 (0.22%) Amazon Redshift
10 3 (0.22%) Firebird
10 3 (0.22%) Hadoop
11 2 (0.14%) GIS
11 2 (0.14%) MariaDB
11 2 (0.14%) Metadata
11 2 (0.14%) Oracle Database
Development Applications
1 39 (2.80%) Git
2 26 (1.86%) Jenkins
3 18 (1.29%) GitLab
4 12 (0.86%) JIRA
5 7 (0.50%) Chocolatey
6 5 (0.36%) Artifactory
7 3 (0.22%) CircleCI
8 2 (0.14%) Bitbucket
8 2 (0.14%) Fiddler
8 2 (0.14%) Sonatype Nexus
8 2 (0.14%) Subversion
8 2 (0.14%) Visual Studio
9 1 (0.072%) Octopus Deploy
General
1 232 (16.63%) Social Skills
2 181 (12.97%) Finance
3 93 (6.67%) Inclusion and Diversity
4 77 (5.52%) Analytical Skills
5 72 (5.16%) Banking
6 53 (3.80%) Aerospace
7 39 (2.80%) Law
7 39 (2.80%) Public Sector
8 32 (2.29%) Organisational Skills
9 31 (2.22%) Manufacturing
10 30 (2.15%) Legal
10 30 (2.15%) Retail
11 21 (1.51%) Telecoms
12 18 (1.29%) Investment Banking
13 15 (1.08%) Advertising
14 14 (1.00%) Back Office
14 14 (1.00%) Financial Institution
15 12 (0.86%) Pharmaceutical
15 12 (0.86%) Private Banking
16 11 (0.79%) Documentation Skills
Libraries, Frameworks & Software Standards
1 19 (1.36%) Elastic Stack
2 17 (1.22%) Middleware
3 14 (1.00%) JSON
4 10 (0.72%) Kafka
4 10 (0.72%) XML
4 10 (0.72%) YAML
5 8 (0.57%) ARM Templates
5 8 (0.57%) Node.js
5 8 (0.57%) React
5 8 (0.57%) RESTful
6 7 (0.50%) .NET
7 6 (0.43%) Apache NiFi
7 6 (0.43%) REST
7 6 (0.43%) SAML
7 6 (0.43%) WebRTC
8 5 (0.36%) LAPP Stack
8 5 (0.36%) LDAP
8 5 (0.36%) OAuth
9 4 (0.29%) ADO
10 3 (0.22%) Keycloak
Miscellaneous
1 155 (11.11%) Data Centre
2 67 (4.80%) Clustering
3 59 (4.23%) Public Cloud
4 56 (4.01%) Virtual Team
5 50 (3.58%) Private Cloud
6 34 (2.44%) PKI
7 31 (2.22%) Management Information System
8 29 (2.08%) Replication
9 27 (1.94%) Hybrid Cloud
10 23 (1.65%) Enterprise Software
11 21 (1.51%) Driving Licence
11 21 (1.51%) Self-Motivation
12 20 (1.43%) EFT
13 14 (1.00%) Greenfield Project
14 13 (0.93%) Cloud Native
14 13 (0.93%) IoT
14 13 (0.93%) Onboarding
15 12 (0.86%) Enterprise Storage
16 11 (0.79%) Legacy Systems
17 9 (0.65%) Security Posture
Operating Systems
1 873 (62.58%) Windows
2 544 (39.00%) Windows Server
3 374 (26.81%) Linux
4 130 (9.32%) Red Hat Enterprise Linux
5 127 (9.10%) Windows Server 2019
6 108 (7.74%) Windows Server 2012
7 99 (7.10%) Windows Server 2016
8 91 (6.52%) Windows 10
9 61 (4.37%) Android
10 31 (2.22%) Unix
11 28 (2.01%) Windows Server 2003
12 26 (1.86%) Ubuntu
13 25 (1.79%) CentOS
14 19 (1.36%) Debian
14 19 (1.36%) Windows Server 2008
15 14 (1.00%) Apple iOS
16 12 (0.86%) VMS
17 10 (0.72%) Mac OS
17 10 (0.72%) Windows 8
18 9 (0.65%) Windows XP
Processes & Methodologies
1 1,367 (97.99%) Infrastructure Engineering
2 263 (18.85%) Problem-Solving
3 233 (16.70%) ITIL
4 170 (12.19%) DevOps
5 158 (11.33%) Infrastructure as Code
6 151 (10.82%) Actionable Insight
7 136 (9.75%) Disaster Recovery
8 132 (9.46%) Agile
9 99 (7.10%) Migration
10 94 (6.74%) Cybersecurity
11 85 (6.09%) Server Management
12 74 (5.30%) Continuous Improvement
12 74 (5.30%) Mentoring
13 71 (5.09%) High Availability
14 69 (4.95%) Collaborative Working
14 69 (4.95%) Virtual Infrastructure
15 67 (4.80%) Task Automation
16 63 (4.52%) CI/CD
16 63 (4.52%) Continuous Integration
17 62 (4.44%) Information Security
Programming Languages
1 467 (33.48%) PowerShell
2 246 (17.63%) Python
3 185 (13.26%) SQL
4 172 (12.33%) Bash
5 81 (5.81%) Java
6 29 (2.08%) Perl
7 16 (1.15%) Ruby
8 14 (1.00%) C
9 13 (0.93%) Korn
10 12 (0.86%) Go
11 8 (0.57%) C#
11 8 (0.57%) PHP
12 7 (0.50%) Shell Script
13 6 (0.43%) C++
13 6 (0.43%) MATLAB
14 5 (0.36%) JavaScript
14 5 (0.36%) VBScript
15 4 (0.29%) VB
16 3 (0.22%) TypeScript
17 2 (0.14%) T-SQL
Qualifications
1 278 (19.93%) Security Cleared
2 240 (17.20%) Degree
3 168 (12.04%) SC Cleared
4 137 (9.82%) Cisco Certification
5 121 (8.67%) DV Cleared
6 102 (7.31%) Microsoft Certification
7 86 (6.16%) Azure Certification
8 73 (5.23%) CCNA
9 57 (4.09%) MCSE
10 40 (2.87%) CCNP
11 34 (2.44%) ITIL Certification
12 27 (1.94%) MCSA
13 24 (1.72%) MCP
14 21 (1.51%) Computer Science Degree
15 20 (1.43%) AWS Certification
16 17 (1.22%) CISSP
17 13 (0.93%) DBS Check
18 12 (0.86%) VMware Certified Professional (VCP)
19 11 (0.79%) GSEC
20 8 (0.57%) HNC
Quality Assurance & Compliance
1 69 (4.95%) SLA
2 45 (3.23%) ISO/IEC 27001
3 41 (2.94%) Cyber Essentials
4 13 (0.93%) Accessibility
4 13 (0.93%) NIST
5 10 (0.72%) PCI DSS
6 7 (0.50%) GDPR
7 5 (0.36%) Cyber Essentials PLUS
7 5 (0.36%) NCSC
8 4 (0.29%) COBIT
8 4 (0.29%) Data Quality
8 4 (0.29%) QA
9 3 (0.22%) DICOM
9 3 (0.22%) HL7
9 3 (0.22%) ISO 9001
9 3 (0.22%) ISO/IEC 20000
9 3 (0.22%) PMO
10 2 (0.14%) PSD2
10 2 (0.14%) SOC 2
11 1 (0.072%) IASME
System Software
1 656 (47.03%) Active Directory
2 487 (34.91%) VMware Infrastructure
3 276 (19.78%) Hyper-V
4 136 (9.75%) Docker
5 95 (6.81%) vSphere
6 85 (6.09%) VMware ESXi
7 84 (6.02%) Virtual Machines
8 53 (3.80%) Virtual Servers
9 36 (2.58%) Virtual Desktop
10 32 (2.29%) Firmware
11 25 (1.79%) VMware NSX
12 19 (1.36%) XenApp
13 11 (0.79%) BitLocker
14 9 (0.65%) Terminal Server
15 7 (0.50%) DFS Replication
15 7 (0.50%) Terminal Services
16 6 (0.43%) Ceph
17 5 (0.36%) Microsoft Virtual Server
17 5 (0.36%) VMware Workstation
18 4 (0.29%) Citrix Hypervisor
Systems Management
1 249 (17.85%) Ansible
2 174 (12.47%) Puppet
3 167 (11.97%) Terraform
4 146 (10.47%) Microsoft Intune
5 142 (10.18%) SCCM
6 136 (9.75%) Kubernetes
7 77 (5.52%) vCenter Server
8 63 (4.52%) SCOM
9 42 (3.01%) Active Directory Federation Services
10 37 (2.65%) FortiGate
11 32 (2.29%) Single Sign-On
12 28 (2.01%) Microsoft Clustering
13 25 (1.79%) VxRail
14 23 (1.65%) Failover Clustering
14 23 (1.65%) Red Hat Satellite
15 21 (1.51%) WSUS
16 19 (1.36%) Microsoft Data Protection Manager
17 11 (0.79%) Nagios
17 11 (0.79%) SCVMM
18 10 (0.72%) Tivoli
Vendors
1 702 (50.32%) VMware
2 633 (45.38%) Microsoft
3 261 (18.71%) Cisco
4 142 (10.18%) Red Hat
5 128 (9.18%) Citrix
6 79 (5.66%) Veeam
7 70 (5.02%) Meraki
8 66 (4.73%) HP
9 46 (3.30%) Dell
10 34 (2.44%) Palo Alto
11 33 (2.37%) Fortinet
12 32 (2.29%) NetApp
12 32 (2.29%) SolarWinds
13 31 (2.22%) Commvault
14 29 (2.08%) Google
15 28 (2.01%) Sophos
16 27 (1.94%) CheckPoint
16 27 (1.94%) F5
17 25 (1.79%) Aruba
18 24 (1.72%) Juniper