Management Information System Jobs

Management Information Systems
UK

The table below looks at the prevalence of the term Management Information System in permanent job vacancies. Included is a benchmarking guide to the salaries offered in vacancies that have cited Management Information System over the 6 months to 10 December 2023 with a comparison to the same period over the previous 2 years.

6 months to
10 Dec 2023
Same period 2022 Same period 2021
Rank 89 92 111
Rank change year-on-year +3 +19 +42
Permanent jobs citing Management Information System 1,758 4,320 3,989
As % of all permanent jobs advertised in the UK 3.36% 3.53% 3.14%
As % of the Miscellaneous category 9.14% 8.23% 7.17%
Number of salaries quoted 1,217 2,043 2,100
10th Percentile £35,000 £30,800 £30,000
25th Percentile £43,750 £40,716 £40,500
Median annual salary (50th Percentile) £60,000 £55,000 £55,000
Median % change year-on-year +9.09% - -
75th Percentile £75,000 £75,000 £72,500
90th Percentile £97,500 £92,500 £87,500
UK excluding London median annual salary £55,000 £49,000 £47,500
% change year-on-year +12.24% +3.16% -3.06%

All Generic Skills
UK

Management Information System is in the General and Transferable Skills category. The following table is for comparison with the above and provides summary statistics for all permanent job vacancies with a requirement for generic IT skills.

Permanent vacancies with a requirement for generic IT skills 19,243 52,473 55,657
As % of all permanent jobs advertised in the UK 36.81% 42.93% 43.80%
Number of salaries quoted 14,017 29,568 33,811
10th Percentile £32,756 £34,996 £33,750
25th Percentile £45,000 £46,250 £45,000
Median annual salary (50th Percentile) £62,500 £64,750 £60,000
Median % change year-on-year -3.47% +7.92% -
75th Percentile £83,750 £85,000 £82,500
90th Percentile £107,500 £105,000 £100,000
UK excluding London median annual salary £55,000 £55,000 £50,000
% change year-on-year - +10.00% -

Management Information System
Job Vacancy Trend

Job postings citing Management Information System as a proportion of all IT jobs advertised.
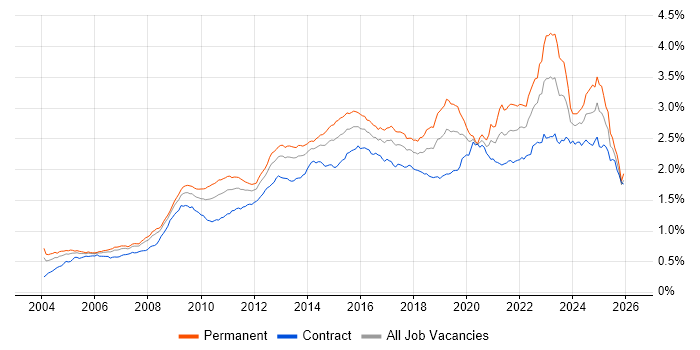
Job vacancy trend for Management Information System in the UK

Management Information System
Salary Trend

3-month moving average salary quoted in jobs citing Management Information System.

Salary trend for Management Information System in the UK

Management Information System
Salary Histogram

Salary distribution for jobs citing Management Information System over the 6 months to 10 December 2023.

Salary histogram for Management Information System in the UK

Management Information System
Top 19 Job Locations

The table below looks at the demand and provides a guide to the median salaries quoted in IT jobs citing Management Information System within the UK over the 6 months to 10 December 2023. The 'Rank Change' column provides an indication of the change in demand within each location based on the same 6 month period last year.

Location Rank Change
on Same Period
Last Year
Matching
Permanent
IT Job Ads
Median Salary
Past 6 Months
Median Salary
% Change
on Same Period
Last Year
Live
Jobs
England +4 1,533 £60,000 +9.09% 1,032
UK excluding London -15 1,058 £55,000 +12.24% 690
Work from Home +13 645 £62,450 +13.55% 609
London +28 577 £72,500 +11.54% 380
South East -5 282 £60,000 +11.42% 181
North of England +24 259 £51,500 +11.96% 165
Midlands +28 215 £52,700 +5.40% 134
West Midlands +24 145 £51,000 +2.00% 89
North West +35 133 £48,898 +5.16% 97
South West -71 114 £60,000 +20.00% 104
Yorkshire +20 101 £52,500 +10.53% 50
Scotland -5 88 £56,250 +14.80% 33
East Midlands +44 71 £56,500 +25.56% 44
East of England +11 57 £60,000 +20.00% 66
Wales -19 33 £41,598 +4.00% 15
North East +18 25 £60,000 +60.00% 22
Northern Ireland +12 10 £47,394 +22.21% 15
Channel Islands - 2 £47,000 - 1
Isle of Man - 1 £72,500 -

Management Information System
Co-occurring Skills and Capabilities by Category

The follow tables expand on the table above by listing co-occurrences grouped by category. The same employment type, locality and period is covered with up to 20 co-occurrences shown in each of the following categories:

Application Platforms
1 73 (4.15%) SharePoint
2 29 (1.65%) MS Exchange
3 17 (0.97%) CMS
4 13 (0.74%) Apache Spark
4 13 (0.74%) IIS
5 10 (0.57%) SAS
6 8 (0.46%) ArcGIS
7 7 (0.40%) Confluence
8 4 (0.23%) ArcSDE
8 4 (0.23%) SharePoint Server
9 2 (0.11%) Apache
9 2 (0.11%) Kentico
9 2 (0.11%) NServiceBus
10 1 (0.057%) Apache Airflow
10 1 (0.057%) Exchange Server 2000
10 1 (0.057%) Exchange Server 2013
10 1 (0.057%) IBM Domino
10 1 (0.057%) Sitecore CMS
10 1 (0.057%) Umbraco
10 1 (0.057%) WebSphere
Applications
1 124 (7.05%) Microsoft Excel
2 118 (6.71%) Microsoft Office
3 60 (3.41%) Microsoft PowerPoint
4 30 (1.71%) MS Visio
5 17 (0.97%) Microsoft Project
6 7 (0.40%) Spreadsheet
7 4 (0.23%) Autodesk Inventor
8 3 (0.17%) AutoCAD
9 2 (0.11%) 3ds Max
9 2 (0.11%) Blender
9 2 (0.11%) CINEMA 4D
9 2 (0.11%) MicroStation
9 2 (0.11%) SPSS
10 1 (0.057%) Adobe Creative Suite
10 1 (0.057%) PTC Creo
10 1 (0.057%) Sketch
Business Applications
1 18 (1.02%) Elite 3E
2 17 (0.97%) Remedy ITSM
3 13 (0.74%) Dynamics CRM
4 8 (0.46%) Dynamics AX
5 6 (0.34%) iTrent
5 6 (0.34%) SAP S/4HANA
6 5 (0.28%) SystmOne
7 4 (0.23%) Dynamics NAV
7 4 (0.23%) SAP ERP
8 3 (0.17%) Infor M3
8 3 (0.17%) Salesforce CRM
8 3 (0.17%) SAP Oil and Gas
9 2 (0.11%) Misys Equation
9 2 (0.11%) NetSuite
9 2 (0.11%) SAP BPC
9 2 (0.11%) SAP FI
9 2 (0.11%) SAP MM
9 2 (0.11%) SAP SCM
9 2 (0.11%) Sparx Enterprise Architect
9 2 (0.11%) Workday HCM
Cloud Services
1 284 (16.15%) Azure
2 149 (8.48%) Microsoft 365
3 136 (7.74%) AWS
4 121 (6.88%) Power Platform
5 97 (5.52%) SaaS
6 56 (3.19%) PaaS
7 48 (2.73%) IaaS
8 47 (2.67%) PowerApps
9 46 (2.62%) Azure DevOps
10 45 (2.56%) Dynamics 365
11 43 (2.45%) Power Automate
12 42 (2.39%) Entra ID
13 39 (2.22%) GCP
14 27 (1.54%) Cloud Computing
15 20 (1.14%) GitHub
16 17 (0.97%) Azure Sentinel
16 17 (0.97%) OneDrive
17 14 (0.80%) Azure Data Factory
18 13 (0.74%) Azure Synapse Analytics
18 13 (0.74%) WhatsApp
Communications & Networking
1 137 (7.79%) Firewall
2 71 (4.04%) Network Security
3 45 (2.56%) Intrusion Detection
4 44 (2.50%) LAN
5 39 (2.22%) VPN
6 37 (2.10%) Internet
7 33 (1.88%) DNS
8 30 (1.71%) SAN
9 28 (1.59%) Wireless
10 27 (1.54%) WAN
11 23 (1.31%) TCP/IP
12 21 (1.19%) DHCP
13 15 (0.85%) VoIP
14 10 (0.57%) HTTP
14 10 (0.57%) Intranet
15 8 (0.46%) IP Telephony
15 8 (0.46%) NAS
16 7 (0.40%) IPv4
16 7 (0.40%) Wi-Fi
17 6 (0.34%) Broadband
Database & Business Intelligence
1 110 (6.26%) Power BI
2 105 (5.97%) SQL Server
3 38 (2.16%) Relational Database
4 36 (2.05%) Data Warehouse
5 31 (1.76%) MySQL
6 30 (1.71%) SQL Server Reporting Services
7 29 (1.65%) Big Data
7 29 (1.65%) Tableau
8 27 (1.54%) Data Lake
9 26 (1.48%) NoSQL
10 23 (1.31%) SQL Server Integration Services
11 21 (1.19%) MongoDB
12 20 (1.14%) Azure SQL Database
12 20 (1.14%) Metadata
13 15 (0.85%) GIS
14 10 (0.57%) BusinessObjects
14 10 (0.57%) Hadoop
14 10 (0.57%) PostgreSQL
14 10 (0.57%) QlikView
15 9 (0.51%) SQL Server Analysis Services
Development Applications
1 39 (2.22%) Git
2 29 (1.65%) Jenkins
3 27 (1.54%) JIRA
4 9 (0.51%) Oracle APEX
5 8 (0.46%) GitLab
5 8 (0.46%) SonarQube
6 7 (0.40%) CircleCI
7 6 (0.34%) git-flow
7 6 (0.34%) Selenium
7 6 (0.34%) Visual Studio
8 5 (0.28%) Bitbucket Server
8 5 (0.28%) FitNesse
8 5 (0.28%) Octopus Deploy
8 5 (0.28%) Postman
8 5 (0.28%) SoapUI
8 5 (0.28%) SQL Server Management Studio (SSMS)
8 5 (0.28%) Team Foundation Server
8 5 (0.28%) TeamCity
8 5 (0.28%) WebDriver
9 4 (0.23%) HP UFT
General
1 628 (35.72%) Social Skills
2 438 (24.91%) Finance
3 369 (20.99%) Analytical Skills
4 153 (8.70%) Inclusion and Diversity
4 153 (8.70%) Legal
5 117 (6.66%) Public Sector
6 100 (5.69%) Local Government
7 78 (4.44%) Organisational Skills
8 75 (4.27%) Marketing
9 67 (3.81%) Presentation Skills
10 61 (3.47%) Law
11 60 (3.41%) Retail
12 57 (3.24%) Financial Institution
13 56 (3.19%) Manufacturing
14 49 (2.79%) Banking
15 38 (2.16%) Telecoms
16 26 (1.48%) Documentation Skills
16 26 (1.48%) Influencing Skills
16 26 (1.48%) Police
17 22 (1.25%) Front Office
Job Titles
1 359 (20.42%) Senior
2 329 (18.71%) Analyst
3 140 (7.96%) Project Manager
4 128 (7.28%) Lead
5 120 (6.83%) Systems Engineer
6 116 (6.60%) Senior Manager
7 110 (6.26%) Senior Project Manager
8 108 (6.14%) Senior Systems Engineer
9 94 (5.35%) Architect
10 93 (5.29%) Developer
11 74 (4.21%) IT Manager
12 71 (4.04%) Consultant
13 65 (3.70%) Security Manager
14 60 (3.41%) Security Engineer
15 54 (3.07%) Security Analyst
16 47 (2.67%) Business Analyst
17 46 (2.62%) Operations Analyst
18 44 (2.50%) Information Manager
19 42 (2.39%) Support Engineer
20 41 (2.33%) Support Analyst
Libraries, Frameworks & Software Standards
1 42 (2.39%) Web Services
2 41 (2.33%) .NET
3 39 (2.22%) HTML
4 38 (2.16%) ModSecurity
4 38 (2.16%) REST
4 38 (2.16%) XML
5 35 (1.99%) JSON
6 27 (1.54%) SOAP
7 22 (1.25%) Middleware
8 20 (1.14%) J2SE
9 18 (1.02%) CSS
10 17 (0.97%) .NET Framework
10 17 (0.97%) EDI
11 10 (0.57%) AngularJS
11 10 (0.57%) ASP.NET
11 10 (0.57%) HTML5
12 9 (0.51%) Kafka
12 9 (0.51%) SAML
12 9 (0.51%) YAML
13 8 (0.46%) OAuth
Miscellaneous
1 124 (7.05%) Virtual Team
2 91 (5.18%) Self-Motivation
3 60 (3.41%) Onboarding
4 59 (3.36%) Data Centre
5 42 (2.39%) Greenfield Project
6 41 (2.33%) Data Protection Act
7 34 (1.93%) Security Posture
8 33 (1.88%) Public Cloud
9 32 (1.82%) Security Operations Centre
10 31 (1.76%) Foreign Exchange (FX)
10 31 (1.76%) Operational Technology
11 30 (1.71%) Legacy Systems
12 29 (1.65%) Cyber Threat
13 27 (1.54%) Cyberattack
14 26 (1.48%) Data Structures
14 26 (1.48%) Equities
15 25 (1.42%) Enterprise Software
15 25 (1.42%) Taxonomies
16 23 (1.31%) Derivative
17 19 (1.08%) Product Ownership
Operating Systems
1 197 (11.21%) Windows
2 70 (3.98%) Windows Server
3 63 (3.58%) Linux
4 38 (2.16%) Unix
5 31 (1.76%) Windows 10
6 19 (1.08%) Android
7 17 (0.97%) Windows Server 2016
8 16 (0.91%) Windows Server 2012
9 12 (0.68%) Apple iOS
10 9 (0.51%) Windows 7
10 9 (0.51%) Windows Server 2019
11 6 (0.34%) Windows 8
12 5 (0.28%) Red Hat Enterprise Linux
13 4 (0.23%) VMS
14 2 (0.11%) Mac OS
15 1 (0.057%) zOS
Processes & Methodologies
1 443 (25.20%) Information Security
2 368 (20.93%) Problem-Solving
3 340 (19.34%) Project Management
4 319 (18.15%) Agile
5 297 (16.89%) Computer Science
6 257 (14.62%) Cybersecurity
7 252 (14.33%) Risk Management
8 224 (12.74%) Project Delivery
9 209 (11.89%) ITIL
10 197 (11.21%) SDLC
11 192 (10.92%) Asset Management
12 184 (10.47%) Migration
13 177 (10.07%) ERP
14 169 (9.61%) Customer Service
15 166 (9.44%) Business Intelligence
16 160 (9.10%) Continuous Improvement
16 160 (9.10%) Scrum
17 156 (8.87%) PRINCE2
18 148 (8.42%) Decision-Making
18 148 (8.42%) Security Management
Programming Languages
1 305 (17.35%) SQL
2 153 (8.70%) Python
3 123 (7.00%) PL/SQL
4 85 (4.84%) PowerShell
5 60 (3.41%) Java
6 53 (3.01%) JavaScript
7 40 (2.28%) C#
8 30 (1.71%) Bash
9 21 (1.19%) TypeScript
10 20 (1.14%) C++
11 19 (1.08%) Perl
12 13 (0.74%) T-SQL
13 10 (0.57%) R
13 10 (0.57%) Shell Script
14 9 (0.51%) Go
14 9 (0.51%) VBA
15 7 (0.40%) Data Analysis Expressions
15 7 (0.40%) Scala
16 6 (0.34%) Apex Code
17 5 (0.28%) XAML
Qualifications
1 614 (34.93%) Degree
2 224 (12.74%) Computer Science Degree
2 224 (12.74%) Security Cleared
3 217 (12.34%) CISSP
4 168 (9.56%) CISM
5 138 (7.85%) SC Cleared
6 80 (4.55%) CRISC
7 76 (4.32%) CISA
8 62 (3.53%) Master's Degree
9 49 (2.79%) Cisco Certification
9 49 (2.79%) CompTIA Security+
10 40 (2.28%) Azure Certification
10 40 (2.28%) Microsoft Certification
11 33 (1.88%) AWS Certification
12 28 (1.59%) CCNA
12 28 (1.59%) GIAC
13 27 (1.54%) CEH
14 25 (1.42%) BPSS Clearance
15 24 (1.37%) DBS Check
15 24 (1.37%) OSCP
Quality Assurance & Compliance
1 208 (11.83%) ISO/IEC 27001
2 146 (8.30%) NIST
3 96 (5.46%) GDPR
4 84 (4.78%) Data Quality
5 73 (4.15%) Cyber Essentials
6 67 (3.81%) GRC
7 60 (3.41%) SLA
8 59 (3.36%) QA
9 52 (2.96%) PCI DSS
10 38 (2.16%) ISO 22301
11 31 (1.76%) Cyber Essentials PLUS
11 31 (1.76%) NCSC
12 29 (1.65%) COBIT
13 20 (1.14%) PMO
14 16 (0.91%) ISO/IEC 27002 (supersedes ISO/IEC 17799)
15 14 (0.80%) Accessibility
16 11 (0.63%) Sarbanes-Oxley
17 10 (0.57%) HMG Security Policy Framework
17 10 (0.57%) IASME
17 10 (0.57%) ISO 9001
System Software
1 190 (10.81%) Active Directory
2 79 (4.49%) VMware Infrastructure
3 26 (1.48%) Virtual Desktop
4 23 (1.31%) Docker
5 15 (0.85%) VMware ESXi
6 10 (0.57%) Firmware
7 9 (0.51%) Hyper-V
8 8 (0.46%) Virtual Machines
8 8 (0.46%) Virtual Servers
9 7 (0.40%) Slurm Workload Manager
10 6 (0.34%) vSphere
11 5 (0.28%) HDFS
12 3 (0.17%) Embedded Firmware
12 3 (0.17%) Microsoft Virtual Server
12 3 (0.17%) XenApp
13 2 (0.11%) KVM
13 2 (0.11%) XenDesktop
14 1 (0.057%) Apache ZooKeeper
14 1 (0.057%) BitLocker
14 1 (0.057%) Citrix Hypervisor
Systems Management
1 41 (2.33%) Microsoft Intune
2 36 (2.05%) Kubernetes
3 31 (1.76%) Terraform
4 25 (1.42%) SCCM
5 22 (1.25%) Puppet
6 15 (0.85%) CASB
7 12 (0.68%) Ansible
8 11 (0.63%) Progress Chef
8 11 (0.63%) Single Sign-On
9 9 (0.51%) Nessus
10 8 (0.46%) AirWatch
11 6 (0.34%) Grafana
12 5 (0.28%) Control-M
13 4 (0.23%) Nmap
13 4 (0.23%) WSUS
14 3 (0.17%) Backup Exec
14 3 (0.17%) Failover Clustering
14 3 (0.17%) QRadar
14 3 (0.17%) SCOM
14 3 (0.17%) Systems Management Server (SMS)
Vendors
1 429 (24.40%) Microsoft
2 214 (12.17%) NEC
3 133 (7.57%) Salesforce
4 88 (5.01%) VMware
5 85 (4.84%) ServiceNow
6 58 (3.30%) Oracle
7 54 (3.07%) Cisco
8 47 (2.67%) Google
9 46 (2.62%) CA
10 42 (2.39%) HP
11 35 (1.99%) Capita
12 32 (1.82%) SAP
13 30 (1.71%) Citrix
14 21 (1.19%) Dell
15 20 (1.14%) BMC
16 17 (0.97%) Remedy
17 16 (0.91%) Apple
18 15 (0.85%) Databricks
19 12 (0.68%) Alteryx
19 12 (0.68%) Qualys