Oracle Database (Oracle RDBMS)
UK

The following table provides summary statistics for permanent job vacancies with a requirement for Oracle Database skills. Included is a benchmarking guide to the salaries offered in vacancies that have cited Oracle Database over the 6 months to 7 December 2023 with a comparison to the same period in the previous 2 years.

6 months to
7 Dec 2023
Same period 2022 Same period 2021
Rank 347 484 464
Rank change year-on-year +137 -20 -14
Permanent jobs citing Oracle Database 455 773 860
As % of all permanent jobs advertised in the UK 0.86% 0.63% 0.67%
As % of the Database & Business Intelligence category 4.03% 2.70% 2.48%
Number of salaries quoted 224 450 488
10th Percentile £36,575 £37,500 £37,500
25th Percentile £47,500 £42,759 £43,750
Median annual salary (50th Percentile) £58,750 £55,000 £57,500
Median % change year-on-year +6.82% -4.35% +18.04%
75th Percentile £72,450 £70,938 £65,000
90th Percentile £90,000 £87,500 £77,500
UK excluding London median annual salary £55,291 £52,500 £47,500
% change year-on-year +5.32% +10.53% +5.56%

All Database and Business Intelligence Skills
UK

Oracle Database is in the Databases and Business Intelligence category. The following table is for comparison with the above and provides summary statistics for all permanent job vacancies with a requirement for database or business intelligence skills.

Permanent vacancies with a requirement for database or business intelligence skills 11,277 28,579 34,744
As % of all permanent jobs advertised in the UK 21.28% 23.27% 27.11%
Number of salaries quoted 8,446 17,544 22,627
10th Percentile £36,750 £36,750 £35,500
25th Percentile £46,580 £46,250 £42,500
Median annual salary (50th Percentile) £60,000 £62,500 £58,500
Median % change year-on-year -4.00% +6.84% +6.36%
75th Percentile £80,000 £82,500 £77,500
90th Percentile £95,000 £100,000 £95,000
UK excluding London median annual salary £55,000 £55,000 £50,000
% change year-on-year - +10.00% +2.04%

Oracle Database
Job Vacancy Trend

Job postings citing Oracle Database as a proportion of all IT jobs advertised.
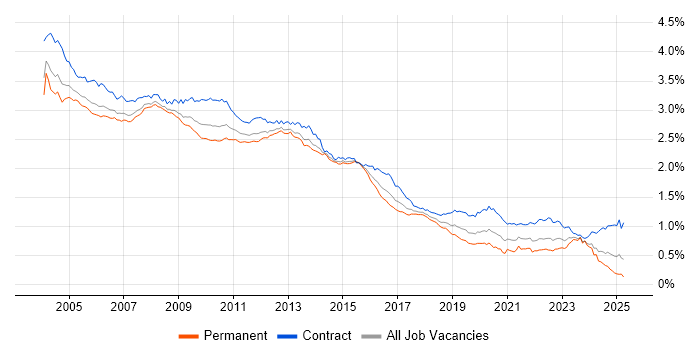
Job vacancy trend for Oracle Database in the UK

Oracle Database
Salary Trend

3-month moving average salary quoted in jobs citing Oracle Database.

Salary trend for Oracle Database in the UK

Oracle Database
Salary Histogram

Salary distribution for jobs citing Oracle Database over the 6 months to 7 December 2023.

Salary histogram for Oracle Database in the UK

Oracle Database
Top 18 Job Locations

The table below looks at the demand and provides a guide to the median salaries quoted in IT jobs citing Oracle Database within the UK over the 6 months to 7 December 2023. The 'Rank Change' column provides an indication of the change in demand within each location based on the same 6 month period last year.

Location Rank Change
on Same Period
Last Year
Matching
Permanent
IT Job Ads
Median Salary
Past 6 Months
Median Salary
% Change
on Same Period
Last Year
Live
Jobs
England +106 341 £57,500 +4.55% 79
UK excluding London +110 336 £55,291 +5.32% 50
Work from Home +200 323 £60,000 +8.11% 84
South East +104 98 £52,500 - 22
London +165 72 £69,447 -0.79% 37
North of England +81 57 £60,000 +33.33% 10
Midlands +110 46 £49,495 -5.72% 10
East Midlands +82 43 £49,990 +24.98% 10
South West +25 37 £70,576 +12.92% 2
North West +97 36 £60,750 +54.50% 2
Scotland +38 36 £69,447 +19.74% 3
Yorkshire +75 20 £60,000 -3.23% 6
Wales +24 20 - - 2
Northern Ireland +49 17 £70,000 +78.02%
East of England +92 15 £53,750 +2.38% 1
Isle of Man - 10 £60,000 -
West Midlands +76 3 £40,005 -23.80%
North East +29 1 £50,000 +25.00% 4

Oracle Database
Co-occurring Skills and Capabilities by Category

The follow tables expand on the table above by listing co-occurrences grouped by category. The same employment type, locality and period is covered with up to 20 co-occurrences shown in each of the following categories:

Application Platforms
1 24 (5.27%) Confluence
2 20 (4.40%) SharePoint
3 17 (3.74%) WebLogic
4 12 (2.64%) WebSphere
5 11 (2.42%) IIS
6 8 (1.76%) Oracle Service Bus
7 6 (1.32%) IBM HTTP Server
7 6 (1.32%) Tomcat
8 5 (1.10%) Oracle Application Server
9 4 (0.88%) ArcGIS
9 4 (0.88%) Oracle HTTP Server
9 4 (0.88%) WebSphere Application Server
10 3 (0.66%) JBoss
10 3 (0.66%) Oracle Workflow
11 2 (0.44%) MS Exchange
Applications
1 17 (3.74%) Microsoft Office
2 9 (1.98%) Microsoft Excel
3 8 (1.76%) MS Visio
4 1 (0.22%) Chatbot
Business Applications
1 8 (1.76%) Remedy ITSM
2 6 (1.32%) Oracle Cash Management
2 6 (1.32%) Oracle EBS
3 5 (1.10%) Siebel CRM
4 3 (0.66%) Oracle ERP
5 2 (0.44%) SAP FI-GL
5 2 (0.44%) Temenos T24
6 1 (0.22%) Eloqua
6 1 (0.22%) HFM
6 1 (0.22%) Oracle Applications
6 1 (0.22%) Oracle EBS R12
6 1 (0.22%) Oracle FAH
6 1 (0.22%) Oracle General Ledger
6 1 (0.22%) Oracle Procure-to-Pay
6 1 (0.22%) SAP S/4HANA
Cloud Services
1 106 (23.30%) AWS
2 90 (19.78%) Serverless
3 39 (8.57%) Azure
4 30 (6.59%) SaaS
5 20 (4.40%) BlazeMeter
6 17 (3.74%) GCP
6 17 (3.74%) Power Platform
7 12 (2.64%) Amazon SQS
7 12 (2.64%) AWS CodeCommit
8 7 (1.54%) Cloud Computing
9 4 (0.88%) GitHub
10 3 (0.66%) Azure DevOps
10 3 (0.66%) Azure Pipelines
11 2 (0.44%) Azure AKS
11 2 (0.44%) Azure Functions
11 2 (0.44%) Azure Sentinel
11 2 (0.44%) Azure Service Bus
11 2 (0.44%) Microsoft 365
11 2 (0.44%) OpenShift
11 2 (0.44%) PowerApps
Communications & Networking
1 13 (2.86%) Internet
2 12 (2.64%) AMQP
3 10 (2.20%) FTP
4 8 (1.76%) VPN
5 4 (0.88%) DNS
5 4 (0.88%) HTTP
5 4 (0.88%) LAN
5 4 (0.88%) WAN
6 1 (0.22%) Firewall
6 1 (0.22%) Intranet
6 1 (0.22%) SAN
6 1 (0.22%) SSL
6 1 (0.22%) Wireless
Database & Business Intelligence
1 133 (29.23%) Oracle Database 11g
2 106 (23.30%) Relational Database
3 99 (21.76%) SQL Server
4 94 (20.66%) RDBMS
5 91 (20.00%) PostgreSQL
6 58 (12.75%) Oracle Database 10g
7 49 (10.77%) Oracle Database 12c
8 26 (5.71%) MySQL
9 19 (4.18%) Data Warehouse
10 18 (3.96%) MongoDB
11 16 (3.52%) SQL Server Integration Services
12 15 (3.30%) Power BI
13 12 (2.64%) Oracle Reports
14 10 (2.20%) SQL Server Reporting Services
15 9 (1.98%) Amazon Redshift
16 8 (1.76%) VLDB
17 7 (1.54%) Oracle ODI
18 5 (1.10%) Data Mart
18 5 (1.10%) Oracle BI Publisher
18 5 (1.10%) SQL Server Analysis Services
Development Applications
1 109 (23.96%) Git
2 36 (7.91%) JDeveloper
3 31 (6.81%) Oracle APEX
4 25 (5.49%) JIRA
5 23 (5.05%) Jenkins
6 22 (4.84%) Oracle Forms
7 21 (4.62%) Cucumber
8 20 (4.40%) eggPlant
8 20 (4.40%) JMeter
8 20 (4.40%) Postman
8 20 (4.40%) REST Assured
8 20 (4.40%) SoapUI
8 20 (4.40%) The Grinder
9 18 (3.96%) LoadRunner
9 18 (3.96%) Maven
10 15 (3.30%) JUnit
11 13 (2.86%) Mockito
12 12 (2.64%) ClearCase
12 12 (2.64%) GitLab
13 10 (2.20%) IBM UrbanCode
General
1 58 (12.75%) Finance
2 55 (12.09%) Police
3 40 (8.79%) Banking
4 38 (8.35%) Public Sector
5 36 (7.91%) Social Skills
6 23 (5.05%) Analytical Skills
7 20 (4.40%) Local Government
8 16 (3.52%) Inclusion and Diversity
9 10 (2.20%) Law
10 7 (1.54%) Retail
11 4 (0.88%) Aviation
11 4 (0.88%) Influencing Skills
12 3 (0.66%) Organisational Skills
13 2 (0.44%) Automotive
13 2 (0.44%) Back Office
13 2 (0.44%) General Ledger
13 2 (0.44%) Investment Banking
13 2 (0.44%) Legal
13 2 (0.44%) Manufacturing
13 2 (0.44%) Marketing
Job Titles
1 120 (26.37%) Developer
2 113 (24.84%) Senior
3 105 (23.08%) DBA
4 102 (22.42%) Software Engineer
5 87 (19.12%) Ruby Engineer
6 80 (17.58%) Senior Developer
7 66 (14.51%) Administrator
7 66 (14.51%) Oracle DBA
8 56 (12.31%) Database Developer
9 53 (11.65%) PostgreSQL Developer
9 53 (11.65%) Senior Database Developer
10 52 (11.43%) Analyst
11 31 (6.81%) Oracle Developer
12 23 (5.05%) PL/SQL Developer
13 22 (4.84%) Support Analyst
14 21 (4.62%) SQL DBA
15 20 (4.40%) Database Engineer
15 20 (4.40%) SQL Developer
16 17 (3.74%) Senior Database Engineer
17 16 (3.52%) Senior Oracle Developer
Libraries, Frameworks & Software Standards
1 90 (19.78%) React
2 89 (19.56%) Node.js
3 51 (11.21%) Web Services
4 43 (9.45%) REST
5 41 (9.01%) SOAP
5 41 (9.01%) XML
6 39 (8.57%) JSON
7 32 (7.03%) HTML
8 27 (5.93%) Middleware
9 25 (5.49%) CSS
10 21 (4.62%) .NET
11 20 (4.40%) Gherkin
11 20 (4.40%) Ruby on Rails
12 13 (2.86%) RabbitMQ
12 13 (2.86%) Swagger
13 12 (2.64%) Flask
13 12 (2.64%) LDAP
13 12 (2.64%) OpenAPI
13 12 (2.64%) WireMock
14 11 (2.42%) Oracle Fusion
Miscellaneous
1 28 (6.15%) Replication
2 13 (2.86%) Data Centre
3 9 (1.98%) Clustering
3 9 (1.98%) Derivative
4 8 (1.76%) Self-Motivation
5 7 (1.54%) Data Fabric
5 7 (1.54%) Enterprise Software
5 7 (1.54%) Foreign Exchange (FX)
5 7 (1.54%) Legacy Systems
5 7 (1.54%) Onboarding
5 7 (1.54%) Reference Data
5 7 (1.54%) SWIFT Messaging Network
6 6 (1.32%) Distributed Systems
6 6 (1.32%) Equity Derivative
6 6 (1.32%) Fixed Income
7 4 (0.88%) Client/Server
7 4 (0.88%) CMDB
7 4 (0.88%) Product Ownership
8 2 (0.44%) Eurex
8 2 (0.44%) Life Science
Operating Systems
1 65 (14.29%) Linux
2 54 (11.87%) Unix
3 48 (10.55%) Windows
4 9 (1.98%) Solaris
5 8 (1.76%) Windows Server
6 5 (1.10%) AIX
6 5 (1.10%) Red Hat Enterprise Linux
7 1 (0.22%) CentOS
7 1 (0.22%) Oracle Linux
7 1 (0.22%) VMS
Processes & Methodologies
1 172 (37.80%) Actionable Insight
2 171 (37.58%) Unit Testing
3 144 (31.65%) Performance Tuning
4 143 (31.43%) Problem-Solving
5 134 (29.45%) DevOps
6 118 (25.93%) Software Engineering
7 112 (24.62%) Continuous Integration
8 100 (21.98%) Artificial Intelligence
9 96 (21.10%) Migration
10 95 (20.88%) Microservices
10 95 (20.88%) Open Source
11 94 (20.66%) Agile
11 94 (20.66%) Containerisation
12 88 (19.34%) Code Quality
13 87 (19.12%) Clean Code
13 87 (19.12%) Design Patterns
14 70 (15.38%) Data Migration
14 70 (15.38%) Secure Coding
15 53 (11.65%) High Availability
16 46 (10.11%) Scrum
Programming Languages
1 283 (62.20%) SQL
2 159 (34.95%) Java
2 159 (34.95%) PL/SQL
3 149 (32.75%) Python
4 126 (27.69%) JavaScript
5 111 (24.40%) Ruby
6 102 (22.42%) Perl
7 100 (21.98%) Bash
8 88 (19.34%) Go
9 40 (8.79%) C#
10 39 (8.57%) PowerShell
11 22 (4.84%) C
12 15 (3.30%) T-SQL
13 12 (2.64%) Groovy
13 12 (2.64%) Shell Script
13 12 (2.64%) Tcl
14 7 (1.54%) Delphi
14 7 (1.54%) VBScript
15 3 (0.66%) C++
15 3 (0.66%) VB
Qualifications
1 108 (23.74%) Security Cleared
2 98 (21.54%) SC Cleared
3 34 (7.47%) Degree
4 18 (3.96%) Oracle Certification
5 15 (3.30%) OCP
6 13 (2.86%) Computer Science Degree
6 13 (2.86%) OCA
7 8 (1.76%) Master's Degree
8 6 (1.32%) DV Cleared
9 4 (0.88%) ITIL Certification
9 4 (0.88%) MCSA
9 4 (0.88%) Microsoft Certification
10 1 (0.22%) CTC Cleared
10 1 (0.22%) MCSE
10 1 (0.22%) PMI Certification
10 1 (0.22%) PMP
Quality Assurance & Compliance
1 88 (19.34%) QA
2 21 (4.62%) SLA
3 1 (0.22%) COREP
3 1 (0.22%) Data Quality
3 1 (0.22%) IFRS
3 1 (0.22%) IFRS 17
3 1 (0.22%) IFRS 9
3 1 (0.22%) PSD2
3 1 (0.22%) Sarbanes-Oxley
System Software
1 35 (7.69%) Oracle RAC
2 20 (4.40%) Active Directory
3 11 (2.42%) Docker
4 3 (0.66%) VMware Infrastructure
5 2 (0.44%) Hyper-V
6 1 (0.22%) KVM
6 1 (0.22%) Virtual Machines
6 1 (0.22%) VMware ESXi
Systems Management
1 43 (9.45%) Oracle RMAN
2 34 (7.47%) Data Guard
3 18 (3.96%) HP Quality Center
4 8 (1.76%) Oracle Statspack
5 7 (1.54%) Oracle Enterprise Manager
6 5 (1.10%) Kubernetes
7 3 (0.66%) Ansible
7 3 (0.66%) Failover Clustering
7 3 (0.66%) Terraform
Vendors
1 455 (100.00%) Oracle
2 57 (12.53%) Microsoft
3 18 (3.96%) HP
4 12 (2.64%) Google
4 12 (2.64%) MKS
5 11 (2.42%) IBM
6 8 (1.76%) Remedy
6 8 (1.76%) Sun
7 6 (1.32%) Calypso
7 6 (1.32%) Informatica
7 6 (1.32%) SAP
8 5 (1.10%) Siebel
9 4 (0.88%) ESRI
9 4 (0.88%) VMware
10 3 (0.66%) Computacenter
10 3 (0.66%) IFS
10 3 (0.66%) Murex
10 3 (0.66%) Red Hat
10 3 (0.66%) Sybase
11 2 (0.44%) Citrix