Customer Requirements
UK

The following table provides summary statistics for permanent job vacancies with a requirement for Customer Requirements skills. Included is a benchmarking guide to the salaries offered in vacancies that have cited Customer Requirements over the 6 months to 28 November 2023 with a comparison to the same period in the previous 2 years.

6 months to
28 Nov 2023
Same period 2022 Same period 2021
Rank 238 243 310
Rank change year-on-year +5 +67 +18
Permanent jobs citing Customer Requirements 766 1,937 1,501
As % of all permanent jobs advertised in the UK 1.41% 1.54% 1.17%
As % of the Processes & Methodologies category 1.50% 1.61% 1.23%
Number of salaries quoted 485 877 841
10th Percentile £32,700 £33,750 £31,250
25th Percentile £46,000 £43,500 £41,250
Median annual salary (50th Percentile) £55,000 £57,500 £60,000
Median % change year-on-year -4.35% -4.17% +9.09%
75th Percentile £75,000 £75,000 £75,000
90th Percentile £89,500 £90,000 £87,500
UK excluding London median annual salary £54,075 £53,850 £50,000
% change year-on-year +0.42% +7.70% -

All Process and Methodology Skills
UK

Customer Requirements is in the Processes and Methodologies category. The following table is for comparison with the above and provides summary statistics for all permanent job vacancies with a requirement for process or methodology skills.

Permanent vacancies with a requirement for process or methodology skills 51,121 120,104 122,523
As % of all permanent jobs advertised in the UK 94.09% 95.72% 95.43%
Number of salaries quoted 36,956 73,203 81,032
10th Percentile £32,500 £34,313 £32,500
25th Percentile £43,750 £45,000 £42,500
Median annual salary (50th Percentile) £60,000 £60,000 £59,000
Median % change year-on-year - +1.69% +7.27%
75th Percentile £80,000 £81,250 £77,500
90th Percentile £98,750 £100,000 £95,000
UK excluding London median annual salary £52,500 £53,000 £50,000
% change year-on-year -0.94% +6.00% +4.17%

Customer Requirements
Job Vacancy Trend

Job postings citing Customer Requirements as a proportion of all IT jobs advertised.
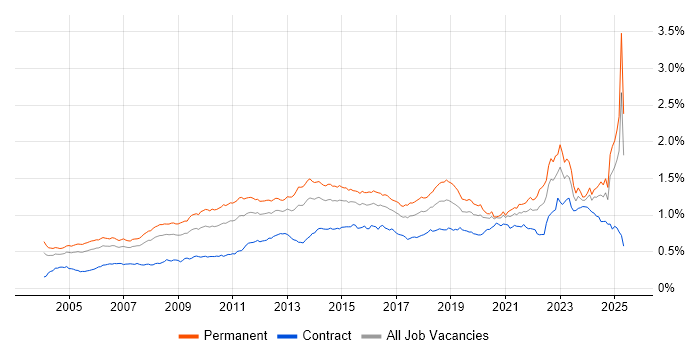
Job vacancy trend for Customer Requirements in the UK

Customer Requirements
Salary Trend

3-month moving average salary quoted in jobs citing Customer Requirements.

Salary trend for Customer Requirements in the UK

Customer Requirements
Salary Histogram

Salary distribution for jobs citing Customer Requirements over the 6 months to 28 November 2023.

Salary histogram for Customer Requirements in the UK

Customer Requirements
Top 17 Job Locations

The table below looks at the demand and provides a guide to the median salaries quoted in IT jobs citing Customer Requirements within the UK over the 6 months to 28 November 2023. The 'Rank Change' column provides an indication of the change in demand within each location based on the same 6 month period last year.

Location Rank Change
on Same Period
Last Year
Matching
Permanent
IT Job Ads
Median Salary
Past 6 Months
Median Salary
% Change
on Same Period
Last Year
Live
Jobs
England +21 696 £55,025 -4.30% 546
UK excluding London -25 562 £54,075 +0.42% 475
Work from Home +80 353 £57,500 -8.00% 186
London +109 164 £75,000 +7.14% 105
South East -30 151 £55,000 - 130
North of England +38 118 £55,000 - 107
South West +31 98 £52,500 +29.63% 52
Midlands +22 95 £50,000 -4.76% 106
North West +107 83 £55,000 +15.79% 60
East of England +50 63 £52,500 -12.50% 53
West Midlands +12 58 £48,750 -22.00% 73
East Midlands +34 37 £50,000 +16.28% 33
Yorkshire -10 30 £55,000 -8.33% 36
Scotland -43 19 £47,557 -2.94% 40
Wales -6 13 £42,960 -21.89% 7
North East +31 5 £55,000 -22.43% 15
Northern Ireland +22 5 £43,750 -20.45% 6

Customer Requirements
Co-occurring Skills and Capabilities by Category

The follow tables expand on the table above by listing co-occurrences grouped by category. The same employment type, locality and period is covered with up to 20 co-occurrences shown in each of the following categories:

Application Platforms
1 10 (1.31%) WinCC
2 8 (1.04%) SharePoint
3 5 (0.65%) CMS
3 5 (0.65%) Umbraco
4 4 (0.52%) Confluence
4 4 (0.52%) OpenStack
5 3 (0.39%) IIS
6 1 (0.13%) Kentico
6 1 (0.13%) MS Exchange
6 1 (0.13%) WebLogic
Applications
1 32 (4.18%) Microsoft Office
2 24 (3.13%) Microsoft Excel
3 15 (1.96%) Microsoft Project
4 9 (1.17%) OrCAD
5 7 (0.91%) Microsoft PowerPoint
5 7 (0.91%) Simulink
6 6 (0.78%) MS Visio
7 5 (0.65%) CANalyzer
7 5 (0.65%) Stateflow
8 4 (0.52%) Adobe Premiere
9 3 (0.39%) AutoCAD
10 1 (0.13%) Spreadsheet
Business Applications
1 25 (3.26%) Remedy ITSM
2 5 (0.65%) Sage X3
3 4 (0.52%) Dynamics CRM
4 3 (0.39%) Dynamics NAV
4 3 (0.39%) SAP S/4HANA
5 2 (0.26%) SAP CO
5 2 (0.26%) SAP FI
5 2 (0.26%) SAP FI/CO
6 1 (0.13%) SAP ERP
6 1 (0.13%) SAP MDG
6 1 (0.13%) SAP Retail
6 1 (0.13%) SAP SD
Cloud Services
1 119 (15.54%) Azure
2 91 (11.88%) SaaS
3 88 (11.49%) AWS
4 46 (6.01%) Azure DevOps
5 34 (4.44%) Power Platform
5 34 (4.44%) Serverless
6 28 (3.66%) Microsoft 365
7 24 (3.13%) GitHub
8 23 (3.00%) GCP
9 18 (2.35%) Dynamics 365
10 13 (1.70%) OpenShift
11 11 (1.44%) PaaS
12 10 (1.31%) IaaS
13 9 (1.17%) Amazon EC2
13 9 (1.17%) Amazon S3
13 9 (1.17%) Azure Logic Apps
13 9 (1.17%) PowerApps
14 6 (0.78%) Azure Service Bus
15 5 (0.65%) Entra ID
15 5 (0.65%) Nutanix
Communications & Networking
1 39 (5.09%) VPN
2 35 (4.57%) WAN
3 31 (4.05%) SSL
4 29 (3.79%) Firewall
5 22 (2.87%) DNS
6 20 (2.61%) DHCP
7 19 (2.48%) SD-WAN
8 18 (2.35%) LAN
8 18 (2.35%) OSPF
9 17 (2.22%) BGP
9 17 (2.22%) MPLS
10 15 (1.96%) Wireless
11 12 (1.57%) Network Security
12 11 (1.44%) 5G
12 11 (1.44%) Software-Defined Networking
13 9 (1.17%) EIGRP
13 9 (1.17%) HTTP
14 8 (1.04%) SNMP
14 8 (1.04%) SSH
14 8 (1.04%) TCP/IP
Database & Business Intelligence
1 25 (3.26%) SQL Server
2 21 (2.74%) Power BI
3 18 (2.35%) NoSQL
4 16 (2.09%) MongoDB
5 15 (1.96%) PostgreSQL
6 13 (1.70%) Relational Database
7 12 (1.57%) Elasticsearch
8 9 (1.17%) Amazon RDS
8 9 (1.17%) Redis
8 9 (1.17%) SQL Server Integration Services
9 7 (0.91%) MySQL
9 7 (0.91%) Oracle Database
10 6 (0.78%) Big Data
10 6 (0.78%) Hadoop
10 6 (0.78%) Metadata
11 5 (0.65%) Crystal Reports
12 4 (0.52%) DynamoDB
12 4 (0.52%) RDBMS
13 2 (0.26%) Oracle Database 12c
13 2 (0.26%) Tableau
Development Applications
1 56 (7.31%) Git
2 45 (5.87%) Jenkins
3 26 (3.39%) JIRA
4 16 (2.09%) Selenium
5 14 (1.83%) Cypress.io
6 13 (1.70%) Rational DOORS
7 12 (1.57%) Cucumber
8 7 (0.91%) SQL Server Management Studio (SSMS)
9 6 (0.78%) Eclipse
9 6 (0.78%) Sonatype Nexus
9 6 (0.78%) Visual Studio
10 5 (0.65%) RequisitePro
10 5 (0.65%) TeamCity
11 4 (0.52%) IntelliJ
11 4 (0.52%) Spinnaker
11 4 (0.52%) Team Foundation Server
11 4 (0.52%) Visual Studio Code
12 3 (0.39%) Bitbucket
12 3 (0.39%) GitLab
13 2 (0.26%) Jasmine
General
1 208 (27.15%) Social Skills
2 84 (10.97%) Finance
3 77 (10.05%) Analytical Skills
4 55 (7.18%) Retail
5 46 (6.01%) Telecoms
6 42 (5.48%) Organisational Skills
7 40 (5.22%) Inclusion and Diversity
8 38 (4.96%) Manufacturing
9 35 (4.57%) Automotive
10 33 (4.31%) Aerospace
10 33 (4.31%) Marketing
11 32 (4.18%) Electronics
11 32 (4.18%) Public Sector
12 27 (3.52%) Presentation Skills
13 19 (2.48%) Banking
14 15 (1.96%) Military
15 13 (1.70%) Documentation Skills
15 13 (1.70%) Legal
16 11 (1.44%) Law
17 6 (0.78%) Influencing Skills
Job Titles
1 175 (22.85%) Senior
2 122 (15.93%) Developer
3 108 (14.10%) Architect
4 78 (10.18%) Consultant
5 66 (8.62%) Lead
6 57 (7.44%) Systems Engineer
7 56 (7.31%) Java Developer
8 52 (6.79%) Analyst
9 42 (5.48%) Network Architect
10 38 (4.96%) Software Engineer
11 37 (4.83%) Project Manager
12 33 (4.31%) Solutions Architect
12 33 (4.31%) Technical Consultant
13 32 (4.18%) Senior Consultant
14 29 (3.79%) ITSM Consultant
15 26 (3.39%) Senior Developer
15 26 (3.39%) Senior Technical Consultant
15 26 (3.39%) ServiceNow Consultant
16 25 (3.26%) Business Analyst
16 25 (3.26%) Design Engineer
Libraries, Frameworks & Software Standards
1 56 (7.31%) CSS
2 55 (7.18%) HTML
3 54 (7.05%) .NET
4 46 (6.01%) SOAP
5 43 (5.61%) Web Services
6 41 (5.35%) Node.js
6 41 (5.35%) XML
7 26 (3.39%) LDAP
7 26 (3.39%) React
8 25 (3.26%) Ajax
9 24 (3.13%) RESTful
10 17 (2.22%) AngularJS
11 12 (1.57%) Next.js
12 11 (1.44%) .NET Framework
13 10 (1.31%) Django
13 10 (1.31%) EDI
13 10 (1.31%) REST
14 9 (1.17%) Memcached
14 9 (1.17%) RabbitMQ
14 9 (1.17%) Sidekiq
Miscellaneous
1 65 (8.49%) Self-Motivation
2 54 (7.05%) Virtual Team
3 28 (3.66%) Product Ownership
4 27 (3.52%) CMDB
5 25 (3.26%) Data Centre
6 20 (2.61%) Management Information System
7 16 (2.09%) Algorithms
7 16 (2.09%) Clustering
8 15 (1.96%) Driving Licence
9 14 (1.83%) Blackberry
9 14 (1.83%) Public Cloud
10 13 (1.70%) Analytical Mindset
10 13 (1.70%) Embedded Systems
10 13 (1.70%) SCADA
11 12 (1.57%) IoT
12 11 (1.44%) Onboarding
13 8 (1.04%) Cloud Native
13 8 (1.04%) Legacy Systems
14 7 (0.91%) Robotics
15 6 (0.78%) Hybrid Cloud
Operating Systems
1 70 (9.14%) Windows
2 44 (5.74%) Linux
3 38 (4.96%) Windows Server
4 15 (1.96%) Unix
5 14 (1.83%) Red Hat Enterprise Linux
6 10 (1.31%) Mac OS
6 10 (1.31%) Windows 7
7 9 (1.17%) Windows 10
8 5 (0.65%) Windows 2000
8 5 (0.65%) Windows Server 2003
9 3 (0.39%) Windows Server 2008
9 3 (0.39%) Windows XP
10 2 (0.26%) Android
10 2 (0.26%) Apple iOS
10 2 (0.26%) Windows Server 2012
10 2 (0.26%) Windows Server 2019
11 1 (0.13%) FreeBSD
11 1 (0.13%) FreeRTOS
11 1 (0.13%) Mac OS X
Processes & Methodologies
1 231 (30.16%) Agile
2 174 (22.72%) Problem-Solving
3 154 (20.10%) Presales
4 142 (18.54%) Project Management
5 101 (13.19%) Actionable Insight
6 100 (13.05%) DevOps
7 93 (12.14%) Project Delivery
8 92 (12.01%) Mentoring
9 90 (11.75%) Software Engineering
10 82 (10.70%) ITIL
11 81 (10.57%) SDLC
12 72 (9.40%) Migration
13 60 (7.83%) Customer Service
14 52 (6.79%) Design Patterns
15 51 (6.66%) People Management
16 50 (6.53%) Computer Science
17 48 (6.27%) ITSM
18 47 (6.14%) Continuous Improvement
18 47 (6.14%) Roadmaps
18 47 (6.14%) Validation
Programming Languages
1 99 (12.92%) Java
2 95 (12.40%) JavaScript
3 70 (9.14%) SQL
4 61 (7.96%) Python
5 53 (6.92%) C#
6 40 (5.22%) C++
7 30 (3.92%) TypeScript
8 28 (3.66%) PowerShell
9 18 (2.35%) C
10 15 (1.96%) Ruby
11 14 (1.83%) VB
12 8 (1.04%) MATLAB
12 8 (1.04%) X++
13 4 (0.52%) Bash
13 4 (0.52%) Groovy
13 4 (0.52%) T-SQL
14 3 (0.39%) Ada
14 3 (0.39%) Assembly Language
14 3 (0.39%) Embedded C
14 3 (0.39%) PL/SQL
Qualifications
1 215 (28.07%) Degree
2 183 (23.89%) Security Cleared
3 100 (13.05%) SC Cleared
4 29 (3.79%) DV Cleared
5 28 (3.66%) CompTIA Security+
6 22 (2.87%) HND
7 21 (2.74%) Computer Science Degree
8 19 (2.48%) Cisco Certification
8 19 (2.48%) HNC
9 17 (2.22%) Chartered Engineer
10 14 (1.83%) BPSS Clearance
10 14 (1.83%) Master's Degree
11 11 (1.44%) CCNP
12 9 (1.17%) PhD
13 8 (1.04%) CCNA
13 8 (1.04%) ITIL Certification
14 7 (0.91%) Microsoft Certification
15 6 (0.78%) CISM
15 6 (0.78%) CISSP
16 5 (0.65%) (ISC)2 CCSP
Quality Assurance & Compliance
1 46 (6.01%) QA
2 23 (3.00%) SLA
3 9 (1.17%) ISO/IEC 27001
4 8 (1.04%) ISO 26262
5 7 (0.91%) PMO
6 6 (0.78%) Data Quality
6 6 (0.78%) ISO 9001
7 5 (0.65%) Automotive SPICE
7 5 (0.65%) Cyber Essentials
7 5 (0.65%) Disclosure Scotland
7 5 (0.65%) NCSC
8 4 (0.52%) GMP
9 3 (0.39%) Accessibility
9 3 (0.39%) Def Stans
9 3 (0.39%) DO-178B
9 3 (0.39%) IEC 61508
9 3 (0.39%) ISO/IEC 20000
10 2 (0.26%) DO-160
10 2 (0.26%) DO-254
10 2 (0.26%) HMG Security Policy Framework
System Software
1 68 (8.88%) Docker
2 45 (5.87%) Active Directory
3 42 (5.48%) VMware Infrastructure
4 22 (2.87%) Firmware
5 16 (2.09%) Hyper-V
6 7 (0.91%) VMware ESXi
7 6 (0.78%) VMware NSX
8 5 (0.65%) vSphere
9 3 (0.39%) vCloud
9 3 (0.39%) Virtual Machines
10 1 (0.13%) Embedded Firmware
10 1 (0.13%) Oracle RAC
10 1 (0.13%) Virtual Desktop
Systems Management
1 43 (5.61%) Kubernetes
2 35 (4.57%) Terraform
3 25 (3.26%) HP UCMDB
4 22 (2.87%) SCCM
5 13 (1.70%) FortiGate
5 13 (1.70%) Puppet
5 13 (1.70%) Tivoli Storage Manager
6 11 (1.44%) Red Hat Satellite
6 11 (1.44%) Tivoli
7 9 (1.17%) Functional Safety
8 8 (1.04%) Ansible
8 8 (1.04%) Microsoft Clustering
9 5 (0.65%) HP Quality Center
9 5 (0.65%) McAfee ePO
9 5 (0.65%) Nagios
9 5 (0.65%) vCenter Server
10 3 (0.39%) NetBackup
10 3 (0.39%) Oracle RMAN
10 3 (0.39%) SCOM
10 3 (0.39%) Wonderware InTouch
Vendors
1 127 (16.58%) Microsoft
2 66 (8.62%) VMware
3 50 (6.53%) ServiceNow
4 45 (5.87%) HP
5 39 (5.09%) Cisco
6 32 (4.18%) BMC
7 27 (3.52%) Oracle
8 26 (3.39%) Red Hat
8 26 (3.39%) SolarWinds
9 25 (3.26%) Remedy
10 19 (2.48%) SAP
11 18 (2.35%) Veritas
12 14 (1.83%) Citrix
12 14 (1.83%) Juniper
12 14 (1.83%) MobileIron
12 14 (1.83%) Samsung
13 13 (1.70%) Google
14 12 (1.57%) EMC
15 10 (1.31%) Siemens
16 9 (1.17%) CheckPoint