Collaborative Working
UK

The following table provides summary statistics for permanent job vacancies with a requirement for Collaborative Working skills. Included is a benchmarking guide to the salaries offered in vacancies that have cited Collaborative Working over the 6 months to 29 November 2023 with a comparison to the same period in the previous 2 years.

6 months to
29 Nov 2023
Same period 2022 Same period 2021
Rank 84 97 158
Rank change year-on-year +13 +61 +31
Permanent jobs citing Collaborative Working 1,944 4,284 3,232
As % of all permanent jobs advertised in the UK 3.59% 3.40% 2.50%
As % of the Processes & Methodologies category 3.82% 3.56% 2.62%
Number of salaries quoted 1,306 2,018 1,947
10th Percentile £25,000 £36,527 £34,650
25th Percentile £28,000 £46,250 £42,500
Median annual salary (50th Percentile) £49,000 £60,000 £57,500
Median % change year-on-year -18.33% +4.35% +4.55%
75th Percentile £70,750 £83,750 £75,000
90th Percentile £90,625 £96,330 £88,750
UK excluding London median annual salary £39,634 £57,500 £52,500
% change year-on-year -31.07% +9.52% +11.70%

All Process and Methodology Skills
UK

Collaborative Working is in the Processes and Methodologies category. The following table is for comparison with the above and provides summary statistics for all permanent job vacancies with a requirement for process or methodology skills.

Permanent vacancies with a requirement for process or methodology skills 50,908 120,439 123,182
As % of all permanent jobs advertised in the UK 94.09% 95.71% 95.44%
Number of salaries quoted 36,868 73,620 81,568
10th Percentile £32,500 £34,459 £32,500
25th Percentile £43,750 £45,000 £42,500
Median annual salary (50th Percentile) £60,000 £60,000 £59,045
Median % change year-on-year - +1.62% +7.35%
75th Percentile £80,000 £81,250 £77,500
90th Percentile £98,825 £100,000 £95,000
UK excluding London median annual salary £52,500 £53,000 £50,000
% change year-on-year -0.94% +6.00% +3.63%

Collaborative Working
Job Vacancy Trend

Job postings citing Collaborative Working as a proportion of all IT jobs advertised.
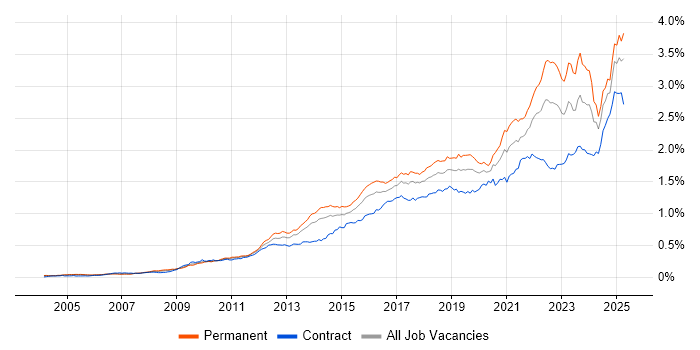
Job vacancy trend for Collaborative Working in the UK

Collaborative Working
Salary Trend

3-month moving average salary quoted in jobs citing Collaborative Working.

Salary trend for Collaborative Working in the UK

Collaborative Working
Salary Histogram

Salary distribution for jobs citing Collaborative Working over the 6 months to 29 November 2023.

Salary histogram for Collaborative Working in the UK

Collaborative Working
Top 17 Job Locations

The table below looks at the demand and provides a guide to the median salaries quoted in IT jobs citing Collaborative Working within the UK over the 6 months to 29 November 2023. The 'Rank Change' column provides an indication of the change in demand within each location based on the same 6 month period last year.

Location Rank Change
on Same Period
Last Year
Matching
Permanent
IT Job Ads
Median Salary
Past 6 Months
Median Salary
% Change
on Same Period
Last Year
Live
Jobs
England +1 1,483 £55,000 -10.57% 1,266
UK excluding London +23 1,371 £39,634 -31.07% 881
Work from Home -37 616 £60,500 -3.20% 513
London -4 464 £72,500 +3.57% 493
Scotland +45 328 £25,000 -58.00% 49
North of England +7 288 £50,000 -13.04% 246
South East +8 259 £55,000 -8.33% 231
Midlands +47 217 £26,500 -51.82% 142
South West -10 167 £47,000 -23.27% 111
West Midlands +48 150 £26,500 -53.91% 84
Yorkshire -3 140 £50,000 -25.13% 67
North West +25 129 £51,000 -9.33% 148
East Midlands +33 67 £28,000 -41.05% 57
East of England -5 54 £47,500 -13.64% 106
Northern Ireland +41 38 £40,000 -5.88% 13
Wales -29 35 £25,000 -57.68% 19
North East +27 19 £42,500 +6.25% 33

Collaborative Working
Co-occurring Skills and Capabilities by Category

The follow tables expand on the table above by listing co-occurrences grouped by category. The same employment type, locality and period is covered with up to 20 co-occurrences shown in each of the following categories:

Application Platforms
1 87 (4.48%) JBoss
1 87 (4.48%) Red Hat Fuse
2 84 (4.32%) SAS
3 34 (1.75%) Confluence
4 14 (0.72%) SharePoint
5 10 (0.51%) Oracle Application Server
6 9 (0.46%) ArcGIS
7 8 (0.41%) OpenEdge
8 7 (0.36%) Apache
8 7 (0.36%) Apache Spark
9 6 (0.31%) WordPress
10 5 (0.26%) Apache Airflow
10 5 (0.26%) CMS
10 5 (0.26%) WebSphere
10 5 (0.26%) WebSphere Application Server
11 4 (0.21%) ArcSDE
12 3 (0.15%) Apache Solr
12 3 (0.15%) IIS
12 3 (0.15%) MS Exchange
12 3 (0.15%) Oracle Workflow
Applications
1 68 (3.50%) Microsoft Excel
2 59 (3.03%) Microsoft Office
3 28 (1.44%) Microsoft PowerPoint
4 21 (1.08%) Microsoft Project
5 11 (0.57%) Sketch
6 7 (0.36%) Adobe Creative Suite
6 7 (0.36%) AutoCAD
7 5 (0.26%) MS Visio
7 5 (0.26%) Spreadsheet
8 4 (0.21%) Autodesk Inventor
8 4 (0.21%) InDesign
9 3 (0.15%) Oracle Smart View
9 3 (0.15%) Photoshop
9 3 (0.15%) SPSS
9 3 (0.15%) Stata
9 3 (0.15%) Trello
10 2 (0.10%) Marvel
10 2 (0.10%) Zeplin
11 1 (0.051%) Adobe Illustrator
11 1 (0.051%) InVision
Business Applications
1 13 (0.67%) Dynamics CRM
2 6 (0.31%) SAP S/4HANA
3 5 (0.26%) Oracle EBS
3 5 (0.26%) ProductWriter
3 5 (0.26%) SystmOne
4 4 (0.21%) Magento
4 4 (0.21%) SAP BPC
5 3 (0.15%) HFM
5 3 (0.15%) Hyperion Planning
6 2 (0.10%) Endur
6 2 (0.10%) Oracle Cash Management
6 2 (0.10%) Oracle ERP
6 2 (0.10%) Oracle General Ledger
6 2 (0.10%) Oracle Payables
6 2 (0.10%) Oracle Receivables
6 2 (0.10%) Payment Gateway
6 2 (0.10%) Primavera
6 2 (0.10%) Remedy ITSM
6 2 (0.10%) Salesforce CRM
6 2 (0.10%) SAP FSCM
Cloud Services
1 343 (17.64%) Azure
2 264 (13.58%) AWS
3 98 (5.04%) Power Platform
4 73 (3.76%) Azure DevOps
5 68 (3.50%) GCP
5 68 (3.50%) SaaS
6 53 (2.73%) GitHub
7 51 (2.62%) IaaS
7 51 (2.62%) Serverless
8 50 (2.57%) PaaS
9 43 (2.21%) Microsoft 365
9 43 (2.21%) OpenShift
10 37 (1.90%) Google Analytics
11 32 (1.65%) AWS Lambda
12 24 (1.23%) Cloud Computing
13 23 (1.18%) Datadog
14 20 (1.03%) PowerApps
15 17 (0.87%) Amazon CloudWatch
16 16 (0.82%) Dynamics 365
16 16 (0.82%) Snowflake
Communications & Networking
1 356 (18.31%) Broadband
2 74 (3.81%) DNS
3 67 (3.45%) DHCP
4 60 (3.09%) TCP/IP
5 51 (2.62%) Firewall
6 49 (2.52%) HTTP
7 40 (2.06%) VPN
8 29 (1.49%) Network Security
9 23 (1.18%) VLAN
10 19 (0.98%) OSPF
11 18 (0.93%) WAN
12 15 (0.77%) SD-WAN
13 14 (0.72%) IPv4
13 14 (0.72%) SAN
13 14 (0.72%) Wi-Fi
14 13 (0.67%) LAN
15 12 (0.62%) Internet
16 9 (0.46%) BGP
16 9 (0.46%) SMS
17 8 (0.41%) SMTP
Database & Business Intelligence
1 90 (4.63%) SQL Server
2 83 (4.27%) Base SAS
3 82 (4.22%) Power BI
4 79 (4.06%) Metadata
5 44 (2.26%) Tableau
6 33 (1.70%) Data Warehouse
7 29 (1.49%) MySQL
8 25 (1.29%) Big Data
9 23 (1.18%) Data Lake
9 23 (1.18%) DynamoDB
10 21 (1.08%) Relational Database
11 20 (1.03%) MongoDB
12 14 (0.72%) Electronic Patient Records
12 14 (0.72%) Star Schema
13 13 (0.67%) SQL Server Integration Services
13 13 (0.67%) SQL Server Reporting Services
14 12 (0.62%) Looker
14 12 (0.62%) Oracle BI EE
14 12 (0.62%) PostgreSQL
15 11 (0.57%) BigQuery
Development Applications
1 88 (4.53%) IntelliJ
2 70 (3.60%) JIRA
3 66 (3.40%) Git
4 32 (1.65%) Jenkins
5 27 (1.39%) GitLab
6 17 (0.87%) Selenium
7 15 (0.77%) Cucumber
8 12 (0.62%) Artifactory
9 7 (0.36%) Sonatype Nexus
10 6 (0.31%) CircleCI
10 6 (0.31%) SonarQube
10 6 (0.31%) SpecFlow
10 6 (0.31%) Visual Studio
11 5 (0.26%) Cypress.io
11 5 (0.26%) git-flow
11 5 (0.26%) IBM UrbanCode
11 5 (0.26%) LoadRunner
11 5 (0.26%) Postman
11 5 (0.26%) TeamCity
11 5 (0.26%) Visual Website Optimizer
General
1 896 (46.09%) Social Skills
2 475 (24.43%) Retail
3 397 (20.42%) Finance
4 376 (19.34%) Telecoms
5 361 (18.57%) Local Government
6 317 (16.31%) Games
7 227 (11.68%) Analytical Skills
8 173 (8.90%) Public Sector
9 168 (8.64%) Inclusion and Diversity
10 160 (8.23%) Banking
11 118 (6.07%) Pharmaceutical
12 110 (5.66%) Marketing
13 109 (5.61%) Aerospace
14 63 (3.24%) Presentation Skills
15 53 (2.73%) Influencing Skills
16 44 (2.26%) Law
16 44 (2.26%) Organisational Skills
17 42 (2.16%) Manufacturing
18 40 (2.06%) Legal
19 25 (1.29%) Advertising
Job Titles
1 320 (16.46%) Senior
2 216 (11.11%) Consultant
3 205 (10.55%) Development Manager
4 201 (10.34%) Developer
5 184 (9.47%) Business Manager
6 183 (9.41%) Business Development Manager
7 177 (9.10%) Enterprise Consultant
8 155 (7.97%) Analyst
9 152 (7.82%) Software Engineer
10 135 (6.94%) Lead
11 117 (6.02%) Architect
12 98 (5.04%) Java Engineer
13 97 (4.99%) Java Software Engineer
14 81 (4.17%) Project Manager
15 78 (4.01%) Senior Software Engineer
16 69 (3.55%) Infrastructure Engineer
17 67 (3.45%) Senior Java Engineer
17 67 (3.45%) Senior Java Software Engineer
18 66 (3.40%) SAS Programmer
18 66 (3.40%) Statistical Programmer
Libraries, Frameworks & Software Standards
1 161 (8.28%) XML
2 132 (6.79%) AngularJS
3 123 (6.33%) JSON
4 119 (6.12%) React
5 116 (5.97%) Spring
6 111 (5.71%) REST
7 106 (5.45%) Web Services
8 102 (5.25%) .NET
9 96 (4.94%) SOAP
10 91 (4.68%) HTML
11 89 (4.58%) Hibernate
12 88 (4.53%) XSD
13 87 (4.48%) JPA
14 86 (4.42%) RESTful
15 78 (4.01%) Java EE
16 65 (3.34%) CSS
17 47 (2.42%) Node.js
18 33 (1.70%) ASP.NET
19 32 (1.65%) React Native
20 28 (1.44%) Middleware
Miscellaneous
1 110 (5.66%) Onboarding
2 101 (5.20%) Product Ownership
3 90 (4.63%) Life Science
4 82 (4.22%) Self-Motivation
5 63 (3.24%) Management Information System
6 37 (1.90%) Mobile App
7 35 (1.80%) Public Cloud
8 31 (1.59%) Virtual Team
9 25 (1.29%) Cloud Native
10 23 (1.18%) Distributed Systems
11 21 (1.08%) Linux Command Line
12 20 (1.03%) Algorithms
12 20 (1.03%) Analytical Mindset
12 20 (1.03%) Greenfield Project
13 19 (0.98%) Data Structures
14 15 (0.77%) Cyberattack
15 14 (0.72%) Hybrid Cloud
15 14 (0.72%) Mainframe
15 14 (0.72%) Security Posture
16 13 (0.67%) Social Media
Operating Systems
1 150 (7.72%) Windows
2 144 (7.41%) Linux
3 42 (2.16%) Red Hat Enterprise Linux
4 35 (1.80%) Windows Server
5 27 (1.39%) Windows 10
6 19 (0.98%) Unix
7 18 (0.93%) Ubuntu
8 15 (0.77%) Apple iOS
9 13 (0.67%) Android
10 12 (0.62%) Windows Server 2016
11 11 (0.57%) Windows Server 2019
12 7 (0.36%) VMS
12 7 (0.36%) Windows Server 2012
13 6 (0.31%) AIX
14 3 (0.15%) CentOS
15 2 (0.10%) Mac OS X
15 2 (0.10%) QNX Neutrino
16 1 (0.051%) Solaris
16 1 (0.051%) Windows Server 2003
16 1 (0.051%) Windows Server 2008
Processes & Methodologies
1 668 (34.36%) Agile
2 593 (30.50%) Problem-Solving
3 519 (26.70%) Decision-Making
4 409 (21.04%) Customer Experience
5 381 (19.60%) B2B
6 365 (18.78%) B2C
7 261 (13.43%) Software Engineering
8 248 (12.76%) Computer Science
9 238 (12.24%) Mentoring
10 229 (11.78%) Project Management
11 223 (11.47%) DevOps
12 222 (11.42%) Business Development
13 204 (10.49%) Actionable Insight
14 177 (9.10%) Project Delivery
15 174 (8.95%) User Experience
16 169 (8.69%) Scrum
17 156 (8.02%) Analytics
18 153 (7.87%) Roadmaps
19 152 (7.82%) Continuous Improvement
20 150 (7.72%) Line Management
Programming Languages
1 293 (15.07%) Java
2 291 (14.97%) Python
3 186 (9.57%) SQL
4 166 (8.54%) C#
5 157 (8.08%) PowerShell
6 152 (7.82%) JavaScript
7 131 (6.74%) Bash
8 83 (4.27%) SAS Macro
9 52 (2.67%) TypeScript
10 31 (1.59%) C++
11 30 (1.54%) PHP
12 20 (1.03%) Ruby
13 19 (0.98%) Bicep
14 17 (0.87%) Shell Script
15 13 (0.67%) VBA
16 11 (0.57%) C
16 11 (0.57%) R
16 11 (0.57%) T-SQL
17 9 (0.46%) Go
17 9 (0.46%) Search Processing Language
Qualifications
1 406 (20.88%) Degree
2 224 (11.52%) Security Cleared
3 180 (9.26%) SC Cleared
4 98 (5.04%) Computer Science Degree
5 61 (3.14%) Master's Degree
6 39 (2.01%) Azure Certification
7 37 (1.90%) Numerate Degree
8 29 (1.49%) AWS Certification
9 26 (1.34%) Cisco Certification
10 22 (1.13%) CISSP
11 18 (0.93%) Microsoft Certification
12 17 (0.87%) DV Cleared
13 14 (0.72%) AWS Certified DevOps Engineer
13 14 (0.72%) BPSS Clearance
13 14 (0.72%) ISTQB
14 13 (0.67%) PMI Certification
15 11 (0.57%) (ISC)2 CCSP
15 11 (0.57%) PhD
15 11 (0.57%) PMP
16 10 (0.51%) CCSP
Quality Assurance & Compliance
1 159 (8.18%) QA
2 83 (4.27%) CDISC
3 35 (1.80%) Data Quality
4 29 (1.49%) Accessibility
5 27 (1.39%) PMO
6 23 (1.18%) ISO/IEC 27001
7 11 (0.57%) NIST
8 9 (0.46%) Good Clinical Practice
9 8 (0.41%) SLA
10 7 (0.36%) COBIT
10 7 (0.36%) GRC
11 6 (0.31%) GDPR
12 5 (0.26%) WCAG
13 4 (0.21%) Cyber Essentials
14 3 (0.15%) Cyber Essentials PLUS
14 3 (0.15%) ISO 20022
15 2 (0.10%) IFRS
15 2 (0.10%) PSD2
15 2 (0.10%) SOC 2
15 2 (0.10%) Software Quality Assurance
System Software
1 126 (6.48%) Docker
2 66 (3.40%) VMware Infrastructure
3 57 (2.93%) Hyper-V
4 54 (2.78%) Active Directory
5 19 (0.98%) Virtual Machines
6 10 (0.51%) Firmware
7 5 (0.26%) VMware ESXi
8 4 (0.21%) DFS Replication
9 3 (0.15%) Oracle RAC
9 3 (0.15%) Slurm Workload Manager
9 3 (0.15%) vSphere
10 1 (0.051%) NFS
10 1 (0.051%) RACF
10 1 (0.051%) Virtual Desktop
10 1 (0.051%) XenApp
10 1 (0.051%) XenDesktop
Systems Management
1 165 (8.49%) Kubernetes
2 108 (5.56%) Ansible
3 105 (5.40%) Terraform
4 74 (3.81%) Puppet
5 26 (1.34%) SCCM
6 23 (1.18%) SCOM
7 17 (0.87%) Istio
8 12 (0.62%) Microsoft Intune
9 11 (0.57%) SCSM
10 10 (0.51%) Argo
10 10 (0.51%) Grafana
10 10 (0.51%) Packer
11 9 (0.46%) NetBackup
11 9 (0.46%) Progress Chef
12 5 (0.26%) FortiGate
12 5 (0.26%) Nagios
13 4 (0.21%) Active Directory Federation Services
13 4 (0.21%) vRealize Orchestrator
14 3 (0.15%) Single Sign-On
14 3 (0.15%) vCenter Server
Vendors
1 355 (18.26%) BT
2 201 (10.34%) Microsoft
3 90 (4.63%) VMware
4 76 (3.91%) Google
5 63 (3.24%) Oracle
6 48 (2.47%) Red Hat
7 33 (1.70%) SAP
8 30 (1.54%) Splunk
9 28 (1.44%) Cisco
10 26 (1.34%) Salesforce
11 22 (1.13%) ServiceNow
12 20 (1.03%) AppDynamics
13 18 (0.93%) Dynatrace
14 16 (0.82%) Adobe
15 13 (0.67%) Juniper
16 11 (0.57%) Databricks
16 11 (0.57%) HP
16 11 (0.57%) Teradata
17 10 (0.51%) New Relic
17 10 (0.51%) Sun