Atlassian Jobs

Atlassian
UK

The table below provides summary statistics for permanent job vacancies requiring knowledge or experience of Atlassian products and/or services. It includes a benchmarking guide to the annual salaries offered in vacancies that cited Atlassian over the 6 months leading up to 23 October 2024, comparing them to the same period in the previous two years.

The figures below represent the IT labour market in general and are not representative of salaries within Atlassian Software Systems.

6 months to
23 Oct 2024
Same period 2023 Same period 2022
Rank 603 527 560
Rank change year-on-year -76 +33 +36
Permanent jobs citing Atlassian 178 241 775
As % of all permanent jobs advertised in the UK 0.24% 0.41% 0.55%
As % of the Vendors category 0.73% 0.97% 1.39%
Number of salaries quoted 107 191 320
10th Percentile £40,750 £46,250 £42,500
25th Percentile £47,500 £57,750 £50,188
Median annual salary (50th Percentile) £62,500 £70,000 £61,000
Median % change year-on-year -10.71% +14.75% +10.91%
75th Percentile £82,500 £81,250 £80,000
90th Percentile £107,500 £95,000 £95,000
UK excluding London median annual salary £58,750 £60,000 £55,000
% change year-on-year -2.08% +9.09% +11.11%

All Vendors
UK

Atlassian falls under the Vendor Products and Services category. For comparison with the information above, the following table provides summary statistics for all permanent job vacancies requiring knowledge or experience of all vendor products and services.

Permanent vacancies with a requirement for knowledge or experience of vendor products and services 24,446 24,905 55,942
As % of all permanent jobs advertised in the UK 32.31% 41.89% 39.81%
Number of salaries quoted 12,032 17,966 30,925
10th Percentile £31,250 £29,500 £31,000
25th Percentile £41,250 £40,000 £41,250
Median annual salary (50th Percentile) £57,000 £56,392 £56,500
Median % change year-on-year +1.08% -0.19% +2.73%
75th Percentile £76,000 £73,750 £77,500
90th Percentile £93,975 £91,250 £93,750
UK excluding London median annual salary £50,000 £50,000 £50,000
% change year-on-year - - +5.26%

Atlassian
Job Vacancy Trend

Job postings citing Atlassian as a proportion of all IT jobs advertised.
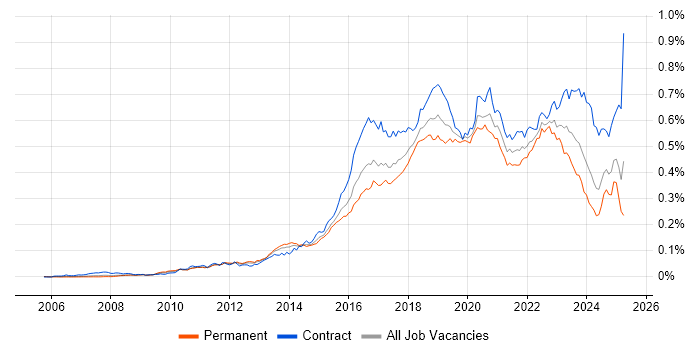
Job vacancy trend for Atlassian in the UK

Atlassian
Salary Trend

3-month moving average salary quoted in jobs citing Atlassian.

Salary trend for Atlassian in the UK

Atlassian
Salary Histogram

Salary distribution for jobs citing Atlassian over the 6 months to 23 October 2024.

Salary histogram for Atlassian in the UK

Atlassian
Top 16 Job Locations

The table below looks at the demand and provides a guide to the median salaries quoted in IT jobs citing Atlassian within the UK over the 6 months to 23 October 2024. The 'Rank Change' column provides an indication of the change in demand within each location based on the same 6 month period last year.

Location Rank Change
on Same Period
Last Year
Matching
Permanent
IT Job Ads
Median Salary
Past 6 Months
Median Salary
% Change
on Same Period
Last Year
Live
Jobs
England -81 173 £62,500 -10.71% 80
UK excluding London -29 112 £58,750 -2.08% 68
Work from Home +39 71 £55,000 -21.43% 218
London -33 64 £70,000 -9.68% 13
South West -3 37 £56,500 +13.00% 17
North of England -15 32 £54,793 -8.68% 9
North West -7 21 £54,793 +4.37% 7
Midlands -19 20 £45,000 -36.84% 9
West Midlands -27 18 £45,000 -36.84% 8
South East -26 15 £80,000 +39.13% 22
Yorkshire +28 11 £42,500 -34.62% 1
East of England -48 8 £62,500 - 6
Scotland -9 2 £61,250 -12.50% 5
East Midlands - 2 - - 1
Northern Ireland - 2 £50,000 - 1
Wales +32 1 £60,000 -14.98%

Atlassian
Co-occurring Skills and Capabilities by Category

The follow tables expand on the table above by listing co-occurrences grouped by category. The same employment type, locality and period is covered with up to 20 co-occurrences shown in each of the following categories:

Application Platforms
1 80 (44.94%) Confluence
2 7 (3.93%) Drupal
2 7 (3.93%) WordPress
3 5 (2.81%) Apache
3 5 (2.81%) Microsoft Exchange
4 3 (1.69%) JBoss
4 3 (1.69%) nginx
5 1 (0.56%) Apache Airflow
5 1 (0.56%) Apache Spark
5 1 (0.56%) IIS
5 1 (0.56%) Mattermost
5 1 (0.56%) SharePoint
Applications
1 7 (3.93%) Trello
2 3 (1.69%) Microsoft Excel
2 3 (1.69%) Microsoft Office
Business Applications
1 7 (3.93%) Dynamics CRM
1 7 (3.93%) Magento
1 7 (3.93%) PlanetPress Connect
2 2 (1.12%) Fidessa
3 1 (0.56%) SAP PP
3 1 (0.56%) SAP S/4HANA
Cloud Services
1 59 (33.15%) AWS
2 30 (16.85%) Azure
3 20 (11.24%) GitHub
4 15 (8.43%) Serverless
5 13 (7.30%) Azure DevOps
6 11 (6.18%) Amazon S3
7 10 (5.62%) AWS CloudFormation
8 9 (5.06%) Amazon EC2
8 9 (5.06%) AWS Lambda
9 8 (4.49%) Amazon EKS
9 8 (4.49%) GitHub Actions
10 7 (3.93%) Google Workspace
10 7 (3.93%) npm
11 6 (3.37%) Azure Data Factory
11 6 (3.37%) Azure Synapse Analytics
11 6 (3.37%) OpenShift
12 5 (2.81%) Azure API Management
12 5 (2.81%) Power Platform
13 4 (2.25%) Microsoft 365
13 4 (2.25%) SaaS
Communications & Networking
1 12 (6.74%) DNS
1 12 (6.74%) Firewall
2 8 (4.49%) Network Security
3 7 (3.93%) DHCP
4 5 (2.81%) RS-232
4 5 (2.81%) RS-422
4 5 (2.81%) Software-Defined Radio
4 5 (2.81%) SSL
4 5 (2.81%) TCP/IP
4 5 (2.81%) VLAN
5 4 (2.25%) Cisco IOS
5 4 (2.25%) LAN
5 4 (2.25%) VPN
6 2 (1.12%) AMQP
6 2 (1.12%) Fibre Channel
6 2 (1.12%) FIX Connectivity
6 2 (1.12%) HTTP
6 2 (1.12%) HTTPS
6 2 (1.12%) iSCSI
6 2 (1.12%) Kerberos
Database & Business Intelligence
1 18 (10.11%) SQL Server
2 15 (8.43%) MongoDB
3 14 (7.87%) PostgreSQL
4 13 (7.30%) Elasticsearch
5 11 (6.18%) Data Warehouse
6 7 (3.93%) Amazon RDS
6 7 (3.93%) Azure SQL Database
6 7 (3.93%) Relational Database
7 5 (2.81%) Power BI
8 4 (2.25%) Data Mining
8 4 (2.25%) DTS
8 4 (2.25%) MySQL
9 3 (1.69%) NoSQL
10 2 (1.12%) Amazon QuickSight
10 2 (1.12%) Amazon Redshift
10 2 (1.12%) Apache Cassandra
10 2 (1.12%) Big Data
10 2 (1.12%) Couchbase
10 2 (1.12%) RDBMS
11 1 (0.56%) DB2
Development Applications
1 103 (57.87%) JIRA
2 41 (23.03%) Jenkins
3 33 (18.54%) Git
4 28 (15.73%) Bitbucket
5 19 (10.67%) SonarQube
6 18 (10.11%) GitLab
6 18 (10.11%) LabVIEW
7 13 (7.30%) Atlassian Bamboo
7 13 (7.30%) NetBeans
7 13 (7.30%) Visual Studio
8 12 (6.74%) Artifactory
9 10 (5.62%) Cucumber
9 10 (5.62%) TeamCity
10 8 (4.49%) AppScan
11 7 (3.93%) JUnit
11 7 (3.93%) SQL Server Management Studio (SSMS)
12 5 (2.81%) CppUnit
12 5 (2.81%) Maven
12 5 (2.81%) Rational DOORS
13 4 (2.25%) Visual Studio Team System
General
1 63 (35.39%) Finance
2 53 (29.78%) Social Skills
3 18 (10.11%) Banking
4 12 (6.74%) Presentation Skills
5 11 (6.18%) Aerospace
5 11 (6.18%) Analytical Skills
6 10 (5.62%) Military
7 8 (4.49%) Retail
8 6 (3.37%) Public Sector
9 5 (2.81%) Electronics
9 5 (2.81%) Organisational Skills
9 5 (2.81%) Telecoms
10 2 (1.12%) Documentation Skills
10 2 (1.12%) Inclusion and Diversity
10 2 (1.12%) Manufacturing
10 2 (1.12%) Publishing
11 1 (0.56%) Health Technology
11 1 (0.56%) Local Government
11 1 (0.56%) Marketing
11 1 (0.56%) Spanish Language
Job Titles
1 29 (16.29%) Senior
2 23 (12.92%) DevOps Engineer
2 23 (12.92%) Software Engineer
3 18 (10.11%) Analyst
4 14 (7.87%) Developer
5 13 (7.30%) Java Engineer
5 13 (7.30%) Lead
6 10 (5.62%) Java Software Engineer
6 10 (5.62%) Security Engineer
7 9 (5.06%) Cloud Engineer
7 9 (5.06%) Project Manager
8 8 (4.49%) Cybersecurity Engineer
8 8 (4.49%) Senior DevOps
8 8 (4.49%) Senior DevOps Engineer
8 8 (4.49%) Senior Security Engineer
8 8 (4.49%) Support Analyst
9 7 (3.93%) Magento Developer
9 7 (3.93%) Platform Engineer
10 6 (3.37%) AWS Engineer
10 6 (3.37%) Product Owner
Libraries, Frameworks & Software Standards
1 16 (8.99%) HTML
2 14 (7.87%) React
2 14 (7.87%) REST
3 13 (7.30%) JavaFX
4 11 (6.18%) CSS
5 10 (5.62%) .NET
5 10 (5.62%) HTML5
6 9 (5.06%) Elastic Stack
7 8 (4.49%) Spring
8 7 (3.93%) GraphQL
8 7 (3.93%) jQuery
8 7 (3.93%) JSON
8 7 (3.93%) KnockoutJS
8 7 (3.93%) Laravel
8 7 (3.93%) RabbitMQ
8 7 (3.93%) Vue
9 6 (3.37%) ASP.NET
10 5 (2.81%) AWS CDK
10 5 (2.81%) Kafka
10 5 (2.81%) OAuth
Miscellaneous
1 16 (8.99%) Product Ownership
2 13 (7.30%) Distributed Systems
3 11 (6.18%) Onboarding
4 9 (5.06%) Enterprise Software
4 9 (5.06%) Public Cloud
5 8 (4.49%) PMI
6 7 (3.93%) Cloud Native
6 7 (3.93%) Management Information System
7 6 (3.37%) CMDB
7 6 (3.37%) Foreign Exchange (FX)
7 6 (3.37%) Virtual Team
8 5 (2.81%) Acoustics
8 5 (2.81%) Data Centre
8 5 (2.81%) Fibre Optics
9 4 (2.25%) Analytical Mindset
9 4 (2.25%) Linux Command Line
10 2 (1.12%) Eurex
10 2 (1.12%) Hybrid Cloud
10 2 (1.12%) IoT
10 2 (1.12%) Smart Meter
Operating Systems
1 43 (24.16%) Linux
2 31 (17.42%) Windows
3 12 (6.74%) Unix
4 7 (3.93%) Mac OS
5 5 (2.81%) Red Hat Enterprise Linux
5 5 (2.81%) VMS
5 5 (2.81%) VxWorks
6 3 (1.69%) Android
7 2 (1.12%) Apple iOS
7 2 (1.12%) CentOS
7 2 (1.12%) Solaris
7 2 (1.12%) Ubuntu
8 1 (0.56%) Windows 10
8 1 (0.56%) Windows Server
8 1 (0.56%) zOS
Processes & Methodologies
1 88 (49.44%) Agile
2 65 (36.52%) CI/CD
3 61 (34.27%) DevOps
4 40 (22.47%) Software Engineering
5 30 (16.85%) Scrum
6 29 (16.29%) Problem-Solving
7 28 (15.73%) SDLC
8 25 (14.04%) Infrastructure as Code
8 25 (14.04%) ITIL
9 21 (11.80%) Cybersecurity
9 21 (11.80%) Microservices
10 20 (11.24%) Stakeholder Management
10 20 (11.24%) Unit Testing
11 19 (10.67%) User Experience
12 18 (10.11%) Artificial Intelligence
12 18 (10.11%) Service Management
13 17 (9.55%) Containerisation
14 16 (8.99%) ITSM
14 16 (8.99%) Project Delivery
15 15 (8.43%) User Stories
Programming Languages
1 67 (37.64%) Python
2 43 (24.16%) Java
3 35 (19.66%) PowerShell
4 32 (17.98%) SQL
5 28 (15.73%) JavaScript
6 18 (10.11%) MATLAB
7 16 (8.99%) TypeScript
8 15 (8.43%) C
8 15 (8.43%) C++
9 14 (7.87%) Bash
10 13 (7.30%) Fortran
10 13 (7.30%) Perl
11 11 (6.18%) C#
11 11 (6.18%) Go
12 8 (4.49%) Shell Script
13 7 (3.93%) Groovy
13 7 (3.93%) PHP
14 4 (2.25%) Data Analysis Expressions
14 4 (2.25%) T-SQL
15 3 (1.69%) Ruby
Qualifications
1 35 (19.66%) Security Cleared
2 32 (17.98%) Degree
3 26 (14.61%) SC Cleared
4 8 (4.49%) CISSP
4 8 (4.49%) PMI Certification
5 7 (3.93%) Computer Science Degree
6 6 (3.37%) DV Cleared
7 5 (2.81%) Network+ Certification
8 4 (2.25%) ACSP
8 4 (2.25%) CCNA
8 4 (2.25%) CCNP
8 4 (2.25%) Cisco Certification
8 4 (2.25%) HNC
9 3 (1.69%) Master's Degree
10 2 (1.12%) AWS Certification
10 2 (1.12%) Azure Certification
10 2 (1.12%) CSPO
10 2 (1.12%) DBS Check
10 2 (1.12%) ISEB
10 2 (1.12%) RHCSA
Quality Assurance & Compliance
1 20 (11.24%) QA
2 14 (7.87%) ISO 9001
3 10 (5.62%) ISO/IEC 27001
4 8 (4.49%) Cyber Essentials
4 8 (4.49%) PCI DSS
4 8 (4.49%) TickIT
5 7 (3.93%) NIST
5 7 (3.93%) SLA
6 5 (2.81%) Def Stans
6 5 (2.81%) GDPR
6 5 (2.81%) IEC 61508
7 3 (1.69%) Data Quality
8 1 (0.56%) Accessibility
8 1 (0.56%) ISO 13485
8 1 (0.56%) ISO 20022
System Software
1 20 (11.24%) Docker
2 3 (1.69%) Active Directory
2 3 (1.69%) Firmware
2 3 (1.69%) Virtual Desktop
2 3 (1.69%) VMware Infrastructure
3 2 (1.12%) NFS
3 2 (1.12%) Virtual Machines
3 2 (1.12%) VMware ESXi
4 1 (0.56%) Hyper-V
Systems Management
1 37 (20.79%) Ansible
2 36 (20.22%) Kubernetes
3 29 (16.29%) Terraform
4 19 (10.67%) Progress Chef
4 19 (10.67%) Puppet
5 8 (4.49%) Kibana
6 6 (3.37%) Grafana
7 5 (2.81%) Packer
7 5 (2.81%) Prometheus
7 5 (2.81%) Single Sign-On
8 4 (2.25%) Jamf Pro
9 3 (1.69%) Active Directory Federation Services
9 3 (1.69%) Nagios
10 2 (1.12%) Docker Swarm
10 2 (1.12%) Opsgenie
10 2 (1.12%) Red Hat Satellite
11 1 (0.56%) logstash
11 1 (0.56%) Rancher
Vendors
1 21 (11.80%) Microsoft
2 13 (7.30%) Red Hat
3 9 (5.06%) Splunk
4 8 (4.49%) ArcSight
4 8 (4.49%) Carbon Black
4 8 (4.49%) CyberArk
4 8 (4.49%) Google
4 8 (4.49%) McAfee
4 8 (4.49%) Oracle
4 8 (4.49%) Qualys
5 7 (3.93%) FNZ
5 7 (3.93%) Salesforce
6 6 (3.37%) IBM
7 5 (2.81%) AppDynamics
7 5 (2.81%) Cisco
7 5 (2.81%) Databricks
7 5 (2.81%) Palo Alto
8 4 (2.25%) Apple
8 4 (2.25%) Okta
8 4 (2.25%) VMware