IoT (Internet of Things, Internet of Everything)
UK

The table below looks at the prevalence of the term IoT in permanent job vacancies. Included is a benchmarking guide to the salaries offered in vacancies that have cited IoT over the 6 months to 7 December 2023 with a comparison to the same period over the previous 2 years.

6 months to
7 Dec 2023
Same period 2022 Same period 2021
Rank 406 390 267
Rank change year-on-year -16 -123 +48
Permanent jobs citing IoT 361 1,008 1,760
As % of all permanent jobs advertised in the UK 0.68% 0.82% 1.37%
As % of the Miscellaneous category 1.85% 1.91% 3.12%
Number of salaries quoted 286 603 1,089
10th Percentile £40,000 £38,850 £37,500
25th Percentile £52,500 £51,500 £47,500
Median annual salary (50th Percentile) £65,000 £67,500 £62,500
Median % change year-on-year -3.70% +8.00% +4.17%
75th Percentile £76,250 £85,000 £83,750
90th Percentile £94,375 £95,000 £95,000
UK excluding London median annual salary £60,000 £62,500 £53,000
% change year-on-year -4.00% +17.92% -3.64%

All Generic Skills
UK

IoT is in the General and Transferable Skills category. The following table is for comparison with the above and provides summary statistics for all permanent job vacancies with a requirement for generic IT skills.

Permanent vacancies with a requirement for generic IT skills 19,511 52,884 56,385
As % of all permanent jobs advertised in the UK 36.83% 43.05% 44.00%
Number of salaries quoted 14,245 29,698 33,809
10th Percentile £33,000 £35,000 £33,750
25th Percentile £45,000 £46,250 £45,000
Median annual salary (50th Percentile) £62,500 £64,750 £60,000
Median % change year-on-year -3.47% +7.92% -
75th Percentile £83,750 £85,000 £82,500
90th Percentile £107,500 £106,000 £100,000
UK excluding London median annual salary £55,000 £55,000 £50,000
% change year-on-year - +10.00% -

IoT
Job Vacancy Trend

Job postings citing IoT as a proportion of all IT jobs advertised.
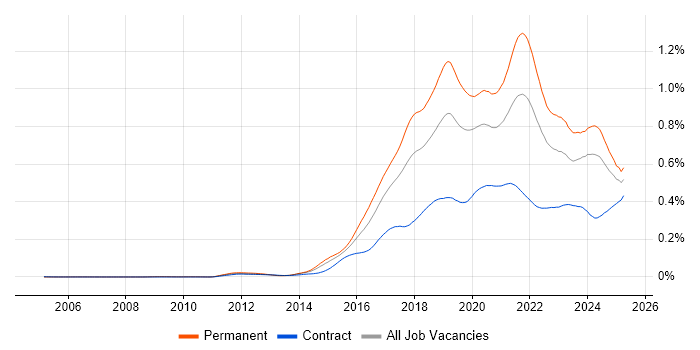
Job vacancy trend for IoT in the UK

IoT
Salary Trend

3-month moving average salary quoted in jobs citing IoT.

Salary trend for IoT in the UK

IoT
Salary Histogram

Salary distribution for jobs citing IoT over the 6 months to 7 December 2023.

Salary histogram for IoT in the UK

IoT
Top 16 Job Locations

The table below looks at the demand and provides a guide to the median salaries quoted in IT jobs citing IoT within the UK over the 6 months to 7 December 2023. The 'Rank Change' column provides an indication of the change in demand within each location based on the same 6 month period last year.

Location Rank Change
on Same Period
Last Year
Matching
Permanent
IT Job Ads
Median Salary
Past 6 Months
Median Salary
% Change
on Same Period
Last Year
Live
Jobs
England +16 327 £65,000 -3.70% 322
UK excluding London +8 248 £60,000 -4.00% 240
Work from Home -17 125 £62,500 -3.85% 191
South East +119 87 £60,000 +9.09% 84
London +110 82 £70,000 -9.68% 97
East of England +40 47 £55,000 - 38
North of England +20 39 £63,000 -6.67% 35
Midlands +83 30 £65,000 +13.04% 35
South West +37 30 £65,000 - 39
North West +50 29 £66,500 -11.33% 10
West Midlands +86 19 £37,500 -41.57% 20
Scotland +5 12 £60,000 +9.09% 11
East Midlands +46 11 £65,000 +23.81% 15
Yorkshire +40 9 £55,000 -15.38% 11
Wales +16 3 £52,500 - 6
North East +40 1 £40,000 -23.81% 14

IoT
Co-occurring Skills and Capabilities by Category

The follow tables expand on the table above by listing co-occurrences grouped by category. The same employment type, locality and period is covered with up to 20 co-occurrences shown in each of the following categories:

Application Platforms
1 11 (3.05%) Apache Spark
2 9 (2.49%) Confluence
3 5 (1.39%) SharePoint
4 4 (1.11%) Apache
5 3 (0.83%) Apache Solr
5 3 (0.83%) Drupal
5 3 (0.83%) MS Exchange
6 2 (0.55%) CMS
6 2 (0.55%) ThingWorx
7 1 (0.28%) Apache Airflow
7 1 (0.28%) IBM Domino
Applications
1 7 (1.94%) Microsoft Office
2 6 (1.66%) Microsoft Excel
3 3 (0.83%) Chatbot
3 3 (0.83%) Simulink
4 2 (0.55%) Acrobat
4 2 (0.55%) OrCAD
5 1 (0.28%) Microsoft PowerPoint
5 1 (0.28%) MS Visio
Business Applications
1 13 (3.60%) SAP S/4HANA
1 13 (3.60%) SAP SCM
2 9 (2.49%) Dynamics CRM
3 3 (0.83%) Oracle Receivables
3 3 (0.83%) Sage X3
4 1 (0.28%) Dynamics GP
4 1 (0.28%) Dynamics NAV
4 1 (0.28%) Epicor Tropos
4 1 (0.28%) Teamcenter
Cloud Services
1 101 (27.98%) Azure
2 63 (17.45%) AWS
3 38 (10.53%) Serverless
4 29 (8.03%) Power Platform
5 27 (7.48%) Azure DevOps
6 17 (4.71%) Azure Service Bus
6 17 (4.71%) GCP
7 13 (3.60%) AWS IoT
7 13 (3.60%) GitHub
8 12 (3.32%) Azure Synapse Analytics
8 12 (3.32%) IaaS
8 12 (3.32%) PaaS
9 11 (3.05%) SaaS
10 10 (2.77%) Amazon Kinesis
10 10 (2.77%) AWS Lambda
10 10 (2.77%) Dynamics 365
11 9 (2.49%) PowerApps
12 8 (2.22%) Power Automate
13 7 (1.94%) Azure Data Factory
13 7 (1.94%) Cloud Computing
Communications & Networking
1 62 (17.17%) Internet
2 14 (3.88%) Modbus
3 13 (3.60%) LAN
3 13 (3.60%) Network Security
3 13 (3.60%) Wireless
4 12 (3.32%) Firewall
4 12 (3.32%) TCP/IP
5 11 (3.05%) DNS
6 10 (2.77%) MQTT
7 8 (2.22%) VPN
7 8 (2.22%) WAN
8 7 (1.94%) Ethernet
9 6 (1.66%) HTTP
9 6 (1.66%) Wi-Fi
10 5 (1.39%) BGP
10 5 (1.39%) Bluetooth
10 5 (1.39%) LTE
10 5 (1.39%) OSPF
11 4 (1.11%) 3G
11 4 (1.11%) Broadband
Database & Business Intelligence
1 27 (7.48%) SQL Server
2 19 (5.26%) Azure SQL Database
3 16 (4.43%) MySQL
4 13 (3.60%) NoSQL
5 12 (3.32%) Big Data
5 12 (3.32%) PostgreSQL
6 11 (3.05%) Power BI
7 8 (2.22%) Data Lake
7 8 (2.22%) SQL Server Integration Services
8 4 (1.11%) Geospatial Data
9 3 (0.83%) Data Warehouse
9 3 (0.83%) Delta Lake
9 3 (0.83%) Firebird
9 3 (0.83%) MongoDB
10 2 (0.55%) Data Vault
10 2 (0.55%) GIS
10 2 (0.55%) Metadata
10 2 (0.55%) Parquet
10 2 (0.55%) Relational Database
11 1 (0.28%) Amazon Redshift
Development Applications
1 62 (17.17%) Git
2 21 (5.82%) JIRA
3 20 (5.54%) Jenkins
4 8 (2.22%) Subversion
5 7 (1.94%) Bitbucket
6 3 (0.83%) Eclipse
6 3 (0.83%) Maven
6 3 (0.83%) SonarQube
7 2 (0.55%) Burp Suite
7 2 (0.55%) SoapUI
7 2 (0.55%) Visual Studio
8 1 (0.28%) Android Studio
8 1 (0.28%) Atlassian Bamboo
8 1 (0.28%) Mercurial
8 1 (0.28%) Selenium
8 1 (0.28%) Team Foundation Server
General
1 84 (23.27%) Social Skills
2 71 (19.67%) Analytical Skills
3 50 (13.85%) Electronics
4 39 (10.80%) Manufacturing
5 34 (9.42%) Retail
6 29 (8.03%) Finance
7 22 (6.09%) Automotive
8 19 (5.26%) Presentation Skills
8 19 (5.26%) Telecoms
9 18 (4.99%) Multimedia
10 17 (4.71%) Marketing
11 14 (3.88%) Aerospace
11 14 (3.88%) Tech for Good
12 13 (3.60%) Legal
13 12 (3.32%) Local Government
14 10 (2.77%) Public Sector
14 10 (2.77%) Social Housing
15 8 (2.22%) Inclusion and Diversity
16 5 (1.39%) Games
17 4 (1.11%) Billing
Job Titles
1 75 (20.78%) Developer
2 67 (18.56%) Senior
3 39 (10.80%) Software Engineer
4 36 (9.97%) Architect
5 29 (8.03%) Consultant
5 29 (8.03%) Lead
6 21 (5.82%) Embedded Engineer
7 17 (4.71%) Data Scientist
8 16 (4.43%) Analyst
8 16 (4.43%) Software Developer
9 13 (3.60%) Infrastructure Engineer
9 13 (3.60%) Solutions Architect
10 12 (3.32%) Applications Developer
10 12 (3.32%) SAP Consultant
10 12 (3.32%) SAP Supply Chain Consultant
10 12 (3.32%) Supply Chain Consultant
11 11 (3.05%) Graphics Engineer
11 11 (3.05%) Lead Developer
11 11 (3.05%) Performance Engineer
12 10 (2.77%) Senior Developer
Libraries, Frameworks & Software Standards
1 35 (9.70%) .NET
2 32 (8.86%) REST
3 25 (6.93%) React
4 24 (6.65%) Node.js
5 22 (6.09%) HTML
6 20 (5.54%) CSS
7 19 (5.26%) AngularJS
7 19 (5.26%) OpenGL
7 19 (5.26%) Vulkan
8 18 (4.99%) Direct3D
8 18 (4.99%) OpenGL ES
9 13 (3.60%) SAPUI5
10 10 (2.77%) Twitter Bootstrap
10 10 (2.77%) Yocto
11 9 (2.49%) Spring
12 8 (2.22%) ASP.NET Web API
13 7 (1.94%) Kafka
13 7 (1.94%) Pandas
13 7 (1.94%) TensorFlow
13 7 (1.94%) Vue
Miscellaneous
1 21 (5.82%) Low-Code
2 20 (5.54%) Algorithms
2 20 (5.54%) Embedded Systems
3 19 (5.26%) Mali
4 18 (4.99%) 3D Graphics
4 18 (4.99%) Smartphone
5 17 (4.71%) Operational Technology
6 15 (4.16%) Data Centre
6 15 (4.16%) Mobile App
6 15 (4.16%) SCADA
7 12 (3.32%) Management Information System
7 12 (3.32%) Self-Motivation
8 11 (3.05%) Smart Home
9 10 (2.77%) Housing Association
10 9 (2.49%) Smart Meter
11 8 (2.22%) Industrial Internet of Things
11 8 (2.22%) Virtual Team
12 7 (1.94%) Augmented Reality
12 7 (1.94%) CAN bus
12 7 (1.94%) Smart City
Operating Systems
1 39 (10.80%) Linux
2 35 (9.70%) Android
3 24 (6.65%) Windows
4 11 (3.05%) Apple iOS
5 7 (1.94%) Windows Server
6 6 (1.66%) Debian
6 6 (1.66%) Embedded Linux
7 4 (1.11%) FreeRTOS
8 3 (0.83%) Red Hat Enterprise Linux
8 3 (0.83%) Windows 10
9 2 (0.55%) Mac OS
9 2 (0.55%) Mac OS X
10 1 (0.28%) Unix
10 1 (0.28%) VMS
Processes & Methodologies
1 113 (31.30%) Agile
2 81 (22.44%) Problem-Solving
3 70 (19.39%) Software Engineering
4 67 (18.56%) Artificial Intelligence
5 62 (17.17%) Machine Learning
6 56 (15.51%) Computer Science
7 53 (14.68%) DevOps
8 51 (14.13%) Roadmaps
9 43 (11.91%) Analytics
10 42 (11.63%) Mentoring
11 37 (10.25%) Microservices
12 36 (9.97%) Cybersecurity
13 26 (7.20%) Business Intelligence
13 26 (7.20%) Stakeholder Management
14 25 (6.93%) Customer Experience
15 24 (6.65%) Data Science
15 24 (6.65%) Decision-Making
15 24 (6.65%) Embedded Software Development
15 24 (6.65%) Prototyping
16 23 (6.37%) User Experience
Programming Languages
1 70 (19.39%) Python
2 64 (17.73%) SQL
3 58 (16.07%) C++
4 53 (14.68%) C#
5 51 (14.13%) C
6 39 (10.80%) JavaScript
7 27 (7.48%) TypeScript
8 24 (6.65%) Java
9 13 (3.60%) PHP
10 8 (2.22%) R
11 6 (1.66%) Bash
12 5 (1.39%) Go
13 4 (1.11%) Embedded C
13 4 (1.11%) Perl
13 4 (1.11%) PowerShell
14 3 (0.83%) Dart
14 3 (0.83%) Rust
15 1 (0.28%) Bicep
15 1 (0.28%) Kotlin
15 1 (0.28%) Swift
Qualifications
1 73 (20.22%) Degree
2 34 (9.42%) Security Cleared
3 30 (8.31%) SC Cleared
4 27 (7.48%) Master's Degree
5 23 (6.37%) PhD
6 18 (4.99%) Computer Science Degree
7 13 (3.60%) Cisco Certification
8 9 (2.49%) AWS Certification
8 9 (2.49%) Azure Certification
8 9 (2.49%) CISSP
8 9 (2.49%) Microsoft Certification
8 9 (2.49%) OSCP
9 8 (2.22%) SANS
10 7 (1.94%) CISM
11 6 (1.66%) CCNA
11 6 (1.66%) CEH
11 6 (1.66%) GIAC
11 6 (1.66%) ISACA
11 6 (1.66%) ISSAP
12 5 (1.39%) CCSP
Quality Assurance & Compliance
1 11 (3.05%) Data Quality
1 11 (3.05%) NIST
1 11 (3.05%) QA
2 8 (2.22%) Cyber Essentials
3 7 (1.94%) NIST 800
4 6 (1.66%) Cyber Essentials PLUS
4 6 (1.66%) GDPR
4 6 (1.66%) IASME
5 5 (1.39%) ISO/IEC 27001
5 5 (1.39%) SLA
6 3 (0.83%) ISO 9001
6 3 (0.83%) ISO/IEC 17025
7 2 (0.55%) COBIT
7 2 (0.55%) ISA99
7 2 (0.55%) MISRA
7 2 (0.55%) MISRA C
8 1 (0.28%) DO-178B
8 1 (0.28%) IEC 62304
8 1 (0.28%) ISO 13485
8 1 (0.28%) ISO 31000
System Software
1 31 (8.59%) Firmware
2 17 (4.71%) Active Directory
3 14 (3.88%) Docker
4 12 (3.32%) Embedded Firmware
5 10 (2.77%) VMware Infrastructure
6 4 (1.11%) Virtual Machines
7 2 (0.55%) Virtual Desktop
8 1 (0.28%) BitLocker
8 1 (0.28%) HDFS
Systems Management
1 15 (4.16%) Terraform
2 8 (2.22%) Kubernetes
3 6 (1.66%) Ansible
4 4 (1.11%) Microsoft Intune
4 4 (1.11%) SCCM
5 3 (0.83%) Nagios
5 3 (0.83%) ZABBIX
6 2 (0.55%) Wonderware InTouch
6 2 (0.55%) XenMobile
7 1 (0.28%) Apache Ranger
7 1 (0.28%) Hadoop YARN
7 1 (0.28%) Single Sign-On
7 1 (0.28%) SysTrack
Vendors
1 65 (18.01%) Microsoft
2 23 (6.37%) SAP
3 14 (3.88%) VMware
4 13 (3.60%) Databricks
5 12 (3.32%) Cisco
6 9 (2.49%) Google
7 8 (2.22%) Apple
7 8 (2.22%) Oracle
8 4 (1.11%) AVEVA
8 4 (1.11%) Cadence
8 4 (1.11%) Meraki
8 4 (1.11%) Red Hat
9 3 (0.83%) Citrix
9 3 (0.83%) Dell
9 3 (0.83%) EMC
9 3 (0.83%) HP
9 3 (0.83%) IBM
9 3 (0.83%) MicroStrategy
9 3 (0.83%) Renesas
9 3 (0.83%) Sage