Algorithms Job Trends

Algorithms
UK

The table below looks at the prevalence of the term Algorithms in permanent job vacancies. Included is a benchmarking guide to the salaries offered in vacancies that cited Algorithms over the 6 months leading up to 19 September 2025, comparing them to the same period in the previous two years.

6 months to
19 Sep 2025
Same period 2024 Same period 2023
Rank 242 160 304
Rank change year-on-year -82 +144 -167
Permanent jobs citing Algorithms 652 1,261 663
As % of all permanent jobs advertised in the UK 1.32% 1.61% 1.10%
As % of the Miscellaneous category 3.21% 5.01% 2.68%
Number of salaries quoted 255 426 495
10th Percentile £37,424 £39,500 £42,500
25th Percentile £47,500 £50,030 £52,293
Median annual salary (50th Percentile) £70,000 £65,000 £72,500
Median % change year-on-year +7.69% -10.34% -3.33%
75th Percentile £105,625 £82,500 £93,750
90th Percentile £132,000 £100,000 £130,000
UK excluding London median annual salary £57,500 £60,000 £60,000
% change year-on-year -4.17% - -4.00%

All Generic Skills
UK

Algorithms falls under the General and Transferable Skills category. For comparison with the information above, the following table provides summary statistics for all permanent job vacancies requiring generic IT skills.

Permanent vacancies with a requirement for generic IT skills 20,295 25,146 24,743
As % of all permanent jobs advertised in the UK 41.06% 32.18% 40.91%
Number of salaries quoted 10,205 13,092 17,891
10th Percentile £28,750 £31,250 £35,000
25th Percentile £36,925 £43,116 £46,250
Median annual salary (50th Percentile) £55,000 £60,000 £62,500
Median % change year-on-year -8.33% -4.00% -
75th Percentile £77,500 £82,500 £84,056
90th Percentile £105,000 £110,000 £107,500
UK excluding London median annual salary £47,500 £52,500 £55,000
% change year-on-year -9.52% -4.55% +4.76%

Algorithms
Job Vacancy Trend

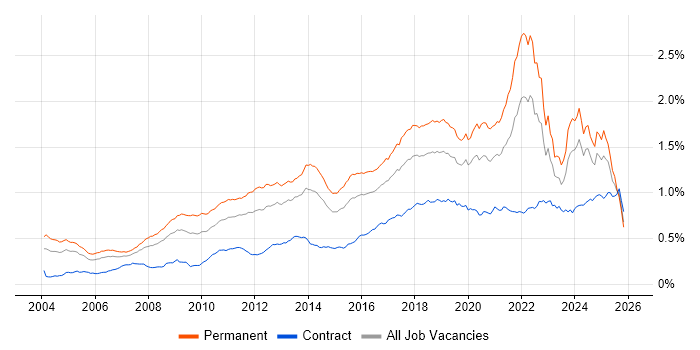
Job postings citing Algorithms as a proportion of all IT jobs advertised.

Job vacancy trend for Algorithms in the UK

Algorithms
Salary Trend

Salary distribution trend for jobs in the UK citing Algorithms.

Salary distribution trend for jobs in the UK citing Algorithms

Algorithms
Salary Histogram

Salary distribution for jobs citing Algorithms over the 6 months to 19 September 2025.

Salary histogram for Algorithms in the UK

Algorithms
Top 16 Job Locations

The table below looks at the demand and provides a guide to the median salaries quoted in IT jobs citing Algorithms within the UK over the 6 months to 19 September 2025. The 'Rank Change' column provides an indication of the change in demand within each location based on the same 6 month period last year.

Location Rank Change
on Same Period
Last Year
Matching
Permanent
IT Job Ads
Median Salary
Past 6 Months
Median Salary
% Change
on Same Period
Last Year
Live
Jobs
England -41 535 £70,600 +12.96% 520
UK excluding London -102 345 £57,500 -4.17% 338
London +49 276 £108,750 +35.94% 258
Work from Home -44 155 £70,600 +8.62% 223
South East -70 116 £62,000 +3.33% 121
Scotland -33 86 £57,500 -11.54% 28
East of England +3 63 £55,000 -8.33% 58
South West +30 33 £62,575 +13.77% 45
North of England -52 23 £45,000 -20.37% 57
Midlands -51 17 £60,000 +4.35% 33
North West -74 13 £45,000 -20.37% 27
West Midlands +5 9 £55,000 -4.35% 21
Wales +20 7 £69,300 -1.00% 1
Yorkshire +10 7 £35,000 +11.11% 23
East Midlands -36 6 £45,500 -17.65% 10
North East - 3 £115,000 - 7

Algorithms
Co-occurring Skills and Capabilities by Category

The follow tables expand on the table above by listing co-occurrences grouped by category. The same employment type, locality and period is covered with up to 20 co-occurrences shown in each of the following categories:

Application Platforms
1 24 (3.68%) Apache Spark
1 24 (3.68%) Kinematics
2 13 (1.99%) CMS
3 11 (1.69%) Apache
3 11 (1.69%) Apache Airflow
4 8 (1.23%) Camunda
4 8 (1.23%) Oracle Workflow
5 6 (0.92%) WordPress
6 4 (0.61%) Tomcat
6 4 (0.61%) Umbraco
7 3 (0.46%) Kentico
7 3 (0.46%) Microsoft Exchange
8 2 (0.31%) Luigi
9 1 (0.15%) Jupyter
9 1 (0.15%) nginx
9 1 (0.15%) SharePoint
Applications
1 11 (1.69%) Microsoft Excel
1 11 (1.69%) Simulink
2 8 (1.23%) Blender
3 5 (0.77%) Microsoft Office
3 5 (0.77%) Microsoft PowerPoint
4 3 (0.46%) Chatbot
4 3 (0.46%) Mathcad
4 3 (0.46%) MS Visio
5 2 (0.31%) Adobe Illustrator
5 2 (0.31%) Adobe Premiere
5 2 (0.31%) Photoshop
5 2 (0.31%) Spreadsheet
6 1 (0.15%) Final Cut Pro
6 1 (0.15%) GNU Octave
6 1 (0.15%) InDesign
6 1 (0.15%) OrCAD
Business Applications
1 3 (0.46%) Remedy ITSM
1 3 (0.46%) Shopify
2 2 (0.31%) Dynamics CRM
3 1 (0.15%) Raiser’s Edge
Cloud Services
1 102 (15.64%) AWS
2 79 (12.12%) Azure
3 38 (5.83%) GCP
4 34 (5.21%) Google Analytics
5 24 (3.68%) Vertex AI
6 23 (3.53%) Power Platform
7 15 (2.30%) Amazon S3
8 10 (1.53%) Amazon EKS
9 9 (1.38%) SaaS
10 8 (1.23%) Azure Data Factory
10 8 (1.23%) Azure Machine Learning
11 7 (1.07%) Amazon SageMaker
11 7 (1.07%) Cloud Computing
11 7 (1.07%) npm
11 7 (1.07%) Yarn
12 6 (0.92%) Azure AI
12 6 (0.92%) Google Sheets
12 6 (0.92%) Google Workspace
12 6 (0.92%) Microsoft Copilot
12 6 (0.92%) Serverless
Communications & Networking
1 10 (1.53%) WAN
2 8 (1.23%) 5G
2 8 (1.23%) Multicast
2 8 (1.23%) SD-WAN
3 5 (0.77%) Software-Defined Radio
4 4 (0.61%) Internet
4 4 (0.61%) MQTT
5 3 (0.46%) Bluetooth
5 3 (0.46%) S/MIME
5 3 (0.46%) SSL
5 3 (0.46%) X.509
6 2 (0.31%) Ethernet
6 2 (0.31%) LoRaWAN
6 2 (0.31%) Modbus
6 2 (0.31%) Wireless
Database & Business Intelligence
1 51 (7.82%) NoSQL
2 29 (4.45%) Big Data
3 28 (4.29%) PostgreSQL
4 26 (3.99%) MongoDB
5 25 (3.83%) Relational Database
6 24 (3.68%) Data Mining
7 23 (3.53%) Power BI
8 14 (2.15%) Apache Cassandra
8 14 (2.15%) MySQL
9 13 (1.99%) Metadata
10 12 (1.84%) Data Lake
10 12 (1.84%) DB2
10 12 (1.84%) KDB
11 10 (1.53%) Amazon Athena
11 10 (1.53%) Looker
11 10 (1.53%) Tableau
12 8 (1.23%) QGIS
12 8 (1.23%) RDBMS
13 7 (1.07%) Oracle Database
13 7 (1.07%) Parquet
Development Applications
1 47 (7.21%) Rational DOORS
2 27 (4.14%) Git
3 18 (2.76%) JIRA
4 14 (2.15%) JUnit
4 14 (2.15%) Vite
5 9 (1.38%) Cypress.io
6 8 (1.23%) GitLab
6 8 (1.23%) webpack
7 7 (1.07%) Jenkins
7 7 (1.07%) MLflow
8 5 (0.77%) Bazaar
9 3 (0.46%) Selenium
9 3 (0.46%) Visual Studio
10 2 (0.31%) JConsole
10 2 (0.31%) TestRail
10 2 (0.31%) VisualVM
11 1 (0.15%) Karma Test Runner
11 1 (0.15%) Protractor
11 1 (0.15%) RStudio
11 1 (0.15%) WebDriver
General
1 254 (38.96%) Finance
2 211 (32.36%) Law
3 159 (24.39%) Inclusion and Diversity
4 154 (23.62%) Social Skills
5 117 (17.94%) Analytical Skills
6 115 (17.64%) Marketing
7 113 (17.33%) Banking
8 92 (14.11%) Electronics
9 47 (7.21%) Games
10 42 (6.44%) Front Office
11 34 (5.21%) Retail
12 26 (3.99%) Investment Banking
13 21 (3.22%) Advertising
13 21 (3.22%) Presentation Skills
14 18 (2.76%) Public Sector
15 15 (2.30%) Organisational Skills
16 14 (2.15%) Legal
17 13 (1.99%) Manufacturing
18 11 (1.69%) Telecoms
19 10 (1.53%) Financial Institution
Job Titles
1 173 (26.53%) Software Engineer
2 121 (18.56%) Senior
3 91 (13.96%) Lead
4 82 (12.58%) Developer
5 68 (10.43%) Java Engineer
6 67 (10.28%) Java Software Engineer
7 55 (8.44%) Systems Engineer
8 40 (6.13%) Full-Stack Engineer
9 39 (5.98%) Principal Engineer
10 37 (5.67%) Python Engineer
11 36 (5.52%) Python Software Engineer
11 36 (5.52%) Quantitative Developer
12 35 (5.37%) Senior Software Engineer
13 33 (5.06%) Principal Systems Engineer
14 32 (4.91%) Artificial Intelligence Engineer
15 29 (4.45%) Data Scientist
16 28 (4.29%) Full-Stack Software Engineer
17 25 (3.83%) Robotics Engineer
18 24 (3.68%) Senior Developer
19 23 (3.53%) Java Developer
Libraries, Frameworks & Software Standards
1 68 (10.43%) React
2 59 (9.05%) Spring
3 55 (8.44%) Kafka
4 35 (5.37%) Spring Boot
5 33 (5.06%) REST
6 30 (4.60%) Middleware
7 28 (4.29%) AngularJS
8 26 (3.99%) CSS
9 25 (3.83%) Boost C++ Libraries
10 23 (3.53%) HTML
10 23 (3.53%) PyTorch
10 23 (3.53%) scikit-learn
11 19 (2.91%) TensorFlow
12 17 (2.61%) FIX Protocol
13 14 (2.15%) Jest
13 14 (2.15%) Web Services
14 13 (1.99%) Bootstrap
14 13 (1.99%) jQuery
15 12 (1.84%) Backbone.js
15 12 (1.84%) Ember.js
Miscellaneous
1 93 (14.26%) Data Structures
2 52 (7.98%) Distributed Systems
3 46 (7.06%) Equities
4 36 (5.52%) Robotics
5 30 (4.60%) Cloud Native
6 27 (4.14%) Hedge funds
7 23 (3.53%) Foreign Exchange (FX)
7 23 (3.53%) Public Cloud
8 22 (3.37%) Management Information System
9 21 (3.22%) Derivative
9 21 (3.22%) Fixed Income
10 18 (2.76%) Self-Motivation
11 15 (2.30%) Social Media
12 14 (2.15%) Blog
12 14 (2.15%) Product Ownership
13 12 (1.84%) Hybrid Cloud
14 11 (1.69%) e-Learning
15 10 (1.53%) Greenfield Project
16 9 (1.38%) Equity Derivative
16 9 (1.38%) GNSS
Operating Systems
1 67 (10.28%) Linux
2 16 (2.45%) Windows
3 14 (2.15%) Apple iOS
4 13 (1.99%) Android
5 12 (1.84%) Unix
6 2 (0.31%) Embedded Linux
6 2 (0.31%) Robot Operating System
7 1 (0.15%) FreeRTOS
7 1 (0.15%) Windows Server
Processes & Methodologies
1 256 (39.26%) Software Engineering
2 246 (37.73%) Artificial Intelligence
3 206 (31.60%) Agile
3 206 (31.60%) Machine Learning
4 183 (28.07%) SDLC
5 182 (27.91%) Analytics
6 175 (26.84%) Problem-Solving
7 163 (25.00%) Visualisation
8 135 (20.71%) CI/CD
9 128 (19.63%) Computer Science
10 117 (17.94%) Continuous Improvement
11 115 (17.64%) Community of Practice
12 112 (17.18%) Operational Stability
13 111 (17.02%) Data Science
14 90 (13.80%) Mathematics
15 73 (11.20%) Statistics
16 70 (10.74%) Signal Processing
17 67 (10.28%) DevOps
18 66 (10.12%) Low Latency
19 64 (9.82%) OO
Programming Languages
1 298 (45.71%) Python
2 167 (25.61%) Java
3 129 (19.79%) C++
4 116 (17.79%) SQL
5 64 (9.82%) C
6 42 (6.44%) C#
6 42 (6.44%) JavaScript
7 39 (5.98%) TypeScript
8 28 (4.29%) MATLAB
9 16 (2.45%) R
10 11 (1.69%) Scala
11 8 (1.23%) Bash
11 8 (1.23%) Shell Script
12 6 (0.92%) Go
12 6 (0.92%) Kotlin
13 5 (0.77%) Rust
13 5 (0.77%) Swift
14 4 (0.61%) Objective-C
15 3 (0.46%) Assembly Language
15 3 (0.46%) VC++
Qualifications
1 178 (27.30%) Degree
2 97 (14.88%) Master's Degree
3 87 (13.34%) PhD
4 67 (10.28%) BPSS Clearance
5 38 (5.83%) Computer Science Degree
6 30 (4.60%) Security Cleared
7 22 (3.37%) SC Cleared
8 6 (0.92%) Azure Certification
9 5 (0.77%) CISM
9 5 (0.77%) CISSP
9 5 (0.77%) DV Cleared
10 4 (0.61%) ISTQB
11 3 (0.46%) CompTIA Security+
11 3 (0.46%) DBS Check
12 2 (0.31%) AWS Certification
12 2 (0.31%) AWS Certified Developer
12 2 (0.31%) CISA
12 2 (0.31%) CRISC
12 2 (0.31%) Numerate Degree
13 1 (0.15%) A+ Certification
Quality Assurance & Compliance
1 54 (8.28%) ISO/IEC 15288
2 18 (2.76%) QA
3 15 (2.30%) Data Quality
4 14 (2.15%) GDPR
5 7 (1.07%) Accessibility
5 7 (1.07%) California Consumer Privacy Act
6 5 (0.77%) Actionable Recommendations
6 5 (0.77%) CDISC
6 5 (0.77%) GxP
6 5 (0.77%) HL7
7 4 (0.61%) ISO/IEC 27001
8 3 (0.46%) NIST
9 2 (0.31%) AUTOSAR
9 2 (0.31%) Cyber Essentials
9 2 (0.31%) ISO 26262
9 2 (0.31%) JTAG
10 1 (0.15%) GMP
10 1 (0.15%) GRC
System Software
1 55 (8.44%) Docker
2 9 (1.38%) Firmware
3 3 (0.46%) Active Directory
4 2 (0.31%) Embedded Firmware
Systems Management
1 69 (10.58%) Kubernetes
2 29 (4.45%) Terraform
3 16 (2.45%) Ansible
4 5 (0.77%) Kubeflow
4 5 (0.77%) Progress Chef
5 3 (0.46%) Computer Emergency Response Teams
5 3 (0.46%) Grafana
6 2 (0.31%) Functional Safety
6 2 (0.31%) logstash
6 2 (0.31%) Mesos
6 2 (0.31%) Prometheus
6 2 (0.31%) Puppet
6 2 (0.31%) Single Sign-On
Vendors
1 103 (15.80%) Google
2 59 (9.05%) IBM
3 50 (7.67%) Microsoft
4 35 (5.37%) OpenAI
5 29 (4.45%) Oracle
6 25 (3.83%) Ahrefs
7 16 (2.45%) Screaming Frog
8 14 (2.15%) Databricks
9 12 (1.84%) Red Hat
10 11 (1.69%) SAP
10 11 (1.69%) Splunk
11 9 (1.38%) Dynatrace
11 9 (1.38%) ServiceNow
12 6 (0.92%) Workday
12 6 (0.92%) YouTube
13 5 (0.77%) Adobe
13 5 (0.77%) Facebook
13 5 (0.77%) Salesforce
14 4 (0.61%) NVIDIA
15 3 (0.46%) Thales