Device Drivers
UK

The table below looks at the prevalence of the term Device Driver in permanent job vacancies. Included is a benchmarking guide to the salaries offered in vacancies that have cited Device Driver over the 6 months to 7 May 2024 with a comparison to the same period over the previous 2 years.

6 months to
7 May 2024
Same period 2023 Same period 2022
Rank 814 893 1077
Rank change year-on-year +79 +184 -234
Permanent jobs citing Device Driver 93 102 158
As % of all permanent jobs advertised in the UK 0.094% 0.10% 0.10%
As % of the Miscellaneous category 0.27% 0.23% 0.21%
Number of salaries quoted 81 72 53
10th Percentile £45,000 £26,250 £35,000
25th Percentile £50,000 £32,000 £36,750
Median annual salary (50th Percentile) £60,000 £61,250 £55,000
Median % change year-on-year -2.04% +11.36% -
75th Percentile £66,250 £72,500 £72,500
90th Percentile £82,500 £77,500 £75,000
UK excluding London median annual salary £60,000 £60,000 £60,000
% change year-on-year - - +9.09%

All Generic Skills
UK

Device Driver is in the General and Transferable Skills category. The following table is for comparison with the above and provides summary statistics for all permanent job vacancies with a requirement for generic IT skills.

Permanent vacancies with a requirement for generic IT skills 34,801 43,406 74,907
As % of all permanent jobs advertised in the UK 35.34% 42.74% 47.58%
Number of salaries quoted 22,954 23,484 33,996
10th Percentile £28,000 £35,250 £34,500
25th Percentile £38,000 £46,250 £45,750
Median annual salary (50th Percentile) £55,000 £65,000 £62,500
Median % change year-on-year -15.38% +4.00% +4.17%
75th Percentile £75,000 £86,250 £84,056
90th Percentile £97,500 £107,500 £102,500
UK excluding London median annual salary £50,000 £55,000 £52,500
% change year-on-year -9.09% +4.76% +5.00%

Device Driver
Job Vacancy Trend

Job postings citing Device Driver as a proportion of all IT jobs advertised.
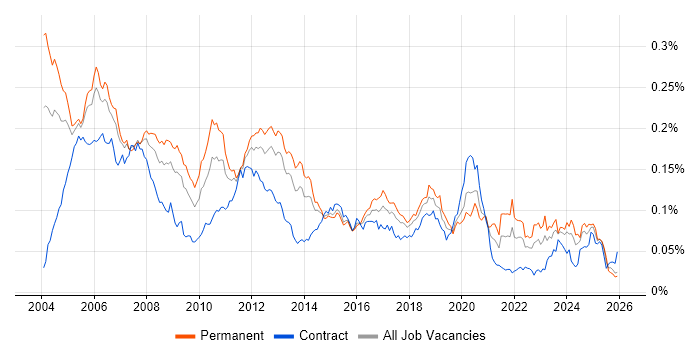
Job vacancy trend for Device Driver in the UK

Device Driver
Salary Trend

3-month moving average salary quoted in jobs citing Device Driver.

Salary trend for Device Driver in the UK

Device Driver
Salary Histogram

Salary distribution for jobs citing Device Driver over the 6 months to 7 May 2024.

Salary histogram for Device Driver in the UK

Device Driver
Top 14 Job Locations

The table below looks at the demand and provides a guide to the median salaries quoted in IT jobs citing Device Driver within the UK over the 6 months to 7 May 2024. The 'Rank Change' column provides an indication of the change in demand within each location based on the same 6 month period last year.

Location Rank Change
on Same Period
Last Year
Matching
Permanent
IT Job Ads
Median Salary
Past 6 Months
Median Salary
% Change
on Same Period
Last Year
Live
Jobs
UK excluding London -13 87 £60,000 - 49
England +69 74 £60,000 -4.00% 52
Work from Home +98 53 £60,000 -7.69% 36
South East +20 28 £62,500 -10.71% 16
Scotland -50 19 £60,000 +13.21% 6
North of England +42 11 £50,000 +81.82% 3
South West - 11 £60,000 - 2
North West +17 10 £50,000 +81.82% 2
Midlands -1 9 £45,000 +2.86% 8
East of England -3 9 £70,000 +7.69% 13
East Midlands -16 5 £45,000 +63.64% 5
London +116 4 £150,000 +130.77% 7
West Midlands +15 4 - - 3
Yorkshire +76 1 - - 1

Device Driver
Co-occurring Skills and Capabilities by Category

The follow tables expand on the table above by listing co-occurrences grouped by category. The same employment type, locality and period is covered with up to 20 co-occurrences shown in each of the following categories:

Application Platforms
1 5 (5.38%) Confluence
2 1 (1.08%) SharePoint
Applications
1 8 (8.60%) Simulink
Cloud Services
1 5 (5.38%) GitHub
2 3 (3.23%) Microsoft 365
3 2 (2.15%) Azure
3 2 (2.15%) Entra ID
4 1 (1.08%) WhatsApp
Communications & Networking
1 23 (24.73%) Wireless
2 19 (20.43%) RS-232
3 15 (16.13%) Ethernet
3 15 (16.13%) Wi-Fi
4 7 (7.53%) TCP/IP
5 6 (6.45%) 5G
6 4 (4.30%) 3GPP
7 2 (2.15%) DHCP
7 2 (2.15%) DNS
7 2 (2.15%) LTE
8 1 (1.08%) Bluetooth
8 1 (1.08%) LoRaWAN
8 1 (1.08%) Modbus
8 1 (1.08%) MQTT
8 1 (1.08%) PBX
8 1 (1.08%) SNMP
8 1 (1.08%) ZigBee
Development Applications
1 15 (16.13%) Git
2 12 (12.90%) JIRA
3 10 (10.75%) Jenkins
4 5 (5.38%) Subversion
5 4 (4.30%) Zephyr
6 3 (3.23%) Rational DOORS
General
1 24 (25.81%) Electronics
2 21 (22.58%) Manufacturing
3 16 (17.20%) Automotive
4 12 (12.90%) Social Skills
5 11 (11.83%) Finance
6 8 (8.60%) Telecoms
7 4 (4.30%) Pharmaceutical
8 2 (2.15%) Aerospace
9 1 (1.08%) Inclusion and Diversity
9 1 (1.08%) Marketing
9 1 (1.08%) Public Sector
Job Titles
1 81 (87.10%) Software Engineer
2 57 (61.29%) Embedded Engineer
3 50 (53.76%) Embedded Software Engineer
4 39 (41.94%) Senior
5 35 (37.63%) Senior Software Engineer
6 25 (26.88%) Senior Embedded Engineer
7 22 (23.66%) Senior Embedded Software Engineer
8 7 (7.53%) Embedded Linux Engineer
8 7 (7.53%) Lead
8 7 (7.53%) Linux Engineer
9 5 (5.38%) Lead Software Engineer
10 4 (4.30%) Embedded C++ Engineer
10 4 (4.30%) Embedded Firmware Engineer
10 4 (4.30%) Embedded Linux Software Engineer
10 4 (4.30%) Firmware Engineer
11 3 (3.23%) Embedded C Engineer
11 3 (3.23%) Embedded C/C++ Engineer
11 3 (3.23%) Lead Embedded Software Engineer
11 3 (3.23%) Senior Linux Engineer
12 2 (2.15%) Technical Engineer
Libraries, Frameworks & Software Standards
1 37 (39.78%) Yocto
2 10 (10.75%) Qt
3 7 (7.53%) Middleware
4 4 (4.30%) EDI
5 3 (3.23%) Boost C++ Libraries
6 2 (2.15%) GStreamer
7 1 (1.08%) FFmpeg
7 1 (1.08%) LDAP
7 1 (1.08%) Wayland
7 1 (1.08%) WebKit
Miscellaneous
1 16 (17.20%) Embedded Systems
2 12 (12.90%) Algorithms
3 9 (9.68%) IoT
4 5 (5.38%) SIMD
5 4 (4.30%) FPGA
5 4 (4.30%) Life Science
5 4 (4.30%) Management Information System
5 4 (4.30%) Robotics
6 3 (3.23%) Analogue Electronics
7 2 (2.15%) Distributed Systems
7 2 (2.15%) Video\Live Streaming
8 1 (1.08%) Augmented Reality
8 1 (1.08%) Data Structures
8 1 (1.08%) IVR
8 1 (1.08%) Onboarding
8 1 (1.08%) Self-Motivation
8 1 (1.08%) State Machine
8 1 (1.08%) STB
8 1 (1.08%) Video Conferencing
Operating Systems
1 69 (74.19%) Linux
2 55 (59.14%) Embedded Linux
3 8 (8.60%) FreeRTOS
3 8 (8.60%) Windows
4 3 (3.23%) Red Hat Enterprise Linux
5 2 (2.15%) Android
5 2 (2.15%) Mac OS X
5 2 (2.15%) Windows 10
5 2 (2.15%) Windows Server 2012
6 1 (1.08%) Apple iOS
6 1 (1.08%) OpenWrt
6 1 (1.08%) Unix
6 1 (1.08%) Windows Server
Processes & Methodologies
1 84 (90.32%) Software Engineering
2 50 (53.76%) Device Driver Development
3 21 (22.58%) OOD
4 18 (19.35%) Agile
5 15 (16.13%) DevOps
6 12 (12.90%) Open Source
6 12 (12.90%) Validation
7 10 (10.75%) OO
7 10 (10.75%) Signal Processing
8 9 (9.68%) Software Testing
9 8 (8.60%) Embedded Software Development
9 8 (8.60%) Mentoring
9 8 (8.60%) Problem-Solving
10 7 (7.53%) Continuous Integration
11 6 (6.45%) Technical Leadership
11 6 (6.45%) Test Automation
12 5 (5.38%) Computer Science
12 5 (5.38%) Design Patterns
12 5 (5.38%) MVVM
13 4 (4.30%) Mathematics
Programming Languages
1 72 (77.42%) C
2 37 (39.78%) Python
3 32 (34.41%) C++
4 17 (18.28%) Embedded C
5 15 (16.13%) Java
6 9 (9.68%) Bash
6 9 (9.68%) Rust
7 6 (6.45%) C#
8 5 (5.38%) Assembly Language
9 2 (2.15%) Embedded C++
9 2 (2.15%) Perl
10 1 (1.08%) MATLAB
10 1 (1.08%) Shell Script
Qualifications
1 27 (29.03%) Degree
2 5 (5.38%) Security Cleared
3 2 (2.15%) Computer Science Degree
3 2 (2.15%) Microsoft Certification
Quality Assurance & Compliance
1 2 (2.15%) AUTOSAR
2 1 (1.08%) MISRA
2 1 (1.08%) MISRA C
2 1 (1.08%) SLA
System Software
1 18 (19.35%) Firmware
2 15 (16.13%) Embedded Firmware
3 8 (8.60%) Docker
4 2 (2.15%) Active Directory
4 2 (2.15%) VMware Infrastructure
4 2 (2.15%) vSphere
Systems Management
1 5 (5.38%) Terraform
2 3 (3.23%) Ansible
2 3 (3.23%) Kubernetes
2 3 (3.23%) Podman
3 2 (2.15%) Microsoft Intune
Vendors
1 3 (3.23%) Microsoft
1 3 (3.23%) Red Hat
2 2 (2.15%) NVIDIA
2 2 (2.15%) VMware
3 1 (1.08%) ConnectWise
3 1 (1.08%) Renesas
3 1 (1.08%) SAP