Apache Subversion (SVN)
UK

The following table provides summary statistics for permanent job vacancies with a requirement for Subversion skills. Included is a benchmarking guide to the salaries offered in vacancies that have cited Subversion over the 6 months to 29 November 2023 with a comparison to the same period in the previous 2 years.

6 months to
29 Nov 2023
Same period 2022 Same period 2021
Rank 593 601 528
Rank change year-on-year +8 -73 -156
Permanent jobs citing Subversion 140 572 723
As % of all permanent jobs advertised in the UK 0.26% 0.45% 0.56%
As % of the Development Applications category 1.99% 2.46% 2.71%
Number of salaries quoted 112 341 565
10th Percentile £38,875 £31,250 £33,750
25th Percentile £43,750 £40,000 £41,250
Median annual salary (50th Percentile) £52,500 £55,000 £52,500
Median % change year-on-year -4.55% +4.76% +5.00%
75th Percentile £75,000 £72,000 £65,000
90th Percentile £85,000 £92,500 £78,750
UK excluding London median annual salary £51,250 £50,000 £50,000
% change year-on-year +2.50% - +5.26%

All Development Application Skills
UK

Subversion is in the Development Applications category. The following table is for comparison with the above and provides summary statistics for all permanent job vacancies with a requirement for development application skills.

Permanent vacancies with a requirement for development application skills 7,032 23,283 26,641
As % of all permanent jobs advertised in the UK 13.00% 18.50% 20.64%
Number of salaries quoted 5,385 12,919 16,378
10th Percentile £42,141 £39,271 £36,750
25th Percentile £50,000 £48,091 £45,000
Median annual salary (50th Percentile) £65,000 £65,000 £60,000
Median % change year-on-year - +8.33% +9.09%
75th Percentile £82,548 £81,250 £75,000
90th Percentile £97,500 £97,500 £91,250
UK excluding London median annual salary £59,000 £55,000 £50,000
% change year-on-year +7.27% +10.00% -

Subversion
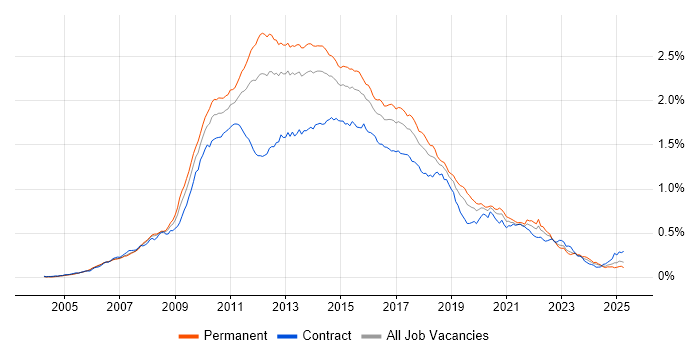
Job Vacancy Trend

Job postings citing Subversion as a proportion of all IT jobs advertised.

Job vacancy trend for Subversion in the UK

Subversion
Salary Trend

3-month moving average salary quoted in jobs citing Subversion.

Salary trend for Subversion in the UK

Subversion
Salary Histogram

Salary distribution for jobs citing Subversion over the 6 months to 29 November 2023.

Salary histogram for Subversion in the UK

Subversion
Top 15 Job Locations

The table below looks at the demand and provides a guide to the median salaries quoted in IT jobs citing Subversion within the UK over the 6 months to 29 November 2023. The 'Rank Change' column provides an indication of the change in demand within each location based on the same 6 month period last year.

Location Rank Change
on Same Period
Last Year
Matching
Permanent
IT Job Ads
Median Salary
Past 6 Months
Median Salary
% Change
on Same Period
Last Year
Live
Jobs
England -3 128 £52,500 -4.55% 103
UK excluding London +2 118 £51,250 +2.50% 90
Work from Home +54 52 £65,000 +18.18% 49
South East +59 51 £67,500 +32.76% 25
London +147 24 £63,750 -20.31% 19
South West -11 22 £47,500 +61.02% 13
North of England +111 19 £51,500 +3.00% 23
Yorkshire +78 11 £50,000 - 14
Scotland +61 11 £70,000 +27.27% 3
Midlands +107 8 £43,000 -28.33% 12
North West +105 8 £52,500 +50.00% 9
West Midlands +102 6 £41,250 -41.07% 8
East of England +80 6 £65,000 -9.72% 14
East Midlands +43 2 £43,000 -20.37% 4
Northern Ireland +31 1 - -

Subversion
Co-occurring Skills and Capabilities by Category

The follow tables expand on the table above by listing co-occurrences grouped by category. The same employment type, locality and period is covered with up to 20 co-occurrences shown in each of the following categories:

Application Platforms
1 7 (5.00%) Confluence
2 6 (4.29%) Tomcat
3 5 (3.57%) SharePoint
4 3 (2.14%) Apache
4 3 (2.14%) Oracle SOA Suite
4 3 (2.14%) Oracle Workflow
5 2 (1.43%) Jetty
6 1 (0.71%) IIS
6 1 (0.71%) nginx
Applications
1 5 (3.57%) Microsoft Office
2 1 (0.71%) OrCAD
2 1 (0.71%) Simulink
2 1 (0.71%) Stateflow
Business Applications
1 4 (2.86%) Front Arena
2 2 (1.43%) Dynamics AX
2 2 (1.43%) Dynamics CRM
3 1 (0.71%) Temenos T24
Cloud Services
1 37 (26.43%) GitHub
2 28 (20.00%) AWS
3 20 (14.29%) Azure
4 5 (3.57%) Azure DevOps
5 4 (2.86%) Amazon EC2
5 4 (2.86%) Amazon S3
5 4 (2.86%) AWS CloudFormation
5 4 (2.86%) GCP
5 4 (2.86%) Microsoft 365
5 4 (2.86%) OpenShift
5 4 (2.86%) Virtual Private Cloud
6 3 (2.14%) Datadog
6 3 (2.14%) Entra ID
6 3 (2.14%) WhatsApp
7 2 (1.43%) AWS IoT
7 2 (1.43%) Dynamics 365
7 2 (1.43%) npm
7 2 (1.43%) Power Platform
7 2 (1.43%) PowerApps
7 2 (1.43%) Serverless
Communications & Networking
1 11 (7.86%) MQTT
2 6 (4.29%) Firewall
2 6 (4.29%) Modbus
2 6 (4.29%) TCP/IP
3 5 (3.57%) DNS
3 5 (3.57%) RS-485
4 4 (2.86%) Ethernet
4 4 (2.86%) HTTP
5 3 (2.14%) 802.11
5 3 (2.14%) ATM
5 3 (2.14%) Bluetooth
5 3 (2.14%) FTP
5 3 (2.14%) SMTP
5 3 (2.14%) SSH
5 3 (2.14%) VPN
5 3 (2.14%) Wi-Fi
6 2 (1.43%) Link 16
6 2 (1.43%) LTE
6 2 (1.43%) Tactical Data Link
6 2 (1.43%) Wireless
Database & Business Intelligence
1 40 (28.57%) SQL Server
2 27 (19.29%) MySQL
3 23 (16.43%) SQLite
4 11 (7.86%) PostgreSQL
5 8 (5.71%) Elasticsearch
6 7 (5.00%) MongoDB
7 6 (4.29%) Amazon RDS
7 6 (4.29%) NoSQL
8 4 (2.86%) SQL Server Integration Services
9 3 (2.14%) Relational Database
10 2 (1.43%) Amazon Aurora
10 2 (1.43%) Amazon Redshift
10 2 (1.43%) Big Data
10 2 (1.43%) Data Warehouse
10 2 (1.43%) Hadoop
10 2 (1.43%) Metadata
10 2 (1.43%) OLTP
10 2 (1.43%) Redis
11 1 (0.71%) DB2
11 1 (0.71%) RDBMS
Development Applications
1 80 (57.14%) Git
2 61 (43.57%) Jenkins
3 31 (22.14%) JIRA
4 11 (7.86%) Bitbucket
4 11 (7.86%) Cucumber
4 11 (7.86%) Maven
4 11 (7.86%) Visual Studio
5 10 (7.14%) Selenium
6 9 (6.43%) SonarQube
7 8 (5.71%) GitLab
7 8 (5.71%) gulp
8 7 (5.00%) Team Foundation Server
9 6 (4.29%) CMake
9 6 (4.29%) Eclipse
9 6 (4.29%) Mocha
10 5 (3.57%) CA Release Automation
10 5 (3.57%) IBM UrbanCode
10 5 (3.57%) Mercurial
10 5 (3.57%) Zephyr
11 4 (2.86%) Sonatype Nexus
General
1 33 (23.57%) Social Skills
2 17 (12.14%) Finance
3 13 (9.29%) Manufacturing
4 12 (8.57%) Games
5 10 (7.14%) Marketing
6 9 (6.43%) Electronics
7 7 (5.00%) Analytical Skills
7 7 (5.00%) Aviation
7 7 (5.00%) Banking
7 7 (5.00%) Telecoms
8 6 (4.29%) Military
8 6 (4.29%) Public Sector
9 5 (3.57%) Automotive
9 5 (3.57%) Legal
10 4 (2.86%) Aerospace
10 4 (2.86%) Financial Institution
11 3 (2.14%) Aeronautics
11 3 (2.14%) Pharmaceutical
12 2 (1.43%) Organisational Skills
12 2 (1.43%) Presentation Skills
Job Titles
1 50 (35.71%) Software Engineer
2 42 (30.00%) Developer
3 28 (20.00%) Senior
4 17 (12.14%) .NET Software Engineer
5 13 (9.29%) DevOps Engineer
5 13 (9.29%) Senior Developer
6 12 (8.57%) Embedded Engineer
7 11 (7.86%) Front-End Developer (Client-Side Developer)
8 10 (7.14%) C++ Software Engineer
9 9 (6.43%) Firmware Engineer
9 9 (6.43%) Senior Front-End Developer
10 8 (5.71%) Senior Software Engineer
11 7 (5.00%) Embedded Firmware Engineer
11 7 (5.00%) Games Developer
11 7 (5.00%) Java Developer
11 7 (5.00%) Lead
12 6 (4.29%) Senior C++ Software Engineer
12 6 (4.29%) Senior Games Developer
13 5 (3.57%) C++ Developer
13 5 (3.57%) JavaScript Developer
Libraries, Frameworks & Software Standards
1 38 (27.14%) CSS
2 37 (26.43%) .NET
2 37 (26.43%) HTML
3 36 (25.71%) XML
4 34 (24.29%) React
5 33 (23.57%) .NET Framework
6 30 (21.43%) JSON
7 29 (20.71%) ASP.NET
8 26 (18.57%) Web Services
9 25 (17.86%) Entity Framework
10 21 (15.00%) Vue
11 20 (14.29%) ASP.NET MVC
11 20 (14.29%) KnockoutJS
11 20 (14.29%) NHibernate
11 20 (14.29%) React Native
12 17 (12.14%) REST
13 14 (10.00%) HTML5
14 11 (7.86%) Spring
15 9 (6.43%) Sass
15 9 (6.43%) WPF
Miscellaneous
1 11 (7.86%) Algorithms
2 10 (7.14%) IoT
3 8 (5.71%) Embedded Systems
4 5 (3.57%) Enterprise Software
5 4 (2.86%) Animation
5 4 (2.86%) ARM Cortex
5 4 (2.86%) Hedge funds
6 3 (2.14%) Client/Server
6 3 (2.14%) Distributed Systems
7 2 (1.43%) Data Structures
7 2 (1.43%) Legacy Systems
7 2 (1.43%) Mobile App
7 2 (1.43%) Online Games
8 1 (0.71%) Analogue Electronics
8 1 (0.71%) Distributed Computing
8 1 (0.71%) Hybrid Cloud
8 1 (0.71%) Industrial Internet of Things
8 1 (0.71%) NB-IoT
8 1 (0.71%) Product Ownership
8 1 (0.71%) Self-Motivation
Operating Systems
1 29 (20.71%) Linux
2 22 (15.71%) Windows
3 8 (5.71%) FreeRTOS
4 4 (2.86%) Mac OS X
4 4 (2.86%) Unix
5 3 (2.14%) Android
6 2 (1.43%) CentOS
6 2 (1.43%) Embedded Linux
6 2 (1.43%) OpenBSD
6 2 (1.43%) VMS
7 1 (0.71%) Apple iOS
7 1 (0.71%) FreeBSD
7 1 (0.71%) Red Hat Enterprise Linux
7 1 (0.71%) Windows Server
Processes & Methodologies
1 65 (46.43%) Software Engineering
2 31 (22.14%) Agile
3 29 (20.71%) TDD
4 28 (20.00%) Problem-Solving
5 27 (19.29%) OO
6 25 (17.86%) MVC
7 24 (17.14%) DevOps
8 22 (15.71%) CI/CD
8 22 (15.71%) Configuration Management
9 19 (13.57%) User Experience
10 17 (12.14%) Computer Science
10 17 (12.14%) Technical Leadership
11 15 (10.71%) Mathematics
11 15 (10.71%) Microservices
12 13 (9.29%) Mentoring
13 12 (8.57%) Continuous Integration
14 11 (7.86%) OOP
15 10 (7.14%) Front End Development
15 10 (7.14%) Scrum
15 10 (7.14%) Test Automation
Programming Languages
1 53 (37.86%) JavaScript
2 50 (35.71%) C#
3 30 (21.43%) C++
4 29 (20.71%) Java
5 26 (18.57%) SQL
6 23 (16.43%) Python
7 22 (15.71%) C
8 15 (10.71%) TypeScript
9 10 (7.14%) PowerShell
10 7 (5.00%) Bash
11 5 (3.57%) Ada
11 5 (3.57%) MATLAB
11 5 (3.57%) SOQL
11 5 (3.57%) T-SQL
12 4 (2.86%) XAML
13 3 (2.14%) Embedded C
13 3 (2.14%) Perl
13 3 (2.14%) Ruby
13 3 (2.14%) VB.NET
13 3 (2.14%) XQuery
Qualifications
1 24 (17.14%) Degree
2 18 (12.86%) SC Cleared
2 18 (12.86%) Security Cleared
3 15 (10.71%) Computer Science Degree
4 2 (1.43%) AWS Certification
4 2 (1.43%) Azure Certification
4 2 (1.43%) DV Cleared
4 2 (1.43%) ISTQB
4 2 (1.43%) Master's Degree
5 1 (0.71%) ISEB
5 1 (0.71%) ISTQB Foundation Certification
Quality Assurance & Compliance
1 7 (5.00%) Data Quality
2 6 (4.29%) QA
3 3 (2.14%) ISO/IEC 27001
3 3 (2.14%) MISRA
4 2 (1.43%) Accessibility
4 2 (1.43%) MISRA C
5 1 (0.71%) AUTOSAR
5 1 (0.71%) ISO 26262
5 1 (0.71%) ISO 9001
5 1 (0.71%) JTAG
5 1 (0.71%) SLA
System Software
1 17 (12.14%) Docker
2 10 (7.14%) Firmware
3 7 (5.00%) Embedded Firmware
4 4 (2.86%) Active Directory
4 4 (2.86%) Virtual Machines
5 2 (1.43%) Postfix
5 2 (1.43%) VMware Infrastructure
6 1 (0.71%) Hyper-V
6 1 (0.71%) iptables
6 1 (0.71%) Virtual Servers
6 1 (0.71%) VirtualBox
Systems Management
1 15 (10.71%) Kubernetes
2 13 (9.29%) Ansible
3 10 (7.14%) Terraform
4 9 (6.43%) Nagios
4 9 (6.43%) Puppet
5 6 (4.29%) Kibana
5 6 (4.29%) Prometheus
6 4 (2.86%) Progress Chef
7 3 (2.14%) Microsoft Intune
8 2 (1.43%) Packer
8 2 (1.43%) Salt
9 1 (0.71%) Docker Swarm
9 1 (0.71%) Grafana
9 1 (0.71%) logstash
9 1 (0.71%) Rancher
9 1 (0.71%) SCCM
9 1 (0.71%) ZABBIX
Vendors
1 23 (16.43%) Xamarin
2 17 (12.14%) Microsoft
3 15 (10.71%) Oracle
4 8 (5.71%) Dynatrace
5 7 (5.00%) Rollbar
5 7 (5.00%) Splunk
6 6 (4.29%) Atlassian
6 6 (4.29%) New Relic
6 6 (4.29%) SAP
7 5 (3.57%) Salesforce
7 5 (3.57%) Veracode
8 4 (2.86%) Apple
8 4 (2.86%) Renesas
9 3 (2.14%) CA Agile Central
10 2 (1.43%) Databricks
10 2 (1.43%) VMware
11 1 (0.71%) Google
11 1 (0.71%) IBM
11 1 (0.71%) Telerik
11 1 (0.71%) Temenos