Presentation Skills Jobs

Presentation Skills
UK

The table below looks at the prevalence of the term Presentation Skills in permanent job vacancies. Included is a benchmarking guide to the salaries offered in vacancies that cited Presentation Skills over the 6 months leading up to 11 October 2024, comparing them to the same period in the previous two years.

6 months to
11 Oct 2024
Same period 2023 Same period 2022
Rank 118 112 131
Rank change year-on-year -6 +19 +36
Permanent jobs citing Presentation Skills 1,696 1,766 4,275
As % of all permanent jobs advertised in the UK 2.17% 2.92% 2.96%
As % of the General category 3.71% 4.42% 4.35%
Number of salaries quoted 486 802 1,783
10th Percentile £39,500 £37,050 £37,500
25th Percentile £46,250 £46,250 £47,447
Median annual salary (50th Percentile) £55,626 £60,000 £62,500
Median % change year-on-year -7.29% -4.00% +4.17%
75th Percentile £72,500 £78,750 £81,250
90th Percentile £93,250 £95,000 £99,950
UK excluding London median annual salary £50,000 £54,500 £55,000
% change year-on-year -8.26% -0.91% +10.00%

All General Skills
UK

Presentation Skills falls under the General Skills category. For comparison with the information above, the following table provides summary statistics for all permanent job vacancies requiring common skills.

Permanent vacancies with a requirement for common skills 45,671 39,980 98,320
As % of all permanent jobs advertised in the UK 58.38% 66.04% 67.97%
Number of salaries quoted 20,861 27,493 50,906
10th Percentile £31,250 £31,250 £32,500
25th Percentile £42,500 £42,500 £43,903
Median annual salary (50th Percentile) £57,500 £60,000 £60,000
Median % change year-on-year -4.17% - +4.35%
75th Percentile £78,750 £80,000 £81,250
90th Percentile £100,000 £100,000 £100,000
UK excluding London median annual salary £50,000 £50,139 £51,910
% change year-on-year -0.28% -3.41% +9.28%

Presentation Skills
Job Vacancy Trend

Job postings citing Presentation Skills as a proportion of all IT jobs advertised.
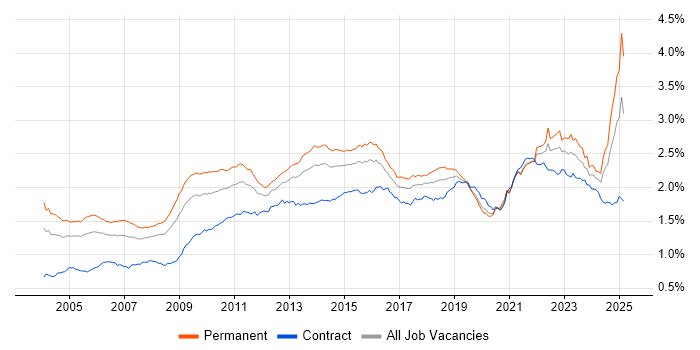
Job vacancy trend for Presentation Skills in the UK

Presentation Skills
Salary Trend

3-month moving average salary quoted in jobs citing Presentation Skills.

Salary trend for Presentation Skills in the UK

Presentation Skills
Salary Histogram

Salary distribution for jobs citing Presentation Skills over the 6 months to 11 October 2024.

Salary histogram for Presentation Skills in the UK

Presentation Skills
Top 17 Job Locations

The table below looks at the demand and provides a guide to the median salaries quoted in IT jobs citing Presentation Skills within the UK over the 6 months to 11 October 2024. The 'Rank Change' column provides an indication of the change in demand within each location based on the same 6 month period last year.

Location Rank Change
on Same Period
Last Year
Matching
Permanent
IT Job Ads
Median Salary
Past 6 Months
Median Salary
% Change
on Same Period
Last Year
Live
Jobs
England +3 1,520 £55,000 -8.71% 579
UK excluding London -18 1,136 £50,000 -8.26% 327
Work from Home +7 576 £56,250 -6.64% 854
London -11 477 £69,375 -4.31% 280
North of England -9 286 £47,683 -4.63% 83
Midlands -4 256 £51,750 -2.82% 66
South East -23 231 £54,125 -1.59% 82
South West +6 161 £49,000 +3.16% 28
West Midlands -8 159 £52,500 -8.70% 44
North West -54 139 £47,592 -4.82% 53
Yorkshire +49 124 £47,683 +2.54% 20
East Midlands -16 97 £51,000 -2.86% 21
East of England +21 90 £47,683 +12.20% 35
Scotland -44 71 £47,683 -16.52% 22
Wales -13 31 £47,683 +73.39% 13
North East -17 23 £47,500 -5.00% 10
Northern Ireland -17 10 - - 10

Presentation Skills
Co-occurring Skills and Capabilities by Category

The follow tables expand on the table above by listing co-occurrences grouped by category. The same employment type, locality and period is covered with up to 20 co-occurrences shown in each of the following categories:

Application Platforms
1 30 (1.77%) Confluence
2 9 (0.53%) SharePoint
3 8 (0.47%) Apache Spark
4 6 (0.35%) OpenStack
5 5 (0.29%) TPMS
6 4 (0.24%) Microsoft Exchange
7 3 (0.18%) WebSphere
7 3 (0.18%) WordPress
8 2 (0.12%) CMS
8 2 (0.12%) Jupyter
9 1 (0.059%) Apache Airflow
9 1 (0.059%) Drupal
9 1 (0.059%) Liferay
9 1 (0.059%) nginx
9 1 (0.059%) Umbraco
Applications
1 117 (6.90%) Microsoft Office
2 111 (6.54%) Microsoft Excel
3 68 (4.01%) Microsoft PowerPoint
4 15 (0.88%) Microsoft Project
5 13 (0.77%) MS Visio
6 10 (0.59%) Trello
7 4 (0.24%) Adobe XD
7 4 (0.24%) AutoCAD
8 3 (0.18%) Simulink
8 3 (0.18%) Spreadsheet
9 2 (0.12%) Adobe Creative Suite
9 2 (0.12%) Chatbot
9 2 (0.12%) CINEMA 4D
9 2 (0.12%) Sketch
10 1 (0.059%) Acrobat
10 1 (0.059%) Adobe After Effects
10 1 (0.059%) Adobe Illustrator
10 1 (0.059%) Adobe Premiere
10 1 (0.059%) InDesign
10 1 (0.059%) Photoshop
Business Applications
1 28 (1.65%) NEC Housing
2 13 (0.77%) Dynamics CRM
3 8 (0.47%) SAP Business One
3 8 (0.47%) SAP S/4HANA
4 6 (0.35%) Primavera
5 5 (0.29%) Oracle ERP
5 5 (0.29%) SAP WM
6 4 (0.24%) Dynamics NAV
6 4 (0.24%) SAP HR
6 4 (0.24%) SAP SD
7 3 (0.18%) Dynamics GP
7 3 (0.18%) Epicor Tropos
7 3 (0.18%) Oracle General Ledger
7 3 (0.18%) Oracle Manufacturing
7 3 (0.18%) Oracle Payables
7 3 (0.18%) Oracle Receivables
8 2 (0.12%) Eikon
8 2 (0.12%) Oracle Assets
8 2 (0.12%) Oracle EBS R12
8 2 (0.12%) Oracle Financials
Cloud Services
1 292 (17.22%) AWS
2 208 (12.26%) Azure
3 108 (6.37%) Power Platform
4 51 (3.01%) GCP
5 47 (2.77%) SaaS
6 36 (2.12%) Figma
7 34 (2.00%) Microsoft 365
8 20 (1.18%) Cloud Computing
9 16 (0.94%) GitHub
10 11 (0.65%) Entra ID
10 11 (0.65%) IaaS
10 11 (0.65%) PaaS
11 10 (0.59%) Azure DevOps
12 9 (0.53%) Google Workspace
12 9 (0.53%) OCI
12 9 (0.53%) Serverless
12 9 (0.53%) Snowflake
13 8 (0.47%) Dynamics 365
14 7 (0.41%) Azure API Management
14 7 (0.41%) Azure Key Vault
Communications & Networking
1 37 (2.18%) WAN
2 27 (1.59%) SD-WAN
3 25 (1.47%) DNS
4 23 (1.36%) Firewall
5 22 (1.30%) 5G
5 22 (1.30%) LAN
6 15 (0.88%) Network Security
7 14 (0.83%) TCP/IP
8 13 (0.77%) Internet
9 11 (0.65%) HTTP
9 11 (0.65%) NAS
9 11 (0.65%) SMTP
10 9 (0.53%) VPN
11 8 (0.47%) BGP
11 8 (0.47%) MPLS
11 8 (0.47%) OSPF
12 6 (0.35%) DHCP
12 6 (0.35%) EIGRP
12 6 (0.35%) IPv6
13 5 (0.29%) SNMP
Database & Business Intelligence
1 179 (10.55%) Tableau
2 107 (6.31%) Data Warehouse
2 107 (6.31%) Power BI
3 55 (3.24%) Data Lake
4 47 (2.77%) Azure SQL Data Warehouse
5 36 (2.12%) Data Vault
6 17 (1.00%) Big Data
7 16 (0.94%) SQL Server
8 13 (0.77%) SQL Server Integration Services
9 12 (0.71%) SQL Server Reporting Services
10 11 (0.65%) Data Mining
11 10 (0.59%) NoSQL
11 10 (0.59%) Power Query
11 10 (0.59%) Relational Database
12 6 (0.35%) PostgreSQL
13 4 (0.24%) Crystal Reports
13 4 (0.24%) MS Access
14 3 (0.18%) Apache Hive
14 3 (0.18%) MongoDB
14 3 (0.18%) Oracle Reports
Development Applications
1 129 (7.61%) Git
2 60 (3.54%) JIRA
3 10 (0.59%) Subversion
4 9 (0.53%) AdminStudio
4 9 (0.53%) InstallShield
4 9 (0.53%) Jenkins
4 9 (0.53%) MSI
5 6 (0.35%) GitLab
5 6 (0.35%) LabVIEW
5 6 (0.35%) Visual Studio
6 4 (0.24%) Bitbucket
6 4 (0.24%) Katalon Studio
7 3 (0.18%) Rational DOORS
7 3 (0.18%) Rational Rhapsody
8 2 (0.12%) Axure RP
8 2 (0.12%) Balsamiq
9 1 (0.059%) Cucumber
9 1 (0.059%) Gradle
9 1 (0.059%) Mocha
9 1 (0.059%) Sinon.JS
General
1 1,163 (68.57%) Social Skills
2 479 (28.24%) Retail
3 437 (25.77%) Finance
4 423 (24.94%) Analytical Skills
5 119 (7.02%) Marketing
6 104 (6.13%) Inclusion and Diversity
7 86 (5.07%) Local Government
8 73 (4.30%) Billing
9 71 (4.19%) Public Sector
10 69 (4.07%) Legal
11 54 (3.18%) Banking
12 52 (3.07%) Manufacturing
13 49 (2.89%) Organisational Skills
14 41 (2.42%) Influencing Skills
15 40 (2.36%) Law
16 38 (2.24%) Telecoms
17 36 (2.12%) French Language
18 29 (1.71%) Police
19 28 (1.65%) Social Housing
20 26 (1.53%) German Language
Job Titles
1 418 (24.65%) Senior
2 254 (14.98%) Analyst
3 162 (9.55%) Senior Manager
4 143 (8.43%) Data Analyst
5 125 (7.37%) Architect
6 123 (7.25%) Consultant
7 117 (6.90%) Engineering Manager
8 109 (6.43%) Senior Analyst
9 105 (6.19%) Business Manager
9 105 (6.19%) Development Manager
10 102 (6.01%) Business Development Manager
11 96 (5.66%) Senior Data Analyst
12 84 (4.95%) Systems Engineer
13 71 (4.19%) Lead
14 61 (3.60%) Data Consultant
15 56 (3.30%) Senior Consultant
16 48 (2.83%) Data Architect
16 48 (2.83%) Product Manager
17 47 (2.77%) Senior Technology Consultant
17 47 (2.77%) Technology Consultant
Libraries, Frameworks & Software Standards
1 19 (1.12%) HTML
2 16 (0.94%) CSS
3 15 (0.88%) .NET
4 10 (0.59%) PySpark
5 7 (0.41%) EDI
6 6 (0.35%) pytest
6 6 (0.35%) REST
6 6 (0.35%) YAML
7 5 (0.29%) Node.js
7 5 (0.29%) TensorFlow
7 5 (0.29%) Web Services
7 5 (0.29%) XML
8 4 (0.24%) .NET Framework
8 4 (0.24%) Entity Framework
8 4 (0.24%) HTML5
8 4 (0.24%) Lightning Web Components
8 4 (0.24%) MFC
8 4 (0.24%) React
8 4 (0.24%) SOAP
9 3 (0.18%) PyTorch
Miscellaneous
1 217 (12.79%) Onboarding
2 85 (5.01%) Self-Motivation
3 62 (3.66%) Management Information System
4 59 (3.48%) Driving Licence
5 50 (2.95%) Mobile App
6 46 (2.71%) iPad
6 46 (2.71%) Life Science
7 45 (2.65%) Data Centre
8 41 (2.42%) Virtual Team
9 38 (2.24%) e-Learning
10 35 (2.06%) Product Ownership
11 33 (1.95%) STB
12 23 (1.36%) Social Media
13 21 (1.24%) Algorithms
14 20 (1.18%) Data Structures
15 19 (1.12%) FPGA
15 19 (1.12%) Learning Management System
16 18 (1.06%) Enterprise Software
17 17 (1.00%) Cyberattack
18 15 (0.88%) Cyber Threat
Operating Systems
1 73 (4.30%) Windows
2 45 (2.65%) Linux
3 20 (1.18%) Unix
4 18 (1.06%) Windows Vista
5 13 (0.77%) Windows Server
6 12 (0.71%) Windows 10
7 10 (0.59%) Windows 7
8 5 (0.29%) Red Hat Enterprise Linux
9 4 (0.24%) Android
10 3 (0.18%) Apple iOS
10 3 (0.18%) SUSE Linux Enterprise Server
10 3 (0.18%) Ubuntu
11 1 (0.059%) CentOS
11 1 (0.059%) Windows Phone
Processes & Methodologies
1 839 (49.47%) Problem-Solving
2 416 (24.53%) Data Analysis
3 377 (22.23%) Mathematics
4 333 (19.63%) Agile
5 307 (18.10%) Mentoring
6 288 (16.98%) Business Development
7 277 (16.33%) Analytics
8 253 (14.92%) Customer Service
9 207 (12.21%) Mechatronics
10 192 (11.32%) Project Management
11 187 (11.03%) Decision-Making
12 177 (10.44%) Actionable Insight
13 176 (10.38%) Roadmaps
14 175 (10.32%) Business Strategy
15 164 (9.67%) Visualisation
16 160 (9.43%) Cybersecurity
17 152 (8.96%) Presales
18 133 (7.84%) Stakeholder Management
18 133 (7.84%) Statistics
19 124 (7.31%) Data Pipeline
Programming Languages
1 210 (12.38%) SQL
2 208 (12.26%) Python
3 85 (5.01%) MATLAB
4 42 (2.48%) C++
5 33 (1.95%) C
6 25 (1.47%) Java
7 24 (1.42%) C#
8 22 (1.30%) PowerShell
9 20 (1.18%) R
10 18 (1.06%) JavaScript
11 17 (1.00%) Data Analysis Expressions
12 16 (0.94%) Bash
13 13 (0.77%) Scala
14 12 (0.71%) T-SQL
15 9 (0.53%) VB
16 3 (0.18%) C-shell
16 3 (0.18%) Fortran
16 3 (0.18%) PHP
16 3 (0.18%) TypeScript
16 3 (0.18%) VBA
Qualifications
1 837 (49.35%) Degree
2 209 (12.32%) HNC
3 168 (9.91%) DBS Check
4 96 (5.66%) ACCA
5 95 (5.60%) Security Cleared
6 73 (4.30%) Azure Certification
6 73 (4.30%) SC Cleared
7 68 (4.01%) AWS Certification
8 59 (3.48%) Master's Degree
9 52 (3.07%) Computer Science Degree
10 40 (2.36%) CISSP
11 35 (2.06%) Cisco Certification
12 33 (1.95%) CISM
13 24 (1.42%) CIMA
14 22 (1.30%) APMP
15 21 (1.24%) (ISC)2 CCSP
16 20 (1.18%) CCSP
17 18 (1.06%) PMI Certification
18 16 (0.94%) DV Cleared
19 15 (0.88%) PMP
Quality Assurance & Compliance
1 72 (4.25%) GAAP
1 72 (4.25%) IFRS
2 40 (2.36%) QA
3 37 (2.18%) Accessibility
4 35 (2.06%) SLA
5 32 (1.89%) PMO
6 21 (1.24%) ISO/IEC 27001
7 19 (1.12%) GDPR
8 17 (1.00%) Cyber Essentials
9 16 (0.94%) Good Clinical Practice
9 16 (0.94%) ISO 22301
10 15 (0.88%) NIST
11 13 (0.77%) Cyber Essentials PLUS
11 13 (0.77%) IASME
12 11 (0.65%) GRC
13 8 (0.47%) Data Quality
14 7 (0.41%) SOC 2
15 6 (0.35%) ISO 9001
15 6 (0.35%) Sarbanes-Oxley
15 6 (0.35%) SOC 1
System Software
1 36 (2.12%) Active Directory
2 22 (1.30%) VMware Infrastructure
3 19 (1.12%) Firmware
4 12 (0.71%) Docker
5 11 (0.65%) Embedded Firmware
5 11 (0.65%) NFS
6 9 (0.53%) Microsoft App-V
7 7 (0.41%) Virtual Desktop
8 6 (0.35%) Virtual Servers
9 4 (0.24%) Hyper-V
10 3 (0.18%) Ceph
10 3 (0.18%) GPFS
10 3 (0.18%) Lustre
10 3 (0.18%) Slurm Workload Manager
11 2 (0.12%) VMware NSX
12 1 (0.059%) Virtual Machines
Systems Management
1 17 (1.00%) Kubernetes
2 14 (0.83%) Terraform
3 12 (0.71%) SCCM
4 9 (0.53%) Ansible
4 9 (0.53%) Microsoft Intune
4 9 (0.53%) WSUS
5 5 (0.29%) Prometheus
6 4 (0.24%) Grafana
7 3 (0.18%) Graphite
7 3 (0.18%) Kibana
7 3 (0.18%) Nagios
7 3 (0.18%) Podman
7 3 (0.18%) Progress Chef
8 2 (0.12%) Active Directory Federation Services
8 2 (0.12%) Puppet
8 2 (0.12%) SCOM
9 1 (0.059%) Functional Safety
9 1 (0.059%) ZABBIX
Vendors
1 329 (19.40%) Microsoft
2 134 (7.90%) Databricks
3 65 (3.83%) Salesforce
4 49 (2.89%) SAP
5 36 (2.12%) Google
6 31 (1.83%) VMware
7 28 (1.65%) NEC
8 26 (1.53%) Oracle
9 19 (1.12%) Cisco
10 15 (0.88%) ServiceNow
11 12 (0.71%) Atlassian
11 12 (0.71%) HubSpot
11 12 (0.71%) Palo Alto
12 10 (0.59%) Adobe
13 9 (0.53%) Autodesk
13 9 (0.53%) EMC
14 7 (0.41%) Dell
14 7 (0.41%) Fortinet
14 7 (0.41%) HP
14 7 (0.41%) Juniper