Aerospace Jobs

Aerospace
UK

The table below looks at the prevalence of the term Aerospace in permanent job vacancies. Included is a benchmarking guide to the salaries offered in vacancies that cited Aerospace over the 6 months leading up to 27 April 2025, comparing them to the same period in the previous two years.

6 months to
27 Apr 2025
Same period 2024 Same period 2023
Rank 133 225 361
Rank change year-on-year +92 +136 +186
Permanent jobs citing Aerospace 1,164 1,283 980
As % of all permanent jobs advertised in the UK 2.24% 1.31% 0.94%
As % of the General category 3.33% 2.18% 1.36%
Number of salaries quoted 764 564 238
10th Percentile £37,574 £35,000 £34,703
25th Percentile £46,000 £42,500 £41,250
Median annual salary (50th Percentile) £50,055 £55,000 £56,159
Median % change year-on-year -8.99% -2.06% +6.97%
75th Percentile £54,793 £66,250 £72,000
90th Percentile £65,000 £78,450 £84,300
UK excluding London median annual salary £50,055 £55,000 £55,000
% change year-on-year -8.99% - +10.00%

All General Skills
UK

Aerospace falls under the General Skills category. For comparison with the information above, the following table provides summary statistics for all permanent job vacancies requiring common skills.

Permanent vacancies with a requirement for common skills 34,941 58,747 72,001
As % of all permanent jobs advertised in the UK 67.31% 59.84% 68.71%
Number of salaries quoted 18,417 39,559 38,660
10th Percentile £28,146 £27,500 £32,500
25th Percentile £41,250 £36,250 £43,750
Median annual salary (50th Percentile) £56,745 £52,500 £60,000
Median % change year-on-year +8.09% -12.50% -
75th Percentile £76,500 £72,500 £82,500
90th Percentile £100,000 £92,500 £102,000
UK excluding London median annual salary £50,055 £47,500 £52,500
% change year-on-year +5.38% -9.52% +5.00%

Aerospace
Job Vacancy Trend

Job postings citing Aerospace as a proportion of all IT jobs advertised.
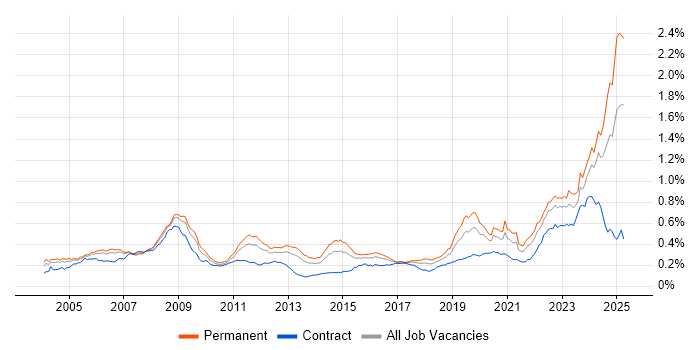
Job vacancy trend for Aerospace in the UK

Aerospace
Salary Trend

3-month moving average salary quoted in jobs citing Aerospace.

Salary trend for Aerospace in the UK

Aerospace
Salary Histogram

Salary distribution for jobs citing Aerospace over the 6 months to 27 April 2025.

Salary histogram for Aerospace in the UK

Aerospace
Top 17 Job Locations

The table below looks at the demand and provides a guide to the median salaries quoted in IT jobs citing Aerospace within the UK over the 6 months to 27 April 2025. The 'Rank Change' column provides an indication of the change in demand within each location based on the same 6 month period last year.

Location Rank Change
on Same Period
Last Year
Matching
Permanent
IT Job Ads
Median Salary
Past 6 Months
Median Salary
% Change
on Same Period
Last Year
Live
Jobs
UK excluding London +91 1,112 £50,055 -8.99% 780
England +89 1,104 £50,055 -8.99% 867
North of England +204 549 £50,055 -8.99% 100
North West +174 517 £50,055 -10.42% 68
Midlands +186 235 £40,101 +1.52% 110
South East +28 151 £46,374 -22.71% 222
West Midlands +157 142 £54,125 +20.28% 73
Work from Home -16 123 £54,793 +2.42% 578
South West -35 110 £50,000 - 190
East Midlands +96 92 £40,101 +6.93% 36
Scotland +135 31 £40,101 -27.09% 37
London +46 29 £42,500 -34.62% 146
East of England -68 29 £40,101 -33.17% 129
Yorkshire +69 28 £40,101 -10.89% 22
Wales +41 7 £40,101 - 25
North East +31 2 £75,500 +20.80% 11
Northern Ireland +33 1 - - 10

Aerospace
Co-occurring Skills and Capabilities by Category

The follow tables expand on the table above by listing co-occurrences grouped by category. The same employment type, locality and period is covered with up to 20 co-occurrences shown in each of the following categories:

Application Platforms
1 8 (0.69%) Kinematics
2 6 (0.52%) Microsoft Exchange
3 5 (0.43%) Confluence
4 3 (0.26%) Apache
5 2 (0.17%) nginx
5 2 (0.17%) TPMS
6 1 (0.086%) Mendix
6 1 (0.086%) MS Project Server
Applications
1 413 (35.48%) Simulink
2 212 (18.21%) Microsoft Office
3 172 (14.78%) Microsoft Excel
4 161 (13.83%) Microsoft PowerPoint
5 11 (0.95%) SOLIDWORKS
6 8 (0.69%) Chatbot
7 3 (0.26%) Microsoft Project
8 1 (0.086%) AutoCAD
8 1 (0.086%) Maple
8 1 (0.086%) Siemens NX
8 1 (0.086%) TargetLink
Business Applications
1 332 (28.52%) Teamcenter
2 6 (0.52%) SAP S/4HANA
3 3 (0.26%) Q-Pulse
3 3 (0.26%) SAP Oil and Gas
3 3 (0.26%) SAP PM
4 1 (0.086%) Primavera
4 1 (0.086%) SAP LE
4 1 (0.086%) SAP PP
Cloud Services
1 18 (1.55%) Azure
2 10 (0.86%) AWS
2 10 (0.86%) Microsoft 365
3 6 (0.52%) OCI
4 3 (0.26%) Entra ID
5 2 (0.17%) Azure DevOps
5 2 (0.17%) GitHub
5 2 (0.17%) GitHub Actions
5 2 (0.17%) OpenShift
5 2 (0.17%) Power Platform
5 2 (0.17%) SaaS
6 1 (0.086%) Amazon EC2
6 1 (0.086%) Amazon EKS
6 1 (0.086%) Amazon S3
6 1 (0.086%) AWS CloudTrail
6 1 (0.086%) AWS Fargate
6 1 (0.086%) Power Automate
6 1 (0.086%) PowerApps
6 1 (0.086%) Serverless
6 1 (0.086%) WhatsApp
Communications & Networking
1 19 (1.63%) Firewall
2 12 (1.03%) WAN
3 9 (0.77%) Internet
4 7 (0.60%) TCP/IP
4 7 (0.60%) Wireless
5 6 (0.52%) LAN
5 6 (0.52%) SD-WAN
6 5 (0.43%) Remote Desktop
7 3 (0.26%) Cisco ASA
7 3 (0.26%) Ethernet
7 3 (0.26%) Software-Defined Networking
7 3 (0.26%) VoIP
7 3 (0.26%) VPN
7 3 (0.26%) Wi-Fi
8 2 (0.17%) DVB
8 2 (0.17%) Intrusion Detection
9 1 (0.086%) DHCP
9 1 (0.086%) DNS
9 1 (0.086%) HTTP
9 1 (0.086%) VLAN
Database & Business Intelligence
1 15 (1.29%) MongoDB
2 5 (0.43%) SQL Server
3 4 (0.34%) Elasticsearch
3 4 (0.34%) Relational Database
4 1 (0.086%) MySQL
4 1 (0.086%) NoSQL
4 1 (0.086%) Oracle Database
4 1 (0.086%) Oracle Reports
4 1 (0.086%) Power BI
4 1 (0.086%) Power Query
4 1 (0.086%) SQLite
Development Applications
1 159 (13.66%) Rational DOORS
2 41 (3.52%) Git
3 14 (1.20%) JIRA
4 8 (0.69%) Subversion
5 7 (0.60%) GitLab
5 7 (0.60%) Jenkins
6 4 (0.34%) Bitbucket
7 2 (0.17%) Burp Suite
7 2 (0.17%) Metasploit
7 2 (0.17%) Visual Studio
8 1 (0.086%) ClearCase
8 1 (0.086%) ClearQuest
8 1 (0.086%) LabVIEW
8 1 (0.086%) TestComplete
General
1 495 (42.53%) Automotive
2 382 (32.82%) Social Skills
3 216 (18.56%) Electronics
4 149 (12.80%) Aeronautics
5 114 (9.79%) Avionics
6 56 (4.81%) Manufacturing
7 43 (3.69%) Analytical Skills
7 43 (3.69%) Aviation
8 25 (2.15%) Military
9 24 (2.06%) Finance
10 16 (1.37%) Telecoms
11 10 (0.86%) Presentation Skills
11 10 (0.86%) Public Sector
12 9 (0.77%) Retail
13 7 (0.60%) French Language
13 7 (0.60%) German Language
13 7 (0.60%) Law
13 7 (0.60%) Legal
14 6 (0.52%) Inclusion and Diversity
14 6 (0.52%) Police
Job Titles
1 775 (66.58%) Systems Engineer
2 460 (39.52%) Senior
3 416 (35.74%) Senior Systems Engineer
4 166 (14.26%) Lead
5 150 (12.89%) Junior
6 145 (12.46%) Junior Systems Engineer
7 136 (11.68%) Software Engineer
8 123 (10.57%) Team Leader
9 122 (10.48%) Lead Systems Engineer
10 100 (8.59%) Development Engineer
11 99 (8.51%) Software Development Engineer
12 81 (6.96%) Principal Engineer
13 70 (6.01%) Integration Engineer
13 70 (6.01%) Systems Integration Engineer
14 67 (5.76%) Principal Software Engineer
14 67 (5.76%) Principal Systems Engineer
15 52 (4.47%) Senior Software Engineer
16 46 (3.95%) Senior Integration Engineer
17 36 (3.09%) Senior Development Engineer
17 36 (3.09%) Senior Software Development Engineer
Libraries, Frameworks & Software Standards
1 16 (1.37%) SAPUI5
2 12 (1.03%) Qt
3 11 (0.95%) Kafka
4 5 (0.43%) React
4 5 (0.43%) XML
5 4 (0.34%) .NET
5 4 (0.34%) Hibernate
5 4 (0.34%) JSF
6 3 (0.26%) Middleware
6 3 (0.26%) SAP Fiori
6 3 (0.26%) WPF
7 2 (0.17%) AngularJS
7 2 (0.17%) Django
7 2 (0.17%) Flask
7 2 (0.17%) HTML
7 2 (0.17%) OGRE
7 2 (0.17%) OpenGL
7 2 (0.17%) Regular Expression
7 2 (0.17%) SOAP
7 2 (0.17%) WCF
Miscellaneous
1 21 (1.80%) Embedded Systems
2 13 (1.12%) Management Information System
2 13 (1.12%) Renewable Energy
3 12 (1.03%) Security Posture
4 9 (0.77%) Cyber Threat
5 8 (0.69%) FPGA
6 7 (0.60%) Algorithms
7 6 (0.52%) Device Driver
7 6 (0.52%) Self-Motivation
8 4 (0.34%) CPLD
8 4 (0.34%) IoT
8 4 (0.34%) VHDL
9 3 (0.26%) e-Learning
9 3 (0.26%) FMCG
9 3 (0.26%) Operational Technology
9 3 (0.26%) Reference Data
9 3 (0.26%) Video Conferencing
10 2 (0.17%) Robotics
10 2 (0.17%) SCADA
10 2 (0.17%) Verilog
Operating Systems
1 29 (2.49%) Linux
2 19 (1.63%) Windows
3 13 (1.12%) Windows Server
4 4 (0.34%) Red Hat Enterprise Linux
4 4 (0.34%) Windows Server 2019
5 3 (0.26%) Windows 10
6 2 (0.17%) Embedded Linux
6 2 (0.17%) VMS
7 1 (0.086%) Android
7 1 (0.086%) Apple iOS
7 1 (0.086%) CentOS
7 1 (0.086%) Ubuntu
7 1 (0.086%) Unix
7 1 (0.086%) Windows Server 2016
Processes & Methodologies
1 879 (75.52%) Systems Engineering
2 335 (28.78%) PLM
3 303 (26.03%) Physics
4 297 (25.52%) Mathematics
5 286 (24.57%) Agile
6 284 (24.40%) Model-Based Systems Engineering
7 257 (22.08%) Software Testing
8 238 (20.45%) Validation
9 223 (19.16%) Project Management
10 198 (17.01%) Continuous Improvement
11 196 (16.84%) SysML
12 190 (16.32%) Requirements Management
13 182 (15.64%) Problem-Solving
14 175 (15.03%) Coaching
15 160 (13.75%) Computer Science
16 152 (13.06%) SDLC
17 150 (12.89%) Software Engineering
18 149 (12.80%) UML
19 147 (12.63%) Creative Problem-Solving
20 126 (10.82%) Customer Requirements
Programming Languages
1 553 (47.51%) MATLAB
2 50 (4.30%) C
2 50 (4.30%) C++
3 48 (4.12%) SQL
4 40 (3.44%) Python
5 39 (3.35%) Java
6 17 (1.46%) C#
7 12 (1.03%) VB
8 8 (0.69%) Embedded C
8 8 (0.69%) JavaScript
9 5 (0.43%) Perl
9 5 (0.43%) PowerShell
9 5 (0.43%) R
10 4 (0.34%) Bash
10 4 (0.34%) Embedded C++
10 4 (0.34%) TypeScript
11 3 (0.26%) Ada
11 3 (0.26%) PL/SQL
12 2 (0.17%) VB.NET
13 1 (0.086%) ABAP
Qualifications
1 842 (72.34%) BPSS Clearance
2 738 (63.40%) Degree
3 253 (21.74%) HND
4 197 (16.92%) HNC
5 89 (7.65%) Security Cleared
6 48 (4.12%) SC Cleared
7 29 (2.49%) Master's Degree
8 20 (1.72%) PhD
9 10 (0.86%) DV Cleared
10 6 (0.52%) CISSP
11 5 (0.43%) Computer Science Degree
12 4 (0.34%) Microsoft Certification
12 4 (0.34%) TOGAF Certification
13 2 (0.17%) CEH
13 2 (0.17%) CHECK Team Member
13 2 (0.17%) CISM
13 2 (0.17%) CompTIA Security+
13 2 (0.17%) CREST Certified
14 1 (0.086%) DBS Check
14 1 (0.086%) ISTQB Foundation Certification
Quality Assurance & Compliance
1 15 (1.29%) Def Stans
2 14 (1.20%) ISO/IEC 27001
3 13 (1.12%) NIST
4 12 (1.03%) QA
5 4 (0.34%) Cyber Essentials
5 4 (0.34%) Cyber Essentials PLUS
6 3 (0.26%) Data Quality
6 3 (0.26%) ISO 9001
7 2 (0.17%) Actionable Recommendations
8 1 (0.086%) Accessibility
8 1 (0.086%) ARP4761
8 1 (0.086%) Automotive SPICE
8 1 (0.086%) AUTOSAR
8 1 (0.086%) DO-178B
8 1 (0.086%) ECSS
8 1 (0.086%) IEC 61508
8 1 (0.086%) ISO 26262
8 1 (0.086%) MISRA
8 1 (0.086%) MISRA C
8 1 (0.086%) RMADS
System Software
1 9 (0.77%) Active Directory
2 5 (0.43%) Firmware
2 5 (0.43%) Terminal Services
3 4 (0.34%) VMware Infrastructure
4 3 (0.26%) VMware NSX
5 2 (0.17%) Docker
6 1 (0.086%) Embedded Firmware
6 1 (0.086%) Hyper-V
Systems Management
1 6 (0.52%) Kubernetes
2 4 (0.34%) Kibana
3 3 (0.26%) Ansible
3 3 (0.26%) Microsoft Intune
3 3 (0.26%) SCCM
4 2 (0.17%) Nmap
5 1 (0.086%) Computer Emergency Response Teams
5 1 (0.086%) Functional Safety
5 1 (0.086%) Marathon
5 1 (0.086%) QRadar
5 1 (0.086%) Terraform
Vendors
1 241 (20.70%) Microsoft
2 187 (16.07%) ANSYS
3 147 (12.63%) IBM
4 50 (4.30%) MathWorks
5 42 (3.61%) Oracle
6 35 (3.01%) SAP
7 22 (1.89%) VMware
8 12 (1.03%) Cisco
9 10 (0.86%) Atlassian
10 8 (0.69%) PayPal
11 7 (0.60%) Siemens
12 6 (0.52%) Red Hat
13 4 (0.34%) Agilent
14 3 (0.26%) Aruba
14 3 (0.26%) Fortinet
14 3 (0.26%) Okta
14 3 (0.26%) Rockwell
14 3 (0.26%) Twitter
14 3 (0.26%) Xilinx
15 2 (0.17%) Citrix