Bitbucket Jobs

Bitbucket
UK

The table below provides summary statistics for permanent job vacancies requiring Bitbucket skills. It includes a benchmarking guide to the annual salaries offered in vacancies that cited Bitbucket over the 6 months leading up to 15 May 2025, comparing them to the same period in the previous two years.

6 months to
15 May 2025
Same period 2024 Same period 2023
Rank 367 532 537
Rank change year-on-year +165 +5 -149
Permanent jobs citing Bitbucket 385 408 508
As % of all permanent jobs advertised in the UK 0.70% 0.41% 0.51%
As % of the Development Applications category 6.39% 4.30% 3.56%
Number of salaries quoted 74 286 302
10th Percentile £45,725 £27,500 £47,500
25th Percentile £48,869 £36,250 £56,250
Median annual salary (50th Percentile) £57,500 £50,000 £70,000
Median % change year-on-year +15.00% -28.57% +7.69%
75th Percentile £75,000 £67,500 £83,438
90th Percentile £100,000 £77,500 £100,000
UK excluding London median annual salary £50,055 £50,000 £62,500
% change year-on-year +0.11% -20.00% +13.64%

All Development Application Skills
UK

Bitbucket falls under the Development Applications category. For comparison with the information above, the following table provides summary statistics for all permanent job vacancies requiring development application skills.

Permanent vacancies with a requirement for development application skills 6,025 9,499 14,271
As % of all permanent jobs advertised in the UK 10.92% 9.59% 14.22%
Number of salaries quoted 3,719 6,670 8,765
10th Percentile £37,574 £36,250 £41,250
25th Percentile £46,250 £45,000 £50,000
Median annual salary (50th Percentile) £60,000 £60,000 £65,000
Median % change year-on-year - -7.69% +4.00%
75th Percentile £75,000 £77,500 £82,500
90th Percentile £96,250 £95,000 £100,000
UK excluding London median annual salary £57,500 £55,000 £57,500
% change year-on-year +4.55% -4.35% +4.55%

Bitbucket
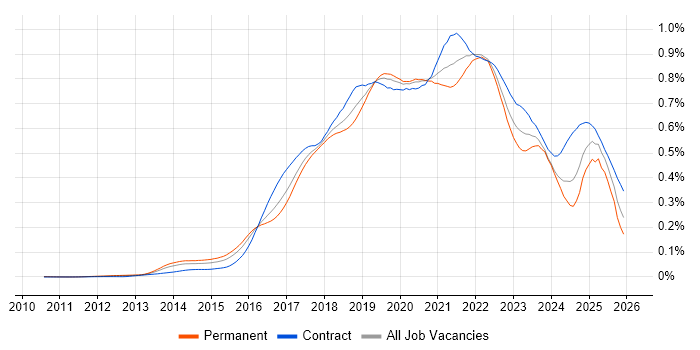
Job Vacancy Trend

Job postings citing Bitbucket as a proportion of all IT jobs advertised.

Job vacancy trend for Bitbucket in the UK

Bitbucket
Salary Trend

3-month moving average salary quoted in jobs citing Bitbucket.

Salary trend for Bitbucket in the UK

Bitbucket
Salary Histogram

Salary distribution for jobs citing Bitbucket over the 6 months to 15 May 2025.

Salary histogram for Bitbucket in the UK

Bitbucket
Top 16 Job Locations

The table below looks at the demand and provides a guide to the median salaries quoted in IT jobs citing Bitbucket within the UK over the 6 months to 15 May 2025. The 'Rank Change' column provides an indication of the change in demand within each location based on the same 6 month period last year.

Location Rank Change
on Same Period
Last Year
Matching
Permanent
IT Job Ads
Median Salary
Past 6 Months
Median Salary
% Change
on Same Period
Last Year
Live
Jobs
UK excluding London +171 341 £50,055 +0.11% 163
England +152 326 £57,500 +15.00% 232
Work from Home +271 270 £56,250 -5.06% 149
North of England +143 136 £50,055 -16.58% 35
North West +91 132 £50,055 -8.99% 23
Midlands +140 93 £45,000 -14.29% 13
East Midlands +79 49 £45,000 -14.29% 3
Scotland +70 49 - - 21
West Midlands +91 44 - - 9
London +56 40 £70,000 -3.45% 123
South East +88 30 £52,500 +16.02% 63
East of England +45 22 £47,500 +2.70% 1
Northern Ireland - 5 £55,000 - 7
South West +18 4 £60,000 +66.67% 20
North East - 4 £65,000 - 8
Wales - 3 £70,000 - 7

Bitbucket
Co-occurring Skills and Capabilities by Category

The follow tables expand on the table above by listing co-occurrences grouped by category. The same employment type, locality and period is covered with up to 20 co-occurrences shown in each of the following categories:

Application Platforms
1 220 (57.14%) Confluence
2 12 (3.12%) Tomcat
3 9 (2.34%) Apache Airflow
4 8 (2.08%) nginx
5 7 (1.82%) Apache
5 7 (1.82%) Apache Spark
6 3 (0.78%) CMS
6 3 (0.78%) Headless CMS
6 3 (0.78%) Mule
6 3 (0.78%) Oracle Coherence
6 3 (0.78%) Oracle SOA Suite
7 2 (0.52%) CICS
7 2 (0.52%) Microsoft Exchange
7 2 (0.52%) OpenEdge
7 2 (0.52%) SharePoint
7 2 (0.52%) WordPress
8 1 (0.26%) OpenStack
8 1 (0.26%) Oracle Application Server
8 1 (0.26%) Oracle Workflow
Applications
1 1 (0.26%) Microsoft Excel
1 1 (0.26%) Trello
Business Applications
1 1 (0.26%) Oracle EBS
1 1 (0.26%) Oracle EBS R12
1 1 (0.26%) Oracle General Ledger
1 1 (0.26%) Oracle Payables
1 1 (0.26%) Oracle Receivables
1 1 (0.26%) Payment Gateway
Cloud Services
1 289 (75.06%) AWS
2 261 (67.79%) Azure
3 165 (42.86%) GCP
4 10 (2.60%) GitHub
4 10 (2.60%) Serverless
5 9 (2.34%) Amazon ElastiCache
5 9 (2.34%) AWS CloudFormation
6 8 (2.08%) Amazon OpenSearch
6 8 (2.08%) Amazon SQS
6 8 (2.08%) Azure DevOps
7 7 (1.82%) Amazon EKS
7 7 (1.82%) AWS Lambda
7 7 (1.82%) OpenShift
8 5 (1.30%) SaaS
9 3 (0.78%) Amazon ECS
9 3 (0.78%) Amazon S3
9 3 (0.78%) Contentful
9 3 (0.78%) Microsoft 365
9 3 (0.78%) Power Platform
9 3 (0.78%) Salesforce Service Cloud
Communications & Networking
1 7 (1.82%) Firewall
2 1 (0.26%) Bluetooth
2 1 (0.26%) DHCP
2 1 (0.26%) DNS
2 1 (0.26%) Internet
2 1 (0.26%) Network Security
2 1 (0.26%) OpenVPN
2 1 (0.26%) SAN
2 1 (0.26%) SSH
Database & Business Intelligence
1 257 (66.75%) SQL Server
2 45 (11.69%) MySQL
3 41 (10.65%) Relational Database
4 19 (4.94%) PostgreSQL
5 12 (3.12%) Elasticsearch
5 12 (3.12%) NoSQL
6 11 (2.86%) Amazon Aurora
7 10 (2.60%) Amazon RDS
8 8 (2.08%) Data Warehouse
9 7 (1.82%) Apache Hudi
9 7 (1.82%) Apache Iceberg
9 7 (1.82%) Delta Lake
9 7 (1.82%) Hadoop
9 7 (1.82%) MongoDB
10 3 (0.78%) Azure SQL Database
10 3 (0.78%) Power BI
10 3 (0.78%) SQL Server Integration Services
11 2 (0.52%) RDBMS
11 2 (0.52%) SQL Server Analysis Services
11 2 (0.52%) SQL Server Reporting Services
Development Applications
1 337 (87.53%) JIRA
2 258 (67.01%) Selenium
3 257 (66.75%) Cucumber
3 257 (66.75%) SonarQube
4 256 (66.49%) GitLab
4 256 (66.49%) Maven
5 250 (64.94%) Sonatype Nexus
6 72 (18.70%) Git
7 26 (6.75%) Jenkins
8 23 (5.97%) Atlassian Bamboo
9 15 (3.90%) Rational DOORS
10 10 (2.60%) JUnit
11 9 (2.34%) Postman
12 8 (2.08%) Mockito
12 8 (2.08%) TestNG
13 5 (1.30%) Artifactory
14 2 (0.52%) CircleCI
14 2 (0.52%) NeoLoad
14 2 (0.52%) Octopus Deploy
14 2 (0.52%) TestRail
General
1 273 (70.91%) Finance
2 248 (64.42%) Inclusion and Diversity
3 247 (64.16%) Banking
4 91 (23.64%) Retail
5 90 (23.38%) Corporate Banking
5 90 (23.38%) Investment Banking
6 26 (6.75%) Social Skills
7 14 (3.64%) Public Sector
8 13 (3.38%) Analytical Skills
9 9 (2.34%) Law
9 9 (2.34%) Manufacturing
10 1 (0.26%) Advertising
10 1 (0.26%) Aerospace
10 1 (0.26%) Automotive
10 1 (0.26%) Electronics
10 1 (0.26%) Games
10 1 (0.26%) iGaming
10 1 (0.26%) Marketing
10 1 (0.26%) Pharmaceutical
10 1 (0.26%) Publishing
Job Titles
1 279 (72.47%) Software Engineer
2 53 (13.77%) Senior
3 30 (7.79%) Developer
4 27 (7.01%) Senior Software Engineer
5 17 (4.42%) Lead
6 16 (4.16%) IT Engineer
6 16 (4.16%) Systems Engineer
7 15 (3.90%) Senior Data Warehouse Specialist
8 11 (2.86%) Principal Engineer
8 11 (2.86%) Principal Systems Engineer
9 10 (2.60%) DevOps Engineer
10 9 (2.34%) Data Engineer
10 9 (2.34%) Java Engineer
10 9 (2.34%) Senior Developer
11 8 (2.08%) Senior DevOps
11 8 (2.08%) Senior DevOps Engineer
12 7 (1.82%) Cloud Engineer
12 7 (1.82%) Full-Stack Developer
12 7 (1.82%) Senior Cloud Engineer
13 6 (1.56%) Lead Developer
Libraries, Frameworks & Software Standards
1 266 (69.09%) Kafka
2 261 (67.79%) Spring
3 260 (67.53%) HTML
3 260 (67.53%) React
4 259 (67.27%) CSS
5 258 (67.01%) Spring Boot
6 248 (64.42%) Redux
7 247 (64.16%) JPA
8 160 (41.56%) Hibernate
9 113 (29.35%) REST
10 102 (26.49%) RESTful
11 96 (24.94%) HTML5
12 94 (24.42%) Sass
13 93 (24.16%) CSS3
14 92 (23.90%) Jest
15 45 (11.69%) .NET
16 12 (3.12%) Elastic Stack
17 9 (2.34%) Gherkin
17 9 (2.34%) OpenAPI
17 9 (2.34%) Swagger
Miscellaneous
1 249 (64.68%) Product Ownership
2 247 (64.16%) Enterprise Software
3 8 (2.08%) Life Science
3 8 (2.08%) Mobile App
4 4 (1.04%) Cloud Native
5 3 (0.78%) Virtual Team
6 1 (0.26%) Data Centre
6 1 (0.26%) Data Protection Act
6 1 (0.26%) Equities
6 1 (0.26%) Greenfield Project
6 1 (0.26%) IoT
6 1 (0.26%) Management Information System
6 1 (0.26%) NHS
6 1 (0.26%) Onboarding
6 1 (0.26%) Smartphone
6 1 (0.26%) Team-Oriented Environment
6 1 (0.26%) Wiki
Operating Systems
1 57 (14.81%) Linux
2 45 (11.69%) Windows
3 9 (2.34%) Unix
4 4 (1.04%) Android
4 4 (1.04%) Red Hat Enterprise Linux
5 2 (0.52%) Apple iOS
5 2 (0.52%) zOS
6 1 (0.26%) Debian
6 1 (0.26%) Windows Server
Processes & Methodologies
1 333 (86.49%) Agile
2 316 (82.08%) CI/CD
3 282 (73.25%) Software Engineering
4 281 (72.99%) DevOps
5 259 (67.27%) Microservices
5 259 (67.27%) Test Automation
6 257 (66.75%) Full-Stack Development
7 255 (66.23%) Front End Development
8 254 (65.97%) SDLC
9 251 (65.19%) Containerisation
10 249 (64.68%) Performance Optimisation
11 164 (42.60%) TDD
12 157 (40.78%) Clean Code
12 157 (40.78%) Continuous Improvement
13 107 (27.79%) Mentoring
14 96 (24.94%) User Experience
15 91 (23.64%) Migration
15 91 (23.64%) Responsive Web Design
16 90 (23.38%) Strategic Thinking
17 46 (11.95%) Continuous Integration
Programming Languages
1 293 (76.10%) Java
2 269 (69.87%) JavaScript
2 269 (69.87%) SQL
3 103 (26.75%) TypeScript
4 62 (16.10%) C#
5 28 (7.27%) Python
6 18 (4.68%) C
7 16 (4.16%) VB
8 15 (3.90%) Ada
9 8 (2.08%) PHP
10 6 (1.56%) Bash
10 6 (1.56%) PowerShell
11 5 (1.30%) Apex Code
11 5 (1.30%) Go
12 4 (1.04%) Objective-C
12 4 (1.04%) T-SQL
13 3 (0.78%) C++
13 3 (0.78%) XQuery
14 2 (0.52%) COBOL
14 2 (0.52%) Progress 4GL
Qualifications
1 42 (10.91%) BPSS Clearance
2 19 (4.94%) Degree
3 5 (1.30%) Security Cleared
4 3 (0.78%) Microsoft Certification
4 3 (0.78%) SC Cleared
5 2 (0.52%) DV Cleared
Quality Assurance & Compliance
1 253 (65.71%) QA
2 101 (26.23%) Accessibility
3 7 (1.82%) Data Quality
4 3 (0.78%) WCAG
5 2 (0.52%) SLA
6 1 (0.26%) IEC 62304
6 1 (0.26%) ISO 13485
6 1 (0.26%) PCI DSS
System Software
1 268 (69.61%) Docker
2 7 (1.82%) HDFS
3 3 (0.78%) Active Directory
4 1 (0.26%) VMware ESXi
4 1 (0.26%) VMware Infrastructure
4 1 (0.26%) vSphere
Systems Management
1 273 (70.91%) Kubernetes
2 65 (16.88%) Ansible
3 23 (5.97%) Terraform
4 9 (2.34%) Kustomize
4 9 (2.34%) Packer
5 5 (1.30%) Grafana
5 5 (1.30%) Prometheus
6 2 (0.52%) CA Endevor
6 2 (0.52%) Kibana
7 1 (0.26%) Check_MK
7 1 (0.26%) Control-M
7 1 (0.26%) Docker Swarm
7 1 (0.26%) FortiGate
7 1 (0.26%) ITRS Geneos
7 1 (0.26%) logstash
7 1 (0.26%) Opsgenie
7 1 (0.26%) Puppet
7 1 (0.26%) Rundeck
7 1 (0.26%) Single Sign-On
7 1 (0.26%) vCenter Server
Vendors
1 250 (64.94%) Solace
2 52 (13.51%) Atlassian
3 16 (4.16%) Red Hat
4 9 (2.34%) Microsoft
5 6 (1.56%) Oracle
6 5 (1.30%) Google
6 5 (1.30%) Salesforce
7 4 (1.04%) MuleSoft
7 4 (1.04%) Splunk
7 4 (1.04%) Xamarin
8 3 (0.78%) Cisco
8 3 (0.78%) Juniper
8 3 (0.78%) Palo Alto
9 2 (0.52%) AppDynamics
9 2 (0.52%) Dynatrace
9 2 (0.52%) IBM
9 2 (0.52%) Informatica
9 2 (0.52%) VMware
10 1 (0.26%) New Relic
10 1 (0.26%) SaltStack