Scrum
UK

The table below provides summary statistics for permanent job vacancies requiring Scrum skills. It includes a benchmarking guide to the annual salaries offered in vacancies that cited Scrum over the 6 months leading up to 2 December 2024, comparing them to the same period in the previous two years.

6 months to
2 Dec 2024
Same period 2023 Same period 2022
Rank 83 52 27
Rank change year-on-year -31 -25 0
Permanent jobs citing Scrum 2,136 2,744 10,445
As % of all permanent jobs advertised in the UK 2.94% 5.11% 8.34%
As % of the Processes & Methodologies category 3.38% 5.43% 8.71%
Number of salaries quoted 1,027 2,086 5,815
10th Percentile £42,500 £42,500 £45,000
25th Percentile £50,000 £51,250 £52,500
Median annual salary (50th Percentile) £65,000 £65,000 £65,000
Median % change year-on-year - - +8.33%
75th Percentile £80,000 £79,313 £82,500
90th Percentile £100,000 £92,500 £98,750
UK excluding London median annual salary £60,000 £60,000 £60,000
% change year-on-year - - +13.39%

All Process and Methodology Skills
UK

Scrum falls under the Processes and Methodologies category. For comparison with the information above, the following table provides summary statistics for all permanent job vacancies requiring process or methodology skills.

Permanent vacancies with a requirement for process or methodology skills 63,259 50,511 119,933
As % of all permanent jobs advertised in the UK 87.19% 94.09% 95.74%
Number of salaries quoted 29,613 36,606 73,145
10th Percentile £35,000 £32,500 £34,500
25th Percentile £45,000 £43,750 £45,000
Median annual salary (50th Percentile) £60,000 £60,000 £60,000
75th Percentile £78,750 £80,000 £81,635
90th Percentile £97,500 £98,750 £100,000
UK excluding London median annual salary £54,784 £52,500 £53,000
% change year-on-year +4.35% -0.94% +6.00%

Scrum
Job Vacancy Trend

Job postings citing Scrum as a proportion of all IT jobs advertised.
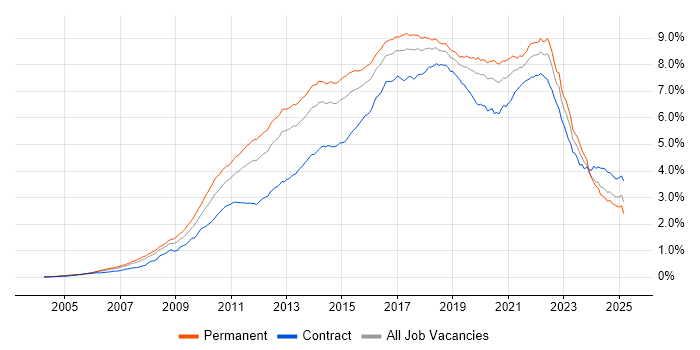
Job vacancy trend for Scrum in the UK

Scrum
Salary Trend

3-month moving average salary quoted in jobs citing Scrum.

Salary trend for Scrum in the UK

Scrum
Salary Histogram

Salary distribution for jobs citing Scrum over the 6 months to 2 December 2024.

Salary histogram for Scrum in the UK

Scrum
Top 17 Job Locations

The table below looks at the demand and provides a guide to the median salaries quoted in IT jobs citing Scrum within the UK over the 6 months to 2 December 2024. The 'Rank Change' column provides an indication of the change in demand within each location based on the same 6 month period last year.

Location Rank Change
on Same Period
Last Year
Matching
Permanent
IT Job Ads
Median Salary
Past 6 Months
Median Salary
% Change
on Same Period
Last Year
Live
Jobs
England -35 1,896 £65,000 - 721
UK excluding London -24 1,470 £60,000 - 453
Work from Home -16 961 £64,108 -1.37% 766
London -38 637 £76,000 +1.33% 288
South East +7 466 £65,000 - 97
North of England -37 312 £57,000 -5.00% 143
North West -28 201 £57,500 -4.17% 93
South West -28 198 £57,500 -4.17% 68
Midlands -68 173 £62,500 +4.17% 69
Scotland -16 138 £55,000 -7.60% 21
West Midlands -59 123 £62,500 +8.70% 45
East of England -30 117 £53,000 -11.67% 37
Yorkshire -31 97 £55,000 -5.00% 38
East Midlands -72 48 £60,000 -4.00% 22
Wales -2 44 £52,592 -4.38% 16
Northern Ireland +26 25 £50,000 +25.00% 6
North East -43 14 £57,500 - 15

Scrum
Co-occurring Skills and Capabilities by Category

The follow tables expand on the table above by listing co-occurrences grouped by category. The same employment type, locality and period is covered with up to 20 co-occurrences shown in each of the following categories:

Application Platforms
1 122 (5.71%) Confluence
2 31 (1.45%) CMS
3 27 (1.26%) SharePoint
4 23 (1.08%) nginx
5 18 (0.84%) Apache Spark
6 17 (0.80%) Apache
7 14 (0.66%) Umbraco
8 13 (0.61%) Kentico
9 10 (0.47%) Sitecore CMS
10 9 (0.42%) ArcGIS
10 9 (0.42%) Sitefinity
11 8 (0.37%) OpenStack
12 7 (0.33%) Apache Airflow
13 6 (0.28%) Tomcat
14 5 (0.23%) JBoss
14 5 (0.23%) Red Hat Fuse
15 4 (0.19%) Apache Solr
15 4 (0.19%) IIS
15 4 (0.19%) Oracle Application Server
15 4 (0.19%) SAS
Applications
1 42 (1.97%) Microsoft Office
2 32 (1.50%) Microsoft Project
3 24 (1.12%) Microsoft Excel
4 18 (0.84%) Trello
5 17 (0.80%) Simulink
6 16 (0.75%) MS Visio
7 10 (0.47%) Microsoft PowerPoint
8 9 (0.42%) Adobe XD
9 5 (0.23%) Sketch
10 4 (0.19%) MadCap Flare
10 4 (0.19%) RoboHelp
11 3 (0.14%) Windchill
12 2 (0.094%) Adobe Creative Suite
13 1 (0.047%) AutoCAD
13 1 (0.047%) Chatbot
13 1 (0.047%) EngageOne
13 1 (0.047%) Notion
Business Applications
1 18 (0.84%) Dynamics CRM
2 14 (0.66%) Maximo
3 12 (0.56%) SAP S/4HANA
4 8 (0.37%) Magento
5 6 (0.28%) Sparx Enterprise Architect
6 4 (0.19%) NEC Housing
6 4 (0.19%) Shopify
7 3 (0.14%) Fidessa
8 2 (0.094%) Dynamics NAV
8 2 (0.094%) iTrent
8 2 (0.094%) Oracle Applications
8 2 (0.094%) Payment Gateway
8 2 (0.094%) Primavera
8 2 (0.094%) SAP Hybris
9 1 (0.047%) Avolution ABACUS
9 1 (0.047%) Elite 3E
9 1 (0.047%) NetSuite
9 1 (0.047%) ResourceLink
9 1 (0.047%) SAP ERP
9 1 (0.047%) TIBCO iProcess
Cloud Services
1 720 (33.71%) AWS
2 562 (26.31%) Azure
3 354 (16.57%) Serverless
4 301 (14.09%) Amazon S3
5 284 (13.30%) GitHub
6 277 (12.97%) AWS Lambda
7 276 (12.92%) Amazon SQS
8 233 (10.91%) Amazon Kinesis
9 163 (7.63%) GCP
10 153 (7.16%) Azure DevOps
11 112 (5.24%) Power Platform
12 90 (4.21%) SaaS
13 53 (2.48%) Azure Data Factory
14 41 (1.92%) AWS CloudFormation
15 37 (1.73%) Azure Functions
16 36 (1.69%) Azure Synapse Analytics
17 34 (1.59%) Amazon EKS
18 30 (1.40%) Amazon ECS
18 30 (1.40%) Snowflake
19 29 (1.36%) Microsoft 365
Communications & Networking
1 54 (2.53%) Firewall
2 53 (2.48%) Broadband
3 33 (1.54%) DNS
4 28 (1.31%) Internet
5 14 (0.66%) TCP/IP
6 13 (0.61%) IPv6
6 13 (0.61%) Reverse Proxy
6 13 (0.61%) Wireless
7 8 (0.37%) Bluetooth
8 7 (0.33%) HTTP
8 7 (0.33%) Wi-Fi
9 6 (0.28%) GSM
9 6 (0.28%) J1939
10 5 (0.23%) 3G
10 5 (0.23%) GPRS
10 5 (0.23%) Intranet
10 5 (0.23%) LTE
10 5 (0.23%) Modbus
10 5 (0.23%) SSL
11 4 (0.19%) SAN
Database & Business Intelligence
1 313 (14.65%) PostgreSQL
2 243 (11.38%) DynamoDB
2 243 (11.38%) Redis
3 183 (8.57%) Relational Database
4 161 (7.54%) SQL Server
5 76 (3.56%) Data Warehouse
6 75 (3.51%) NoSQL
6 75 (3.51%) Power BI
7 73 (3.42%) MySQL
8 66 (3.09%) MongoDB
9 55 (2.57%) Azure SQL Database
10 35 (1.64%) Data Lake
10 35 (1.64%) Elasticsearch
11 31 (1.45%) BigQuery
12 29 (1.36%) SQL Server Reporting Services
13 28 (1.31%) SQL Server Integration Services
14 22 (1.03%) Tableau
15 20 (0.94%) Big Data
16 18 (0.84%) Amazon RDS
16 18 (0.84%) RDBMS
Development Applications
1 348 (16.29%) Jenkins
2 320 (14.98%) JIRA
3 239 (11.19%) Git
4 65 (3.04%) Selenium
5 57 (2.67%) GitLab
6 40 (1.87%) Visual Studio
7 33 (1.54%) JUnit
7 33 (1.54%) SpecFlow
8 30 (1.40%) Bitbucket
9 27 (1.26%) Cucumber
10 21 (0.98%) Maven
10 21 (0.98%) Subversion
11 20 (0.94%) Postman
12 19 (0.89%) JMeter
13 18 (0.84%) NUnit
14 17 (0.80%) Mockito
15 14 (0.66%) Cypress.io
15 14 (0.66%) Rational Rhapsody
16 13 (0.61%) Team Foundation Server
17 12 (0.56%) Zephyr
General
1 704 (32.96%) Social Skills
2 329 (15.40%) Finance
3 322 (15.07%) Marketing
4 321 (15.03%) Inclusion and Diversity
5 296 (13.86%) Analytical Skills
6 237 (11.10%) Advertising
7 146 (6.84%) Public Sector
8 78 (3.65%) Military
9 72 (3.37%) Retail
10 58 (2.72%) Law
11 55 (2.57%) Manufacturing
12 50 (2.34%) Electronics
12 50 (2.34%) Organisational Skills
13 48 (2.25%) Banking
14 46 (2.15%) Games
15 45 (2.11%) Publishing
16 43 (2.01%) Tech for Good
17 40 (1.87%) Presentation Skills
18 37 (1.73%) Automotive
19 36 (1.69%) Influencing Skills
Job Titles
1 496 (23.22%) Developer
2 445 (20.83%) Software Engineer
3 400 (18.73%) Senior
4 252 (11.80%) Lead
5 170 (7.96%) Architect
6 147 (6.88%) Senior Developer
7 122 (5.71%) Analyst
8 86 (4.03%) Project Manager
9 75 (3.51%) Product Owner
9 75 (3.51%) Software Developer
10 73 (3.42%) Senior Software Engineer
10 73 (3.42%) Solutions Architect
11 71 (3.32%) Business Analyst
12 70 (3.28%) Delivery Manager
13 67 (3.14%) Full-Stack Developer
13 67 (3.14%) Scrum Master
14 57 (2.67%) Data Engineer
15 54 (2.53%) Java Developer
16 51 (2.39%) .NET Developer
16 51 (2.39%) C# Developer
Libraries, Frameworks & Software Standards
1 475 (22.24%) React
2 426 (19.94%) AngularJS
3 366 (17.13%) REST
4 338 (15.82%) Node.js
5 280 (13.11%) .NET
6 234 (10.96%) Tailwind CSS
7 228 (10.67%) HTML
8 213 (9.97%) CSS
9 144 (6.74%) Web Services
10 129 (6.04%) RESTful
11 118 (5.52%) Spring
12 100 (4.68%) Spring Boot
13 95 (4.45%) .NET Framework
14 82 (3.84%) ASP.NET
15 72 (3.37%) Middleware
16 68 (3.18%) LDAP
17 59 (2.76%) Ajax
18 56 (2.62%) HTML5
19 55 (2.57%) .NET Core
20 46 (2.15%) Vue
Miscellaneous
1 296 (13.86%) Product Ownership
2 234 (10.96%) Blog
3 232 (10.86%) Digital Media
4 96 (4.49%) Management Information System
5 55 (2.57%) Cloud Native
6 50 (2.34%) Mobile App
6 50 (2.34%) Self-Motivation
7 39 (1.83%) Distributed Systems
7 39 (1.83%) Enterprise Software
8 37 (1.73%) Virtual Team
9 34 (1.59%) IoT
10 33 (1.54%) Public Cloud
11 29 (1.36%) Legacy Systems
12 28 (1.31%) CMDB
13 22 (1.03%) Greenfield Project
14 21 (0.98%) Data Structures
15 20 (0.94%) Mobile Games
15 20 (0.94%) Onboarding
15 20 (0.94%) PMI
16 19 (0.89%) Video\Live Streaming
Operating Systems
1 139 (6.51%) Linux
2 52 (2.43%) Windows
3 39 (1.83%) Android
4 34 (1.59%) Apple iOS
5 23 (1.08%) Unix
6 15 (0.70%) VxWorks
6 15 (0.70%) Windows Server
7 8 (0.37%) Red Hat Enterprise Linux
8 7 (0.33%) Mac OS
9 5 (0.23%) CentOS
10 4 (0.19%) Embedded Linux
10 4 (0.19%) Ubuntu
11 2 (0.094%) VMS
12 1 (0.047%) Alpine Linux
12 1 (0.047%) Debian
12 1 (0.047%) Windows Server 2012
12 1 (0.047%) Windows Server 2016
12 1 (0.047%) Windows Server 2019
12 1 (0.047%) zOS
Processes & Methodologies
1 1,938 (90.73%) Agile
2 656 (30.71%) Software Engineering
3 468 (21.91%) Kanban
4 466 (21.82%) DevOps
5 438 (20.51%) CI/CD
6 433 (20.27%) Full-Stack Development
7 428 (20.04%) Problem-Solving
8 347 (16.25%) User Experience
9 309 (14.47%) Test Automation
10 295 (13.81%) Continuous Delivery
10 295 (13.81%) Roadmaps
11 282 (13.20%) Epics
12 277 (12.97%) E-Commerce
13 269 (12.59%) Mentoring
14 263 (12.31%) Continuous Improvement
15 244 (11.42%) TDD
16 225 (10.53%) Project Management
17 220 (10.30%) Microservices
18 217 (10.16%) SDLC
19 202 (9.46%) Stakeholder Management
Programming Languages
1 400 (18.73%) TypeScript
2 396 (18.54%) JavaScript
3 365 (17.09%) SQL
4 354 (16.57%) Python
5 321 (15.03%) Java
6 304 (14.23%) C#
7 74 (3.46%) C++
8 41 (1.92%) PowerShell
9 40 (1.87%) C
10 39 (1.83%) PHP
11 29 (1.36%) Kotlin
12 25 (1.17%) Go
13 21 (0.98%) T-SQL
14 20 (0.94%) Shell Script
15 18 (0.84%) MATLAB
16 17 (0.80%) Bash
17 13 (0.61%) Scala
18 12 (0.56%) Apex Code
19 9 (0.42%) PL/SQL
19 9 (0.42%) Ruby
Qualifications
1 376 (17.60%) Degree
2 348 (16.29%) Security Cleared
3 241 (11.28%) SC Cleared
4 128 (5.99%) Computer Science Degree
5 126 (5.90%) DV Cleared
6 60 (2.81%) Master's Degree
7 56 (2.62%) Azure Certification
7 56 (2.62%) PMI Certification
8 46 (2.15%) PMP
9 27 (1.26%) ISTQB
10 21 (0.98%) DBS Check
11 19 (0.89%) Microsoft Certification
12 18 (0.84%) AWS Certification
12 18 (0.84%) ITIL Foundation Certificate
13 16 (0.75%) TOGAF Certification
14 14 (0.66%) PRINCE2 Certification
15 13 (0.61%) PRINCE2 Practitioner
16 12 (0.56%) CSPO
16 12 (0.56%) ISEB
17 10 (0.47%) PhD
Quality Assurance & Compliance
1 217 (10.16%) QA
2 49 (2.29%) Data Quality
3 34 (1.59%) Accessibility
4 24 (1.12%) ISO/IEC 27001
5 18 (0.84%) PMO
6 16 (0.75%) Cyber Essentials
7 14 (0.66%) NIST
8 13 (0.61%) GRC
9 11 (0.51%) SLA
10 9 (0.42%) Automotive SPICE
10 9 (0.42%) AUTOSAR
10 9 (0.42%) GDPR
10 9 (0.42%) PCI DSS
11 8 (0.37%) NCSC
12 5 (0.23%) IEC 62304
12 5 (0.23%) ISO 13485
13 4 (0.19%) Software Quality Assurance
14 3 (0.14%) Cyber Essentials PLUS
14 3 (0.14%) ISO 26262
14 3 (0.14%) MISRA C
System Software
1 388 (18.16%) Docker
2 28 (1.31%) Active Directory
3 22 (1.03%) Firmware
4 16 (0.75%) Virtual Servers
5 10 (0.47%) VMware Infrastructure
6 9 (0.42%) NDS
6 9 (0.42%) NetIQ eDirectory
7 8 (0.37%) Virtual Machines
8 7 (0.33%) Hyper-V
8 7 (0.33%) VMware ESXi
9 5 (0.23%) vSphere
10 2 (0.094%) Embedded Firmware
10 2 (0.094%) Microsoft Virtual Server
11 1 (0.047%) Postfix
Systems Management
1 391 (18.31%) Kubernetes
2 71 (3.32%) Terraform
3 65 (3.04%) Single Sign-On
4 46 (2.15%) Ansible
5 19 (0.89%) Puppet
6 16 (0.75%) Istio
7 13 (0.61%) Kibana
7 13 (0.61%) Progress Chef
8 12 (0.56%) HP ALM
8 12 (0.56%) Prometheus
9 11 (0.51%) NetIQ Identity Manager
10 9 (0.42%) Grafana
11 5 (0.23%) vCenter Server
12 4 (0.19%) CSIRT
12 4 (0.19%) SCCM
13 3 (0.14%) Argo
14 2 (0.094%) Consul
14 2 (0.094%) Functional Safety
14 2 (0.094%) Kustomize
14 2 (0.094%) MIIS
Vendors
1 273 (12.78%) Microsoft
2 112 (5.24%) Google
3 90 (4.21%) ServiceNow
4 60 (2.81%) Databricks
5 57 (2.67%) Oracle
6 46 (2.15%) SAP
7 43 (2.01%) Salesforce
8 32 (1.50%) Atlassian
9 19 (0.89%) Splunk
10 18 (0.84%) Xamarin
11 16 (0.75%) Adobe
12 15 (0.70%) ForgeRock
12 15 (0.70%) IBM
13 14 (0.66%) HP
13 14 (0.66%) VMware
13 14 (0.66%) Wind River
14 13 (0.61%) Informatica
15 12 (0.56%) Optimizely
16 11 (0.51%) NetIQ
16 11 (0.51%) Red Hat