Test Automation Job Trends

Automated Testing
UK

The table below provides summary statistics and salary benchmarking for jobs requiring Test Automation skills. It covers permanent job vacancies from the 6 months leading up to 18 November 2025, with comparisons to the same periods in the previous two years.

6 months to
18 Nov 2025
Same period 2024 Same period 2023
Rank 100 89 73
Rank change year-on-year -11 -16 -34
Permanent jobs citing Test Automation 1,379 1,939 2,054
As % of all permanent jobs in the UK 2.62% 2.90% 3.90%
As % of the Processes & Methodologies category 3.05% 3.47% 4.16%
Number of salaries quoted 778 867 1,635
10th Percentile £39,960 £41,250 £41,250
25th Percentile £51,250 £48,250 £47,500
Median annual salary (50th Percentile) £65,000 £63,275 £62,968
Median % change year-on-year +2.73% +0.49% +4.95%
75th Percentile £85,000 £80,125 £80,000
90th Percentile £105,000 £105,000 £98,750
UK excluding London median annual salary £57,500 £57,965 £55,000
% change year-on-year -0.80% +5.39% -

All Process and Methodology Skills
UK

Test Automation falls under the Processes and Methodologies category. For comparison with the information above, the following table provides summary statistics for all permanent job vacancies requiring process or methodology skills.

Permanent vacancies with a requirement for process or methodology skills 45,214 55,881 49,346
As % of all permanent jobs advertised in the UK 85.89% 83.44% 93.81%
Number of salaries quoted 27,281 28,909 37,851
10th Percentile £28,250 £34,404 £32,500
25th Percentile £35,854 £45,000 £43,750
Median annual salary (50th Percentile) £55,000 £60,000 £60,000
Median % change year-on-year -8.33% - -
75th Percentile £75,000 £80,000 £80,000
90th Percentile £95,000 £97,500 £98,750
UK excluding London median annual salary £47,500 £55,000 £52,500
% change year-on-year -13.64% +4.76% -

Test Automation
Job Vacancy Trend

Historical trend showing the proportion of permanent IT job postings citing Test Automation relative to all permanent IT jobs advertised.
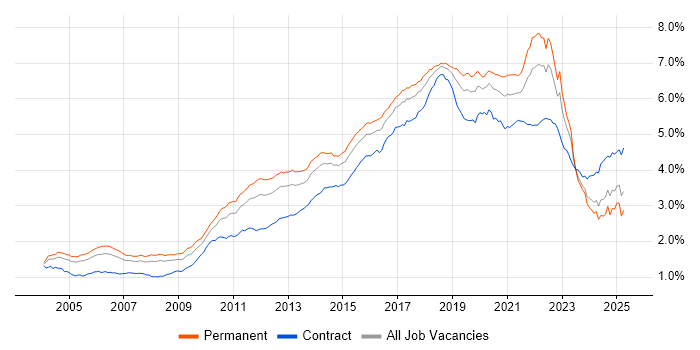
Test Automation job vacancy trend in the UK

Test Automation
Salary Trend

Salary distribution trend for jobs in the UK citing Test Automation.

Salary distribution trend for jobs in the UK citing Test Automation

Test Automation
Salary Histogram

Salary distribution for jobs citing Test Automation over the 6 months to 18 November 2025.

Salary histogram for Test Automation in the UK

Test Automation
Top 18 Job Locations

The table below looks at the demand and provides a guide to the median salaries quoted in IT jobs citing Test Automation within the UK over the 6 months to 18 November 2025. The 'Rank Change' column provides an indication of the change in demand within each location based on the same 6 month period last year.

Location Rank Change
on Same Period
Last Year
Matching
Permanent
IT Job Ads
Median Salary
Past 6 Months
Median Salary
% Change
on Same Period
Last Year
Live
Jobs
England -11 1,162 £65,000 - 1,085
UK excluding London -38 726 £57,500 -0.80% 688
London +26 551 £85,000 +7.59% 531
Work from Home 0 470 £65,000 - 660
South East -31 214 £55,000 -5.98% 205
North of England -46 144 £60,000 +20.00% 156
Scotland -2 117 £77,359 +40.65% 56
Midlands -15 96 £60,000 - 66
South West -3 89 £52,500 -16.00% 102
North West -34 87 £60,000 +26.32% 93
West Midlands 0 61 £58,750 -2.08% 45
Yorkshire -28 45 £55,000 +11.11% 41
East of England -50 45 £60,000 +9.09% 62
East Midlands -15 38 £60,000 - 21
Wales +11 23 £55,200 +16.68% 32
North East -12 12 £50,000 -15.23% 22
Northern Ireland -23 5 £67,500 +20.00% 19
Isle of Man - 1 £52,500 - 1

Test Automation
Co-Occurring Skills & Capabilities by Category

The following tables expand on the one above by listing co-occurrences grouped by category. They cover the same employment type, locality and period, with up to 20 co-occurrences shown in each category:

Application Platforms
1 34 (2.47%) Apache Spark
2 29 (2.10%) Confluence
3 27 (1.96%) Apache Airflow
4 20 (1.45%) SharePoint
5 19 (1.38%) Apache
6 15 (1.09%) Oracle SOA Suite
7 13 (0.94%) Appian
8 8 (0.58%) Headless CMS
9 7 (0.51%) Apache Solr
9 7 (0.51%) Jupyter
10 6 (0.44%) CMS
11 5 (0.36%) nginx
12 4 (0.29%) IIS
13 3 (0.22%) Oracle Workflow
13 3 (0.22%) Umbraco
14 2 (0.15%) Adobe Experience Manager
14 2 (0.15%) WordPress
15 1 (0.073%) JBoss
15 1 (0.073%) Microsoft Exchange
15 1 (0.073%) SAS
Applications
1 15 (1.09%) Microsoft Excel
2 14 (1.02%) Microsoft Office
3 10 (0.73%) Microsoft PowerPoint
4 8 (0.58%) MS Visio
5 5 (0.36%) Blender
6 4 (0.29%) Oracle Smart View
7 3 (0.22%) Photoshop
7 3 (0.22%) Simulink
8 2 (0.15%) Adobe XD
8 2 (0.15%) Chatbot
8 2 (0.15%) Microsoft Project
8 2 (0.15%) Sketch
9 1 (0.073%) Doxygen
9 1 (0.073%) Trello
Business Applications
1 34 (2.47%) SAP S/4HANA
2 31 (2.25%) Oracle ERP
3 21 (1.52%) Dynamics CRM
4 12 (0.87%) Dynamics NAV
5 9 (0.65%) Shopify
6 8 (0.58%) Elite 3E
7 4 (0.29%) Hyperion Planning
7 4 (0.29%) Oracle Assets
7 4 (0.29%) Oracle Financials
7 4 (0.29%) Oracle General Ledger
7 4 (0.29%) Oracle Payables
7 4 (0.29%) Oracle Receivables
7 4 (0.29%) Salesforce CRM
8 3 (0.22%) Payment Gateway
8 3 (0.22%) SAP CX
8 3 (0.22%) Unit4 Business World
9 2 (0.15%) Aladdin
10 1 (0.073%) Oracle BPM
10 1 (0.073%) SAP Hybris
10 1 (0.073%) Siebel CRM
Cloud Services
1 442 (32.05%) Azure
2 400 (29.01%) AWS
3 260 (18.85%) Azure DevOps
4 198 (14.36%) GitHub
5 118 (8.56%) GCP
6 111 (8.05%) SaaS
7 83 (6.02%) Serverless
8 74 (5.37%) PaaS
9 70 (5.08%) Power Platform
10 68 (4.93%) GitHub Actions
11 51 (3.70%) GitHub Copilot
12 47 (3.41%) Amazon S3
13 42 (3.05%) AWS Lambda
14 39 (2.83%) Datadog
15 37 (2.68%) Amazon EKS
16 35 (2.54%) Snowflake
17 34 (2.47%) dbt
18 32 (2.32%) Dynamics 365
19 30 (2.18%) Azure Data Factory
19 30 (2.18%) Entra ID
Communications & Networking
1 23 (1.67%) DNS
2 17 (1.23%) HTTP
3 15 (1.09%) TCP/IP
4 14 (1.02%) 5G
4 14 (1.02%) SD-WAN
4 14 (1.02%) WAN
5 10 (0.73%) Firewall
5 10 (0.73%) VPN
6 9 (0.65%) Wi-Fi
7 7 (0.51%) Network Security
7 7 (0.51%) VLAN
8 6 (0.44%) DHCP
8 6 (0.44%) Modbus
8 6 (0.44%) Multicast
9 5 (0.36%) SSL
10 4 (0.29%) 3G
10 4 (0.29%) F5 BIG-IP LTM
10 4 (0.29%) GPRS
10 4 (0.29%) GSM
10 4 (0.29%) Internet
Database & Business Intelligence
1 102 (7.40%) Relational Database
2 82 (5.95%) NoSQL
3 80 (5.80%) SQL Server
4 76 (5.51%) PostgreSQL
5 45 (3.26%) MySQL
6 43 (3.12%) Data Warehouse
7 34 (2.47%) Power BI
8 27 (1.96%) MongoDB
9 24 (1.74%) DynamoDB
10 23 (1.67%) RDBMS
11 20 (1.45%) Big Data
12 17 (1.23%) Amazon RDS
13 13 (0.94%) Snowflake Schema
13 13 (0.94%) Tableau
14 12 (0.87%) Elasticsearch
15 10 (0.73%) Amazon Athena
15 10 (0.73%) BigQuery
15 10 (0.73%) MariaDB
15 10 (0.73%) Redis
16 9 (0.65%) Apache Iceberg
Development Applications
1 196 (14.21%) Selenium
2 181 (13.13%) Git
3 163 (11.82%) JIRA
4 135 (9.79%) Jenkins
5 77 (5.58%) Cypress.io
6 67 (4.86%) Cucumber
6 67 (4.86%) Postman
7 52 (3.77%) GitLab
8 41 (2.97%) JMeter
9 36 (2.61%) TeamCity
10 35 (2.54%) JUnit
11 29 (2.10%) Oracle Forms
11 29 (2.10%) Snyk
12 28 (2.03%) eCATT
13 27 (1.96%) Robot Framework
14 23 (1.67%) Appium
15 22 (1.60%) Maven
15 22 (1.60%) REST Assured
16 20 (1.45%) NeoLoad
17 18 (1.31%) SpecFlow
General
1 485 (35.17%) Finance
2 409 (29.66%) Social Skills
3 176 (12.76%) Law
4 162 (11.75%) Analytical Skills
4 162 (11.75%) Inclusion and Diversity
5 143 (10.37%) Marketing
6 119 (8.63%) Banking
7 82 (5.95%) Public Sector
8 69 (5.00%) Manufacturing
9 43 (3.12%) Back Office
9 43 (3.12%) Retail
10 41 (2.97%) Front Office
11 38 (2.76%) Legal
12 34 (2.47%) Electronics
12 34 (2.47%) Financial Institution
13 28 (2.03%) Presentation Skills
14 26 (1.89%) Documentation Skills
15 20 (1.45%) Games
16 19 (1.38%) Automotive
17 18 (1.31%) Organisational Skills
Job Titles
1 384 (27.85%) Senior
2 333 (24.15%) Developer
3 263 (19.07%) Lead
4 146 (10.59%) Software Engineer
5 141 (10.22%) Senior Developer
6 99 (7.18%) Test Engineer
7 73 (5.29%) Analyst
8 68 (4.93%) Python Developer
9 57 (4.13%) Java Engineer
9 57 (4.13%) QA Engineer
10 55 (3.99%) Java Developer
11 54 (3.92%) Test Leader
12 52 (3.77%) Full-Stack Developer
12 52 (3.77%) Test Automation Engineer
13 45 (3.26%) Software Developer
13 45 (3.26%) Test Analyst
13 45 (3.26%) Tester
14 44 (3.19%) Lead Developer
15 43 (3.12%) DevOps Engineer
16 41 (2.97%) Senior Python Developer
Libraries, Frameworks & Software Standards
1 168 (12.18%) React
2 132 (9.57%) .NET
2 132 (9.57%) RESTful
3 110 (7.98%) REST
4 107 (7.76%) Playwright
5 98 (7.11%) CSS
5 98 (7.11%) HTML
6 91 (6.60%) Kafka
7 82 (5.95%) Spring
8 80 (5.80%) Node.js
9 63 (4.57%) JSON
10 53 (3.84%) Spring Boot
11 51 (3.70%) SOAP
12 50 (3.63%) AngularJS
13 46 (3.34%) XML
14 40 (2.90%) .NET Framework
14 40 (2.90%) GraphQL
14 40 (2.90%) pytest
14 40 (2.90%) YAML
15 39 (2.83%) OAuth
Miscellaneous
1 217 (15.74%) Cloud Native
2 81 (5.87%) Product Ownership
3 59 (4.28%) Mobile App
4 57 (4.13%) Management Information System
5 56 (4.06%) Onboarding
6 52 (3.77%) Data Structures
7 51 (3.70%) Self-Motivation
8 44 (3.19%) Algorithms
8 44 (3.19%) Enterprise Software
9 35 (2.54%) Hedge funds
10 33 (2.39%) Security Posture
11 30 (2.18%) Equities
12 29 (2.10%) Distributed Systems
13 28 (2.03%) e-Learning
14 27 (1.96%) Public Cloud
15 26 (1.89%) Foreign Exchange (FX)
16 25 (1.81%) Legacy Systems
16 25 (1.81%) Virtual Team
17 24 (1.74%) Hybrid Cloud
18 22 (1.60%) Client/Server
Operating Systems
1 113 (8.19%) Linux
2 61 (4.42%) Windows
3 33 (2.39%) Unix
4 20 (1.45%) Windows Server
5 19 (1.38%) Apple iOS
6 12 (0.87%) Android
7 5 (0.36%) Embedded Linux
7 5 (0.36%) FreeRTOS
7 5 (0.36%) Windows Server 2019
8 3 (0.22%) Debian
8 3 (0.22%) VMS
8 3 (0.22%) Windows 10
9 2 (0.15%) CentOS
9 2 (0.15%) Mac OS
9 2 (0.15%) Solaris
10 1 (0.073%) Kali Linux
10 1 (0.073%) VxWorks
Processes & Methodologies
1 738 (53.52%) Agile
2 703 (50.98%) CI/CD
3 519 (37.64%) DevOps
4 358 (25.96%) Problem-Solving
5 317 (22.99%) Mentoring
6 292 (21.17%) Software Engineering
7 238 (17.26%) Continuous Improvement
8 200 (14.50%) Coaching
9 199 (14.43%) SDLC
10 198 (14.36%) AI
11 170 (12.33%) Microservices
12 155 (11.24%) Computer Science
13 148 (10.73%) Containerisation
14 144 (10.44%) Infrastructure as Code
14 144 (10.44%) Scrum
14 144 (10.44%) Test Strategy
15 139 (10.08%) Analytics
16 134 (9.72%) Software Testing
17 132 (9.57%) Clean Code
18 130 (9.43%) Roadmaps
Programming Languages
1 405 (29.37%) Python
2 336 (24.37%) SQL
3 321 (23.28%) Java
4 215 (15.59%) JavaScript
5 189 (13.71%) C#
6 134 (9.72%) TypeScript
7 80 (5.80%) C++
8 74 (5.37%) PowerShell
9 50 (3.63%) Go
10 46 (3.34%) Shell Script
11 42 (3.05%) C
12 41 (2.97%) PHP
13 36 (2.61%) PL/SQL
14 26 (1.89%) Kotlin
15 23 (1.67%) Bicep
16 21 (1.52%) Bash
17 19 (1.38%) MATLAB
18 13 (0.94%) Scala
18 13 (0.94%) Swift
19 12 (0.87%) Apex Code
Qualifications
1 206 (14.94%) Degree
2 109 (7.90%) Computer Science Degree
3 105 (7.61%) Security Cleared
4 75 (5.44%) ISTQB
4 75 (5.44%) SC Cleared
5 51 (3.70%) Master's Degree
6 33 (2.39%) DV Cleared
7 32 (2.32%) AWS Certification
8 25 (1.81%) DBS Check
9 24 (1.74%) ISTQB Foundation Certification
10 18 (1.31%) ISEB
11 17 (1.23%) HND
12 10 (0.73%) BPSS Clearance
13 9 (0.65%) AWS Certified Solutions Architect
13 9 (0.65%) ITIL Certification
14 7 (0.51%) Azure Certification
15 6 (0.44%) HNC
16 5 (0.36%) CRISC
16 5 (0.36%) ISTQB Advanced Certification
16 5 (0.36%) Numerate Degree
Quality Assurance & Compliance
1 295 (21.39%) QA
2 72 (5.22%) Accessibility
3 70 (5.08%) ISO/IEC 27001
4 48 (3.48%) NIST
5 35 (2.54%) Data Quality
6 33 (2.39%) NCSC
7 26 (1.89%) GDPR
8 22 (1.60%) WCAG
9 19 (1.38%) ISO 9001
10 10 (0.73%) SLA
11 5 (0.36%) PCI DSS
12 4 (0.29%) Cyber Essentials
12 4 (0.29%) ISO 22301
12 4 (0.29%) MISRA
12 4 (0.29%) Sarbanes-Oxley
13 3 (0.22%) GRC
13 3 (0.22%) Section 508
13 3 (0.22%) SEPA
14 2 (0.15%) IEC 61508
14 2 (0.15%) ISO 26262
System Software
1 187 (13.56%) Docker
2 40 (2.90%) Active Directory
3 18 (1.31%) Firmware
4 16 (1.16%) VMware Infrastructure
5 15 (1.09%) Embedded Firmware
6 7 (0.51%) Virtual Machines
6 7 (0.51%) vSphere
7 5 (0.36%) HDFS
7 5 (0.36%) zsh
8 4 (0.29%) Terminal Server
Systems Management
1 197 (14.29%) Kubernetes
2 184 (13.34%) Terraform
3 57 (4.13%) Grafana
4 54 (3.92%) Ansible
5 28 (2.03%) HP ALM
6 26 (1.89%) Single Sign-On
7 22 (1.60%) Prometheus
8 10 (0.73%) Microsoft Intune
9 6 (0.44%) Mesos
10 5 (0.36%) SCCM
10 5 (0.36%) SCOM
11 4 (0.29%) Control-M
12 3 (0.22%) HP Quality Center
12 3 (0.22%) Kubeflow
12 3 (0.22%) Nessus
12 3 (0.22%) Progress Chef
13 2 (0.15%) Argo
13 2 (0.15%) Functional Safety
13 2 (0.15%) HP Fortify
14 1 (0.073%) Packer
Vendors
1 154 (11.17%) Microsoft
2 82 (5.95%) Oracle
3 61 (4.42%) Salesforce
4 57 (4.13%) Google
5 53 (3.84%) SAP
6 43 (3.12%) Databricks
7 32 (2.32%) VMware
8 28 (2.03%) HP
9 23 (1.67%) Black Duck
9 23 (1.67%) IBM
10 22 (1.60%) Guidewire
11 20 (1.45%) Red Hat
12 18 (1.31%) Coverity
13 16 (1.16%) Apple
14 15 (1.09%) Blue Prism
14 15 (1.09%) Splunk
15 14 (1.02%) Okta
15 14 (1.02%) UiPath
16 11 (0.80%) BiZZdesign
16 11 (0.80%) Pega