Software Testing
UK

The following table provides summary statistics for permanent job vacancies with a requirement for Software Testing skills. Included is a benchmarking guide to the salaries offered in vacancies that have cited Software Testing over the 6 months to 28 November 2023 with a comparison to the same period in the previous 2 years.

6 months to
28 Nov 2023
Same period 2022 Same period 2021
Rank 199 84 146
Rank change year-on-year -115 +62 -15
Permanent jobs citing Software Testing 972 4,784 3,402
As % of all permanent jobs advertised in the UK 1.79% 3.81% 2.65%
As % of the Processes & Methodologies category 1.90% 3.98% 2.78%
Number of salaries quoted 747 2,075 2,173
10th Percentile £33,750 £31,250 £31,250
25th Percentile £42,500 £40,000 £37,500
Median annual salary (50th Percentile) £55,000 £53,500 £52,500
Median % change year-on-year +2.80% +1.90% +16.67%
75th Percentile £71,250 £68,750 £66,250
90th Percentile £85,000 £80,000 £80,000
UK excluding London median annual salary £50,500 £50,000 £45,000
% change year-on-year +1.00% +11.11% +5.88%

All Process and Methodology Skills
UK

Software Testing is in the Processes and Methodologies category. The following table is for comparison with the above and provides summary statistics for all permanent job vacancies with a requirement for process or methodology skills.

Permanent vacancies with a requirement for process or methodology skills 51,121 120,104 122,523
As % of all permanent jobs advertised in the UK 94.09% 95.72% 95.43%
Number of salaries quoted 36,956 73,203 81,032
10th Percentile £32,500 £34,313 £32,500
25th Percentile £43,750 £45,000 £42,500
Median annual salary (50th Percentile) £60,000 £60,000 £59,000
Median % change year-on-year - +1.69% +7.27%
75th Percentile £80,000 £81,250 £77,500
90th Percentile £98,750 £100,000 £95,000
UK excluding London median annual salary £52,500 £53,000 £50,000
% change year-on-year -0.94% +6.00% +4.17%

Software Testing
Job Vacancy Trend

Job postings citing Software Testing as a proportion of all IT jobs advertised.
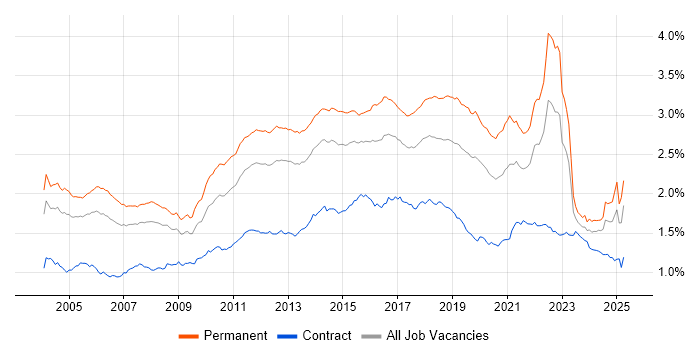
Job vacancy trend for Software Testing in the UK

Software Testing
Salary Trend

3-month moving average salary quoted in jobs citing Software Testing.

Salary trend for Software Testing in the UK

Software Testing
Salary Histogram

Salary distribution for jobs citing Software Testing over the 6 months to 28 November 2023.

Salary histogram for Software Testing in the UK

Software Testing
Top 17 Job Locations

The table below looks at the demand and provides a guide to the median salaries quoted in IT jobs citing Software Testing within the UK over the 6 months to 28 November 2023. The 'Rank Change' column provides an indication of the change in demand within each location based on the same 6 month period last year.

Location Rank Change
on Same Period
Last Year
Matching
Permanent
IT Job Ads
Median Salary
Past 6 Months
Median Salary
% Change
on Same Period
Last Year
Live
Jobs
England -96 894 £55,000 +2.80% 528
UK excluding London -119 651 £50,500 +1.00% 430
Work from Home -70 422 £60,000 +9.09% 265
London -66 277 £72,000 +18.03% 158
South East -77 163 £52,500 -0.94% 118
North of England -79 155 £55,000 - 105
South West -33 141 £53,250 +18.33% 49
Midlands -82 100 £42,500 -10.53% 54
Yorkshire -25 77 £52,500 -4.55% 37
North West -70 67 £57,500 +9.52% 50
West Midlands -69 66 £40,000 -14.89% 26
Scotland -77 46 £41,250 -17.50% 38
East Midlands -41 34 £50,000 +5.26% 28
East of England -61 33 £55,000 +4.76% 56
Wales -5 13 £55,000 +37.50% 13
North East -11 10 £56,250 +2.27% 20
Northern Ireland -13 3 £52,500 -12.50% 4

Software Testing
Co-occurring Skills and Capabilities by Category

The follow tables expand on the table above by listing co-occurrences grouped by category. The same employment type, locality and period is covered with up to 20 co-occurrences shown in each of the following categories:

Application Platforms
1 39 (4.01%) Confluence
2 27 (2.78%) IIS
3 13 (1.34%) SharePoint
4 10 (1.03%) Apache
5 9 (0.93%) CMS
5 9 (0.93%) WinCC
6 8 (0.82%) OpenEdge
7 2 (0.21%) Apache Pulsar
7 2 (0.21%) NetWeaver
7 2 (0.21%) TPMS
7 2 (0.21%) WebLogic
8 1 (0.10%) JBoss
8 1 (0.10%) Moodle
8 1 (0.10%) Oracle 9iAS
8 1 (0.10%) Oracle Application Server
8 1 (0.10%) Oracle Service Bus
8 1 (0.10%) Oracle SOA Suite
8 1 (0.10%) Umbraco
8 1 (0.10%) WebSphere
8 1 (0.10%) WebSphere Application Server
Applications
1 23 (2.37%) Microsoft Office
2 8 (0.82%) Simulink
3 7 (0.72%) MS Visio
4 5 (0.51%) AutoCAD
4 5 (0.51%) Microsoft Project
4 5 (0.51%) Revit
5 3 (0.31%) Microsoft Excel
5 3 (0.31%) Trello
6 2 (0.21%) TargetLink
7 1 (0.10%) CANalyzer
7 1 (0.10%) Spreadsheet
7 1 (0.10%) Stateflow
Business Applications
1 6 (0.62%) Dynamics CRM
2 5 (0.51%) ProductWriter
3 4 (0.41%) Dynamics NAV
4 3 (0.31%) Dynamics AX
4 3 (0.31%) Shopify
5 2 (0.21%) Oracle EBS
6 1 (0.10%) Oracle 11i
6 1 (0.10%) Oracle Applications
6 1 (0.10%) Oracle EBS R12
6 1 (0.10%) SAP IS-U
6 1 (0.10%) Siebel CRM
Cloud Services
1 197 (20.27%) Azure
2 165 (16.98%) AWS
3 63 (6.48%) GitHub
4 56 (5.76%) Azure DevOps
5 47 (4.84%) SaaS
6 36 (3.70%) Cloud Computing
7 21 (2.16%) GCP
8 20 (2.06%) Dynamics 365
9 19 (1.95%) OpenShift
10 17 (1.75%) GitHub Actions
11 16 (1.65%) Power Platform
12 14 (1.44%) BrowserStack
13 12 (1.23%) Serverless
14 11 (1.13%) Entra ID
15 10 (1.03%) BlazeMeter
15 10 (1.03%) Microsoft 365
15 10 (1.03%) Power Automate
16 9 (0.93%) Datadog
17 7 (0.72%) IaaS
18 6 (0.62%) Snowflake
Communications & Networking
1 49 (5.04%) TCP/IP
2 47 (4.84%) HTTP
3 29 (2.98%) WAN
4 18 (1.85%) Internet
5 17 (1.75%) Network Security
6 15 (1.54%) VPN
7 13 (1.34%) IPv4
7 13 (1.34%) LAN
8 12 (1.23%) Firewall
8 12 (1.23%) VLAN
9 11 (1.13%) OSPF
9 11 (1.13%) Software-Defined Radio
10 9 (0.93%) Ethernet
10 9 (0.93%) SSL
10 9 (0.93%) Wireless
11 7 (0.72%) SNMP
12 5 (0.51%) FlexRay
12 5 (0.51%) RS-232
12 5 (0.51%) SAN
12 5 (0.51%) SSH
Database & Business Intelligence
1 78 (8.02%) SQL Server
2 37 (3.81%) NoSQL
3 28 (2.88%) Relational Database
4 19 (1.95%) PostgreSQL
4 19 (1.95%) SQL Server Integration Services
5 18 (1.85%) MySQL
6 14 (1.44%) SQL Server Reporting Services
7 13 (1.34%) Oracle Database
8 12 (1.23%) Data Warehouse
8 12 (1.23%) MongoDB
9 11 (1.13%) OLTP
9 11 (1.13%) Oracle Database 10g
10 10 (1.03%) Oracle Database 11g
11 9 (0.93%) RDBMS
12 8 (0.82%) SQL Server Analysis Services
13 7 (0.72%) Power BI
14 3 (0.31%) Amazon RDS
14 3 (0.31%) Firebird
14 3 (0.31%) Geospatial Data
15 2 (0.21%) Data Lake
Development Applications
1 136 (13.99%) Selenium
2 114 (11.73%) JIRA
3 107 (11.01%) Jenkins
4 92 (9.47%) Git
5 73 (7.51%) Cucumber
6 55 (5.66%) JMeter
7 47 (4.84%) Postman
8 41 (4.22%) SoapUI
9 33 (3.40%) Cypress.io
10 31 (3.19%) SpecFlow
11 30 (3.09%) Bitbucket
11 30 (3.09%) Visual Studio
12 24 (2.47%) Appium
12 24 (2.47%) JUnit
13 23 (2.37%) WebDriver
14 21 (2.16%) REST Assured
15 20 (2.06%) GitLab
15 20 (2.06%) Protractor
16 17 (1.75%) NUnit
16 17 (1.75%) TestRail
General
1 226 (23.25%) Social Skills
2 136 (13.99%) Finance
3 83 (8.54%) Analytical Skills
4 82 (8.44%) Inclusion and Diversity
5 60 (6.17%) Electronics
6 43 (4.42%) Public Sector
7 41 (4.22%) Marketing
8 38 (3.91%) Retail
9 36 (3.70%) Military
10 35 (3.60%) Manufacturing
11 34 (3.50%) Telecoms
12 33 (3.40%) Banking
13 32 (3.29%) Automotive
14 29 (2.98%) Aerospace
15 28 (2.88%) Law
16 19 (1.95%) Legal
16 19 (1.95%) Organisational Skills
17 14 (1.44%) Games
18 7 (0.72%) Aviation
18 7 (0.72%) Financial Institution
Job Titles
1 187 (19.24%) Senior
2 176 (18.11%) Software Engineer
3 159 (16.36%) Developer
4 106 (10.91%) Tester
5 89 (9.16%) Lead
6 68 (7.00%) Test Engineer
7 65 (6.69%) Analyst
8 56 (5.76%) Software Tester
9 53 (5.45%) Embedded Engineer
9 53 (5.45%) Senior Developer
10 52 (5.35%) Senior Software Engineer
11 49 (5.04%) Embedded Software Engineer
12 47 (4.84%) DevOps Engineer
13 46 (4.73%) Software Developer
14 42 (4.32%) Systems Engineer
15 41 (4.22%) QA Engineer
16 40 (4.12%) Automation Tester
17 26 (2.67%) Software Test Engineer
17 26 (2.67%) Test Leader
18 24 (2.47%) Junior
Libraries, Frameworks & Software Standards
1 128 (13.17%) .NET
2 64 (6.58%) HTML
3 62 (6.38%) CSS
4 59 (6.07%) Web Services
5 52 (5.35%) React
5 52 (5.35%) REST
6 45 (4.63%) .NET Framework
7 42 (4.32%) SOAP
8 38 (3.91%) RESTful
9 37 (3.81%) Gherkin
10 33 (3.40%) Protocol Buffers
11 32 (3.29%) Node.js
12 27 (2.78%) XML
13 25 (2.57%) Spring
14 24 (2.47%) ASP.NET
15 23 (2.37%) .NET Core
15 23 (2.37%) JSON
16 22 (2.26%) AngularJS
17 20 (2.06%) Kafka
18 18 (1.85%) Middleware
Miscellaneous
1 75 (7.72%) Product Ownership
2 39 (4.01%) Management Information System
2 39 (4.01%) Public Cloud
3 29 (2.98%) Self-Motivation
4 24 (2.47%) Mobile App
5 22 (2.26%) Clustering
6 21 (2.16%) Algorithms
7 20 (2.06%) Augmented Reality
7 20 (2.06%) Distributed Systems
7 20 (2.06%) Virtual Reality
8 16 (1.65%) Embedded Systems
9 12 (1.23%) Driving Licence
9 12 (1.23%) Enterprise Software
10 11 (1.13%) Client/Server
10 11 (1.13%) Legacy Systems
11 10 (1.03%) SCADA
11 10 (1.03%) Virtual Team
12 9 (0.93%) Hedge funds
12 9 (0.93%) Linux Command Line
13 8 (0.82%) Greenfield Project
Operating Systems
1 154 (15.84%) Linux
2 78 (8.02%) Windows
3 41 (4.22%) Unix
4 16 (1.65%) Android
5 13 (1.34%) Apple iOS
6 10 (1.03%) Windows Server
7 8 (0.82%) Ubuntu
7 8 (0.82%) Windows 10
8 7 (0.72%) Red Hat Enterprise Linux
9 5 (0.51%) Debian
9 5 (0.51%) Solaris
9 5 (0.51%) Windows 7
9 5 (0.51%) Windows Server 2019
10 4 (0.41%) CentOS
10 4 (0.41%) Windows Server 2016
11 3 (0.31%) Mac OS
Processes & Methodologies
1 448 (46.09%) Agile
2 366 (37.65%) Test Automation
3 271 (27.88%) Software Engineering
4 232 (23.87%) DevOps
4 232 (23.87%) Problem-Solving
5 185 (19.03%) CI/CD
6 138 (14.20%) Scrum
7 131 (13.48%) SDLC
8 124 (12.76%) Continuous Integration
9 113 (11.63%) TDD
10 112 (11.52%) Test Scripting
11 110 (11.32%) Test Strategy
12 106 (10.91%) Unit Testing
13 105 (10.80%) Mentoring
14 93 (9.57%) Computer Science
15 90 (9.26%) Functional Testing
16 87 (8.95%) BDD
17 74 (7.61%) SDET
18 71 (7.30%) Manual Testing
19 68 (7.00%) Project Delivery
Programming Languages
1 226 (23.25%) Python
2 207 (21.30%) C#
3 196 (20.16%) Java
4 187 (19.24%) SQL
5 180 (18.52%) JavaScript
6 122 (12.55%) C
7 95 (9.77%) C++
8 58 (5.97%) Bash
9 57 (5.86%) TypeScript
10 30 (3.09%) PowerShell
11 25 (2.57%) Groovy
11 25 (2.57%) PHP
12 22 (2.26%) Ruby
13 21 (2.16%) VB
14 18 (1.85%) Ada
15 17 (1.75%) PL/SQL
16 16 (1.65%) Perl
16 16 (1.65%) R
17 15 (1.54%) Go
17 15 (1.54%) Rust
Qualifications
1 225 (23.15%) Degree
2 199 (20.47%) Security Cleared
3 122 (12.55%) SC Cleared
4 100 (10.29%) ISTQB
5 55 (5.66%) Computer Science Degree
6 50 (5.14%) ISEB
7 35 (3.60%) Master's Degree
8 24 (2.47%) ISTQB Foundation Certification
9 19 (1.95%) DV Cleared
10 14 (1.44%) BPSS Clearance
11 11 (1.13%) GIAC
11 11 (1.13%) PhD
11 11 (1.13%) RHCE
12 9 (0.93%) Microsoft Certification
13 8 (0.82%) DBS Check
13 8 (0.82%) HND
14 7 (0.72%) Postgraduate
15 6 (0.62%) CCNA
15 6 (0.62%) Cisco Certification
15 6 (0.62%) HNC
Quality Assurance & Compliance
1 196 (20.16%) QA
2 28 (2.88%) Accessibility
3 12 (1.23%) MISRA
4 11 (1.13%) GDPR
5 9 (0.93%) SLA
6 8 (0.82%) ISO/IEC 27001
7 7 (0.72%) ISO 26262
7 7 (0.72%) Software Quality Assurance
8 6 (0.62%) ITGC
9 4 (0.41%) AUTOSAR
9 4 (0.41%) DO-178B
9 4 (0.41%) IEC 61508
9 4 (0.41%) ISO 9001
9 4 (0.41%) PMO
10 3 (0.31%) WCAG
11 2 (0.21%) Data Quality
12 1 (0.10%) IEC 61131
12 1 (0.10%) IEC 62304
12 1 (0.10%) ISO 13485
12 1 (0.10%) JTAG
System Software
1 113 (11.63%) Docker
2 20 (2.06%) Firmware
3 19 (1.95%) Active Directory
3 19 (1.95%) VMware NSX
4 13 (1.34%) VMware Infrastructure
5 9 (0.93%) Hyper-V
6 3 (0.31%) vSphere
7 1 (0.10%) Embedded Firmware
7 1 (0.10%) Virtual Machines
7 1 (0.10%) Virtual Servers
Systems Management
1 99 (10.19%) Kubernetes
2 58 (5.97%) Terraform
3 48 (4.94%) Ansible
4 21 (2.16%) Puppet
5 15 (1.54%) HP Quality Center
6 11 (1.13%) Functional Safety
7 7 (0.72%) Grafana
8 6 (0.62%) HP ALM
9 5 (0.51%) Kibana
9 5 (0.51%) Progress Chef
9 5 (0.51%) Salt
9 5 (0.51%) SCCM
10 3 (0.31%) Consul
10 3 (0.31%) Docker Swarm
11 2 (0.21%) Cobbler
11 2 (0.21%) MIIS
11 2 (0.21%) Single Sign-On
11 2 (0.21%) Wonderware InTouch
12 1 (0.10%) Check_MK
12 1 (0.10%) SELinux
Vendors
1 134 (13.79%) Microsoft
2 58 (5.97%) Oracle
3 35 (3.60%) VMware
4 32 (3.29%) SAP
5 24 (2.47%) HP
6 16 (1.65%) Atlassian
7 15 (1.54%) Red Hat
8 9 (0.93%) Siemens
9 8 (0.82%) Progress
9 8 (0.82%) Salesforce
10 7 (0.72%) Dynatrace
10 7 (0.72%) ServiceNow
11 6 (0.62%) Google
12 5 (0.51%) Adobe
12 5 (0.51%) Autodesk
12 5 (0.51%) Siebel
12 5 (0.51%) Splunk
13 4 (0.41%) Charles River
13 4 (0.41%) OpenText
13 4 (0.41%) Parasoft