Systems Engineering Jobs

Systems Engineering
UK

The table below provides summary statistics for permanent job vacancies requiring Systems Engineering skills. It includes a benchmarking guide to the annual salaries offered in vacancies that cited Systems Engineering over the 6 months leading up to 2 April 2025, comparing them to the same period in the previous two years.

6 months to
2 Apr 2025
Same period 2024 Same period 2023
Rank 17 302 308
Rank change year-on-year +285 +6 +207
Permanent jobs citing Systems Engineering 4,466 860 1,248
As % of all permanent jobs advertised in the UK 8.84% 0.93% 1.13%
As % of the Processes & Methodologies category 9.45% 1.07% 1.18%
Number of salaries quoted 1,985 494 246
10th Percentile £45,628 £35,375 £42,500
25th Percentile £47,683 £47,625 £52,500
Median annual salary (50th Percentile) £52,600 £59,000 £64,000
Median % change year-on-year -10.85% -7.81% -1.54%
75th Percentile £60,265 £70,188 £88,563
90th Percentile £66,050 £87,500 £110,000
UK excluding London median annual salary £52,600 £55,000 £60,000
% change year-on-year -4.36% -8.33% -

All Process and Methodology Skills
UK

Systems Engineering falls under the Processes and Methodologies category. For comparison with the information above, the following table provides summary statistics for all permanent job vacancies requiring process or methodology skills.

Permanent vacancies with a requirement for process or methodology skills 47,280 80,404 105,819
As % of all permanent jobs advertised in the UK 93.55% 86.78% 95.67%
Number of salaries quoted 25,837 58,088 61,888
10th Percentile £31,250 £29,250 £34,095
25th Percentile £44,000 £40,000 £45,000
Median annual salary (50th Percentile) £58,033 £55,000 £61,500
Median % change year-on-year +5.51% -10.57% +2.50%
75th Percentile £77,500 £73,250 £82,500
90th Percentile £98,750 £92,500 £100,000
UK excluding London median annual salary £52,600 £50,000 £54,590
% change year-on-year +5.20% -8.41% +3.98%

Systems Engineering
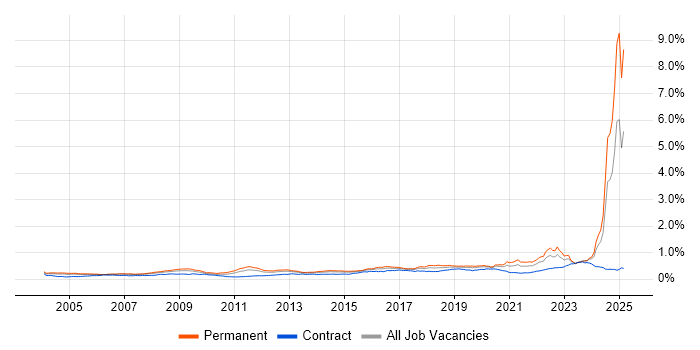
Job Vacancy Trend

Job postings citing Systems Engineering as a proportion of all IT jobs advertised.

Job vacancy trend for Systems Engineering in the UK

Systems Engineering
Salary Trend

3-month moving average salary quoted in jobs citing Systems Engineering.

Salary trend for Systems Engineering in the UK

Systems Engineering
Salary Histogram

Salary distribution for jobs citing Systems Engineering over the 6 months to 2 April 2025.

Salary histogram for Systems Engineering in the UK

Systems Engineering
Top 15 Job Locations

The table below looks at the demand and provides a guide to the median salaries quoted in IT jobs citing Systems Engineering within the UK over the 6 months to 2 April 2025. The 'Rank Change' column provides an indication of the change in demand within each location based on the same 6 month period last year.

Location Rank Change
on Same Period
Last Year
Matching
Permanent
IT Job Ads
Median Salary
Past 6 Months
Median Salary
% Change
on Same Period
Last Year
Live
Jobs
UK excluding London +254 4,331 £52,600 -4.36% 884
England +259 3,780 £50,055 -12.95% 1,008
Midlands +195 1,143 £47,683 -13.30% 131
North of England +317 1,126 £50,055 -1.85% 142
North West +262 978 £50,055 -16.58% 87
South East +185 740 £62,000 -0.80% 237
West Midlands +162 675 £35,000 -36.36% 81
South West +111 557 £52,600 -4.36% 144
Work from Home +176 546 £47,683 -13.30% 542
Scotland +256 493 £58,033 -3.28% 90
East Midlands +138 468 £47,683 -4.63% 48
East of England +61 153 £47,683 -13.30% 118
Yorkshire +146 148 £47,683 -6.50% 37
Wales +103 122 £62,000 +55.00% 23
London +21 60 £65,000 -13.33% 236

Systems Engineering
Co-occurring Skills and Capabilities by Category

The follow tables expand on the table above by listing co-occurrences grouped by category. The same employment type, locality and period is covered with up to 20 co-occurrences shown in each of the following categories:

Application Platforms
1 35 (0.78%) Confluence
2 4 (0.090%) SharePoint
2 4 (0.090%) WinCC
3 2 (0.045%) Apache Spark
4 1 (0.022%) Microsoft Exchange
Applications
1 708 (15.85%) Simulink
2 220 (4.93%) Microsoft Office
3 174 (3.90%) Microsoft Excel
4 153 (3.43%) Microsoft PowerPoint
5 101 (2.26%) Mathcad
6 41 (0.92%) Mathematica
7 31 (0.69%) Microsoft Project
8 14 (0.31%) Trello
9 1 (0.022%) AutoCAD
9 1 (0.022%) Siemens NX
Business Applications
1 332 (7.43%) Teamcenter
2 2 (0.045%) SAP GRC
2 2 (0.045%) SAP S/4HANA
Cloud Services
1 61 (1.37%) AWS
2 19 (0.43%) Google Workspace
3 10 (0.22%) Pulumi
4 9 (0.20%) Microsoft 365
5 7 (0.16%) Amazon EC2
5 7 (0.16%) Amazon EKS
5 7 (0.16%) Amazon S3
5 7 (0.16%) Azure
6 6 (0.13%) Amazon ECR
6 6 (0.13%) Slack
6 6 (0.13%) Virtual Private Cloud
7 5 (0.11%) Azure DevOps
7 5 (0.11%) Azure Monitor
7 5 (0.11%) GitHub
7 5 (0.11%) GitHub Actions
8 4 (0.090%) Microsoft Copilot
9 3 (0.067%) Cloud Computing
10 2 (0.045%) SaaS
11 1 (0.022%) Nutanix
11 1 (0.022%) Serverless
Communications & Networking
1 24 (0.54%) Firewall
1 24 (0.54%) WLAN
2 23 (0.52%) Wireshark
3 21 (0.47%) DHCP
3 21 (0.47%) DNS
3 21 (0.47%) TCP/IP
4 20 (0.45%) VLAN
5 19 (0.43%) BGP
5 19 (0.43%) OSPF
6 16 (0.36%) VoIP
7 8 (0.18%) Network Security
7 8 (0.18%) WAN
8 6 (0.13%) LAN
9 5 (0.11%) Internet
9 5 (0.11%) MPLS
9 5 (0.11%) Wi-Fi
9 5 (0.11%) Wireless
10 2 (0.045%) Modbus
10 2 (0.045%) MQTT
10 2 (0.045%) Profibus
Database & Business Intelligence
1 34 (0.76%) MySQL
2 28 (0.63%) Relational Database
3 12 (0.27%) MongoDB
4 2 (0.045%) Big Data
4 2 (0.045%) Hadoop
4 2 (0.045%) MS Access
4 2 (0.045%) NoSQL
4 2 (0.045%) SAP BW
Development Applications
1 684 (15.32%) Rational DOORS
2 107 (2.40%) JIRA
3 37 (0.83%) Git
4 28 (0.63%) Bitbucket
5 12 (0.27%) GitLab
6 2 (0.045%) LabVIEW
6 2 (0.045%) Rational Rhapsody
General
1 730 (16.35%) Aerospace
2 554 (12.40%) Social Skills
3 539 (12.07%) Automotive
4 533 (11.93%) Electronics
5 372 (8.33%) Presentation Skills
6 176 (3.94%) Telecoms
7 167 (3.74%) Law
8 117 (2.62%) Avionics
9 114 (2.55%) Aeronautics
10 74 (1.66%) Influencing Skills
11 59 (1.32%) Military
12 34 (0.76%) Finance
13 26 (0.58%) Analytical Skills
14 24 (0.54%) Retail
15 14 (0.31%) Manufacturing
16 11 (0.25%) Inclusion and Diversity
17 9 (0.20%) Legal
17 9 (0.20%) Marketing
18 8 (0.18%) Documentation Skills
19 6 (0.13%) Public Sector
Job Titles
1 1,732 (38.78%) Systems Engineer
2 1,523 (34.10%) Principal Engineer
3 1,348 (30.18%) Principal Systems Engineer
4 1,058 (23.69%) Senior
5 515 (11.53%) Senior Systems Engineer
6 449 (10.05%) Engineering Manager
7 358 (8.02%) Integration Engineer
8 351 (7.86%) Systems Integration Engineer
9 284 (6.36%) Validation Engineer
10 277 (6.20%) System Verification Engineer
11 229 (5.13%) Lead
12 155 (3.47%) Junior
13 145 (3.25%) Junior Systems Engineer
14 141 (3.16%) Lead Systems Engineer
15 137 (3.07%) Requirements Engineer
16 130 (2.91%) Software Assurance Engineer
17 114 (2.55%) Team Leader
18 85 (1.90%) Requirements Manager
19 83 (1.86%) Architect
20 81 (1.81%) Principal Modelling Engineer
Libraries, Frameworks & Software Standards
1 28 (0.63%) .NET
2 6 (0.13%) Django
2 6 (0.13%) Flask
2 6 (0.13%) Kafka
2 6 (0.13%) Lambda Expressions
2 6 (0.13%) React
3 4 (0.090%) Middleware
4 2 (0.045%) gRPC
4 2 (0.045%) SAP Fiori
5 1 (0.022%) boto
5 1 (0.022%) REST
Miscellaneous
1 180 (4.03%) Management Information System
2 178 (3.99%) Algorithms
3 20 (0.45%) Acoustics
4 19 (0.43%) Smartphone
5 14 (0.31%) Social Media
6 12 (0.27%) Public Cloud
7 8 (0.18%) SCADA
8 7 (0.16%) Operational Technology
8 7 (0.16%) Product Ownership
9 6 (0.13%) Molecular Biology
10 5 (0.11%) Cloud Native
11 4 (0.090%) Data Centre
11 4 (0.090%) Embedded Systems
11 4 (0.090%) Microsoft Licensing
11 4 (0.090%) PKI
12 3 (0.067%) FMCG
12 3 (0.067%) Renewable Energy
13 2 (0.045%) Hybrid Cloud
13 2 (0.045%) IoT
13 2 (0.045%) Onboarding
Operating Systems
1 92 (2.06%) Linux
2 85 (1.90%) Windows
3 24 (0.54%) Windows Server
4 19 (0.43%) Mac OS X
4 19 (0.43%) Ubuntu
4 19 (0.43%) Windows 10
4 19 (0.43%) Windows Server 2016
4 19 (0.43%) Windows Server 2019
5 4 (0.090%) Red Hat Enterprise Linux
6 1 (0.022%) VxWorks
6 1 (0.022%) Windows Server 2012
Processes & Methodologies
1 1,600 (35.83%) Model-Based Systems Engineering
2 1,258 (28.17%) Validation
3 1,151 (25.77%) SysML
4 1,102 (24.68%) Mathematics
5 1,026 (22.97%) Verification and Validation
6 678 (15.18%) Agile
7 669 (14.98%) Software Engineering
8 666 (14.91%) Physics
9 555 (12.43%) Requirements Management
10 538 (12.05%) UML
11 402 (9.00%) Coaching
12 400 (8.96%) Cybersecurity
13 393 (8.80%) Collaborative Working
14 368 (8.24%) FMEA
15 367 (8.22%) MODAF
16 333 (7.46%) PLM
17 325 (7.28%) Digital Twin
18 263 (5.89%) Problem-Solving
19 247 (5.53%) Project Management
20 246 (5.51%) Stakeholder Management
Programming Languages
1 1,234 (27.63%) MATLAB
2 96 (2.15%) Python
3 70 (1.57%) R
4 41 (0.92%) C#
5 38 (0.85%) C
6 29 (0.65%) Java
7 28 (0.63%) SQL
8 23 (0.52%) C++
8 23 (0.52%) PowerShell
9 17 (0.38%) Ruby
10 16 (0.36%) Go
11 10 (0.22%) Bicep
12 6 (0.13%) JavaScript
12 6 (0.13%) TypeScript
13 5 (0.11%) Kusto Query Language
13 5 (0.11%) Rust
13 5 (0.11%) VB
14 4 (0.090%) Embedded C
15 3 (0.067%) Ada
16 2 (0.045%) Embedded C++
Qualifications
1 3,306 (74.03%) Degree
2 3,164 (70.85%) BPSS Clearance
3 652 (14.60%) HND
4 632 (14.15%) HNC
5 621 (13.91%) Chartered Engineer
6 282 (6.31%) Master's Degree
7 150 (3.36%) ISTQB
8 46 (1.03%) Security Cleared
9 40 (0.90%) SC Cleared
10 24 (0.54%) Numerate Degree
11 23 (0.52%) Microsoft Certification
12 22 (0.49%) Computer Science Degree
13 19 (0.43%) MCSE
14 14 (0.31%) DBS Check
14 14 (0.31%) PMI Certification
14 14 (0.31%) PMP
15 5 (0.11%) AWS Certification
15 5 (0.11%) AWS Certified Solutions Architect
15 5 (0.11%) CCIE
15 5 (0.11%) CITP
Quality Assurance & Compliance
1 418 (9.36%) ISO/IEC 15288
2 404 (9.05%) IEC 61508
3 372 (8.33%) Def Stans
4 18 (0.40%) QA
5 16 (0.36%) ARP4754
5 16 (0.36%) DO-254
6 5 (0.11%) ISO 26262
7 4 (0.090%) ISO/IEC 27001
7 4 (0.090%) PCI DSS
7 4 (0.090%) Sarbanes-Oxley
8 3 (0.067%) Automotive SPICE
8 3 (0.067%) GRC
8 3 (0.067%) NIST
9 2 (0.045%) IEC 61131
9 2 (0.045%) ITGC
9 2 (0.045%) NIST 800
10 1 (0.022%) ARP4761
10 1 (0.022%) ECSS
10 1 (0.022%) HAZOP
10 1 (0.022%) RMADS
System Software
1 24 (0.54%) Active Directory
2 23 (0.52%) Virtual Machines
3 17 (0.38%) Docker
4 4 (0.090%) VMware ESXi
4 4 (0.090%) vSphere
Systems Management
1 48 (1.07%) Ansible
2 32 (0.72%) Functional Safety
3 22 (0.49%) Kubernetes
3 22 (0.49%) Terraform
4 15 (0.34%) Progress Chef
5 10 (0.22%) Podman
5 10 (0.22%) Puppet
6 6 (0.13%) Kustomize
7 5 (0.11%) Grafana
7 5 (0.11%) Prometheus
8 1 (0.022%) Active Directory Federation Services
8 1 (0.022%) HP ALM
8 1 (0.022%) Single Sign-On
Vendors
1 434 (9.72%) IBM
2 251 (5.62%) Microsoft
3 187 (4.19%) ANSYS
4 111 (2.49%) MathWorks
5 39 (0.87%) Siemens
6 29 (0.65%) Atlassian
7 25 (0.56%) Cisco
8 21 (0.47%) Dell
9 20 (0.45%) Fortinet
9 20 (0.45%) Google
10 19 (0.43%) Apple
10 19 (0.43%) Ubiquiti
11 18 (0.40%) VMware
12 6 (0.13%) Meraki
12 6 (0.13%) Sawtooth Software
13 5 (0.11%) Oracle
14 4 (0.090%) Extreme Networks
14 4 (0.090%) Red Hat
14 4 (0.090%) Rockwell
15 2 (0.045%) Wonderware