Firewall Contracts with Hybrid/Remote/WFH Options

Firewall
UK > Work from Home

The table below provides summary statistics for remote or hybrid contract work requiring Firewall skills. It includes a benchmarking guide to the contractor rates offered in vacancies that cited Firewall over the 6 months leading up to 4 May 2025, comparing them to the same period in the previous two years.

6 months to
4 May 2025
Same period 2024 Same period 2023
Rank 55 62 59
Rank change year-on-year +7 -3 +42
Contract jobs citing Firewall 390 482 999
As % of all contract jobs with a WFH option 3.94% 3.16% 3.90%
As % of the Communications & Networking category 37.43% 30.56% 33.84%
Number of daily rates quoted 257 320 713
10th Percentile £325 £349 £375
25th Percentile £400 £425 £450
Median daily rate (50th Percentile) £500 £515 £540
Median % change year-on-year -2.93% -4.61% +2.86%
75th Percentile £603 £608 £650
90th Percentile £750 £700 £713
UK median daily rate £508 £515 £525
% change year-on-year -1.46% -1.90% +5.00%
Number of hourly rates quoted 10 16 10
10th Percentile - £20.88 £31.33
25th Percentile - £40.86 £51.65
Median hourly rate £14.20 £87.46 £78.00
Median % change year-on-year -83.76% +12.13% +52.82%
75th Percentile £36.00 £87.53 £80.25
90th Percentile £44.73 - £81.00
UK median hourly rate £27.50 £61.50 £62.00
% change year-on-year -55.28% -0.81% +39.33%

All Communications and Computer Networking Skills
Work from Home

Firewall falls under the Communications and Computer Networking category. For comparison with the information above, the following table provides summary statistics for all contract job vacancies with remote or hybrid options requiring communications or computer networking skills.

Contract vacancies with a requirement for communications or computer networking skills 1,042 1,577 2,952
As % of all contract jobs with a WFH option 10.53% 10.35% 11.53%
Number of daily rates quoted 667 1,014 1,965
10th Percentile £325 £300 £350
25th Percentile £400 £410 £425
Median daily rate (50th Percentile) £500 £505 £525
Median % change year-on-year -0.99% -3.81% +5.00%
75th Percentile £600 £613 £650
90th Percentile £700 £702 £725
UK median daily rate £488 £490 £520
% change year-on-year -0.51% -5.77% +4.00%
Number of hourly rates quoted 31 77 98
10th Percentile £13.78 £12.75 £23.90
25th Percentile £14.20 £14.27 £42.50
Median hourly rate £41.00 £24.50 £60.00
Median % change year-on-year +67.35% -59.17% +21.73%
75th Percentile £64.38 £65.00 £71.19
90th Percentile £73.75 £87.46 £80.25
UK median hourly rate £31.08 £40.00 £18.93
% change year-on-year -22.30% +111.30% -31.16%

Firewall
Trend for Jobs with a WFH Option

Job vacancies with remote working options citing Firewall as a proportion of all IT jobs advertised.
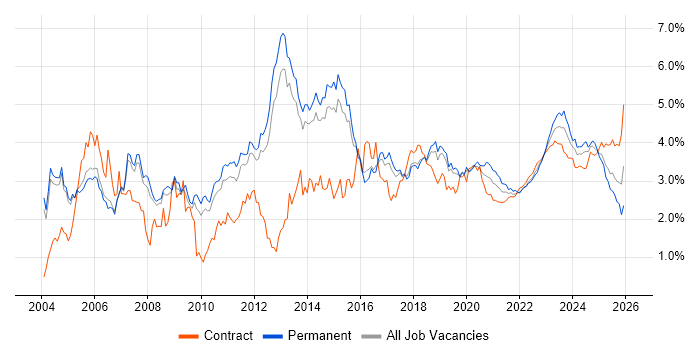
Firewall trend for jobs with Hybrid/Remote/WFH options

Firewall
Daily Rate Trend for Jobs with a WFH Option

3-month moving average daily rate quoted in job vacancies with remote working options citing Firewall.

Firewall daily rate for jobs with a WFH option

Firewall
Daily Rate Histogram for Jobs with a WFH Option

Daily rate distribution for jobs with remote working options citing Firewall over the 6 months to 4 May 2025.

Firewall daily rate histogram for jobs with a WFH option

Firewall
Hourly Rate Trend for Jobs with a WFH Option

3-month moving average hourly rate quoted in job vacancies with remote working options citing Firewall.

Firewall hourly rate for jobs with a WFH option

Firewall
Hourly Rate Histogram for Jobs with a WFH Option

Hourly rate distribution for jobs with remote working options citing Firewall over the 6 months to 4 May 2025.

Firewall hourly rate histogram for jobs with a WFH option

Firewall
Co-occurring Skills and Capabilities with WFH Options by Category

The follow tables expand on the table above by listing co-occurrences grouped by category. The same employment type, locality and period is covered with up to 20 co-occurrences shown in each of the following categories:

Application Platforms
1 21 (5.38%) Microsoft Exchange
2 11 (2.82%) SharePoint
3 4 (1.03%) Apache Spark
3 4 (1.03%) nginx
4 3 (0.77%) CMS
4 3 (0.77%) Confluence
5 2 (0.51%) IIS
6 1 (0.26%) Apache
6 1 (0.26%) Skype for Business
Applications
1 20 (5.13%) Microsoft Office
2 6 (1.54%) Microsoft Excel
3 3 (0.77%) Microsoft PowerPoint
4 2 (0.51%) MS Visio
5 1 (0.26%) Microsoft Project
Business Applications
1 1 (0.26%) Distributed Ledger
Cloud Services
1 135 (34.62%) Azure
2 85 (21.79%) AWS
3 36 (9.23%) AWS CloudFormation
4 30 (7.69%) GCP
5 29 (7.44%) IaaS
5 29 (7.44%) Microsoft 365
6 28 (7.18%) Entra ID
7 23 (5.90%) SaaS
8 22 (5.64%) PaaS
9 16 (4.10%) Serverless
10 14 (3.59%) Azure DevOps
11 12 (3.08%) Amazon EC2
11 12 (3.08%) Amazon S3
11 12 (3.08%) Azure ExpressRoute
11 12 (3.08%) Azure Sentinel
12 10 (2.56%) Route 53
13 9 (2.31%) AWS Lambda
13 9 (2.31%) GitHub
13 9 (2.31%) Virtual Private Cloud
14 8 (2.05%) Azure Monitor
Communications & Networking
1 108 (27.69%) VPN
2 97 (24.87%) Network Security
3 80 (20.51%) DNS
4 68 (17.44%) WAN
5 61 (15.64%) BGP
6 55 (14.10%) LAN
7 53 (13.59%) OSPF
8 52 (13.33%) TCP/IP
9 47 (12.05%) Wireless
10 39 (10.00%) Cisco ASA
11 38 (9.74%) DHCP
12 30 (7.69%) SD-WAN
12 30 (7.69%) Wi-Fi
13 29 (7.44%) Cisco Nexus
14 28 (7.18%) HTTP
15 26 (6.67%) Internet
15 26 (6.67%) MPLS
16 25 (6.41%) Intrusion Detection
17 19 (4.87%) HTTPS
17 19 (4.87%) IPsec
Database & Business Intelligence
1 15 (3.85%) SQL Server
2 8 (2.05%) Hadoop
3 7 (1.79%) Amazon RDS
3 7 (1.79%) PostgreSQL
4 4 (1.03%) Apache Hive
4 4 (1.03%) Apache Iceberg
4 4 (1.03%) Data Lake
4 4 (1.03%) Data Warehouse
4 4 (1.03%) Elasticsearch
4 4 (1.03%) NoSQL
4 4 (1.03%) Oracle Database
4 4 (1.03%) Parquet
4 4 (1.03%) Presto
5 3 (0.77%) Power BI
6 2 (0.51%) InfluxDB
6 2 (0.51%) Redis
7 1 (0.26%) Azure SQL Database
7 1 (0.26%) MySQL
7 1 (0.26%) Oracle ODI
7 1 (0.26%) Relational Database
Development Applications
1 15 (3.85%) Git
2 13 (3.33%) Jenkins
3 7 (1.79%) Sonatype Nexus
4 6 (1.54%) GitLab
5 4 (1.03%) Artifactory
5 4 (1.03%) Poetry
6 3 (0.77%) Eclipse
6 3 (0.77%) JIRA
7 2 (0.51%) Bitbucket
8 1 (0.26%) Atlassian Bamboo
8 1 (0.26%) Oracle Forms
8 1 (0.26%) SonarQube
8 1 (0.26%) Spinnaker
General
1 74 (18.97%) Social Skills
2 69 (17.69%) Finance
3 26 (6.67%) Analytical Skills
3 26 (6.67%) Public Sector
4 20 (5.13%) Telecoms
5 18 (4.62%) Banking
6 8 (2.05%) Legal
7 7 (1.79%) Inclusion and Diversity
8 6 (1.54%) Financial Institution
8 6 (1.54%) Presentation Skills
9 5 (1.28%) Law
9 5 (1.28%) Manufacturing
10 4 (1.03%) Pharmaceutical
11 3 (0.77%) Aerospace
11 3 (0.77%) Aviation
11 3 (0.77%) Electronics
11 3 (0.77%) German Language
11 3 (0.77%) Local Government
11 3 (0.77%) Marketing
11 3 (0.77%) Retail
Job Titles
1 119 (30.51%) Network Engineer
2 72 (18.46%) Architect
3 43 (11.03%) Security Engineer
4 34 (8.72%) Senior
5 25 (6.41%) Cloud Architect
6 24 (6.15%) Security Architect
6 24 (6.15%) Technical Architect
7 23 (5.90%) Azure Engineer
7 23 (5.90%) Network Security Engineer
8 18 (4.62%) Analyst
8 18 (4.62%) Cloud Native Architect
8 18 (4.62%) Infrastructure Engineer
8 18 (4.62%) Network Architect
8 18 (4.62%) SC Cleared Network Engineer
9 17 (4.36%) Cisco Engineer
9 17 (4.36%) Consultant
10 15 (3.85%) AWS Architect
10 15 (3.85%) Cisco Network Engineer
11 14 (3.59%) AWS Engineer
11 14 (3.59%) Support Engineer
Libraries, Frameworks & Software Standards
1 8 (2.05%) .NET
1 8 (2.05%) ADO
1 8 (2.05%) React
2 7 (1.79%) LDAP
3 5 (1.28%) AWS CDK
3 5 (1.28%) RFC 2544
4 4 (1.03%) 802.1X
4 4 (1.03%) Dask
4 4 (1.03%) Elastic Stack
4 4 (1.03%) LAPP Stack
4 4 (1.03%) RabbitMQ
4 4 (1.03%) Web Services
5 3 (0.77%) OAuth
5 3 (0.77%) OpenID
5 3 (0.77%) RESTful
5 3 (0.77%) SAML
6 2 (0.51%) .NET Framework
6 2 (0.51%) ASP.NET
6 2 (0.51%) CSS
6 2 (0.51%) HTML
Miscellaneous
1 59 (15.13%) Data Centre
2 32 (8.21%) Cloud Native
3 17 (4.36%) Security Posture
4 13 (3.33%) Cyber Threat
5 11 (2.82%) Operational Technology
6 9 (2.31%) Onboarding
7 8 (2.05%) Enterprise Software
7 8 (2.05%) PKI
7 8 (2.05%) Security Operations Centre
7 8 (2.05%) Self-Motivation
8 7 (1.79%) Anti-Spyware
8 7 (1.79%) Hybrid Cloud
8 7 (1.79%) Management Information System
9 6 (1.54%) Private Cloud
10 5 (1.28%) Cyberattack
10 5 (1.28%) Data Protection Act
10 5 (1.28%) Replication
10 5 (1.28%) SCADA
11 4 (1.03%) NHS
11 4 (1.03%) Video Conferencing
Operating Systems
1 61 (15.64%) Windows
2 48 (12.31%) Linux
3 23 (5.90%) Windows Server
4 9 (2.31%) Red Hat Enterprise Linux
5 7 (1.79%) Windows 10
5 7 (1.79%) Windows Server 2016
6 6 (1.54%) Windows Server 2019
7 5 (1.28%) Unix
8 4 (1.03%) Ubuntu
8 4 (1.03%) Windows Server 2012
9 3 (0.77%) Android
10 1 (0.26%) AIX
10 1 (0.26%) Amazon Linux
10 1 (0.26%) CentOS
10 1 (0.26%) Mac OS X
10 1 (0.26%) Solaris
10 1 (0.26%) VMS
10 1 (0.26%) Windows 7
10 1 (0.26%) Windows Server 2008
Processes & Methodologies
1 63 (16.15%) Migration
2 61 (15.64%) Problem-Solving
3 55 (14.10%) Infrastructure as Code
4 54 (13.85%) Cybersecurity
5 42 (10.77%) DevOps
6 40 (10.26%) SIEM
7 37 (9.49%) CI/CD
8 35 (8.97%) Agile
9 31 (7.95%) Cloud Security
10 30 (7.69%) ITIL
11 29 (7.44%) High Availability
11 29 (7.44%) Incident Response
12 25 (6.41%) Security Operations
13 24 (6.15%) Infrastructure Engineering
13 24 (6.15%) Vulnerability Management
14 23 (5.90%) Change Management
14 23 (5.90%) Network Monitoring
14 23 (5.90%) Test Automation
15 22 (5.64%) Load Balancing
16 21 (5.38%) Network Architecture
Programming Languages
1 53 (13.59%) Python
2 44 (11.28%) PowerShell
3 27 (6.92%) Bicep
4 23 (5.90%) Bash
5 11 (2.82%) SQL
6 5 (1.28%) C#
6 5 (1.28%) JavaScript
6 5 (1.28%) TypeScript
7 4 (1.03%) Java
7 4 (1.03%) Shell Script
8 3 (0.77%) C++
8 3 (0.77%) Groovy
9 2 (0.51%) Go
9 2 (0.51%) Kusto Query Language
10 1 (0.26%) ActionScript 2.0
10 1 (0.26%) Korn
10 1 (0.26%) Perl
10 1 (0.26%) PHP
10 1 (0.26%) VB
10 1 (0.26%) VBScript
Qualifications
1 94 (24.10%) Security Cleared
2 82 (21.03%) SC Cleared
3 67 (17.18%) Cisco Certification
4 51 (13.08%) CCNP
5 31 (7.95%) Degree
6 27 (6.92%) CCNA
7 23 (5.90%) CISSP
8 20 (5.13%) CCIE
9 17 (4.36%) Computer Science Degree
10 11 (2.82%) Azure Certification
11 10 (2.56%) CISM
12 9 (2.31%) CEH
12 9 (2.31%) DV Cleared
12 9 (2.31%) Microsoft Certification
13 8 (2.05%) Master's Degree
14 6 (1.54%) CompTIA Security+
15 5 (1.28%) AWS Certification
15 5 (1.28%) CCIE Service Provider
15 5 (1.28%) CISA
16 3 (0.77%) GIAC
Quality Assurance & Compliance
1 21 (5.38%) NIST
2 13 (3.33%) ISO/IEC 27001
3 11 (2.82%) HIPAA
4 10 (2.56%) GDPR
5 8 (2.05%) PCI DSS
6 7 (1.79%) SLA
7 6 (1.54%) NCSC
8 3 (0.77%) QA
9 2 (0.51%) 21 CFR Part 11
9 2 (0.51%) Actionable Recommendations
9 2 (0.51%) Cyber Essentials
9 2 (0.51%) NIST 800
10 1 (0.26%) COBIT
10 1 (0.26%) Disclosure Scotland
10 1 (0.26%) GRC
10 1 (0.26%) ISO/IEC 27002 (supersedes ISO/IEC 17799)
10 1 (0.26%) PMO
10 1 (0.26%) SOC 2
System Software
1 42 (10.77%) Active Directory
2 30 (7.69%) VMware Infrastructure
3 17 (4.36%) Virtual Machines
4 16 (4.10%) Docker
5 10 (2.56%) VMware NSX
6 9 (2.31%) vSphere
7 8 (2.05%) Hyper-V
8 4 (1.03%) Firmware
8 4 (1.03%) Virtual Servers
9 3 (0.77%) DFS Replication
9 3 (0.77%) Microsoft Virtual Server
10 2 (0.51%) VMware ESXi
11 1 (0.26%) Terminal Services
11 1 (0.26%) Virtual Desktop
11 1 (0.26%) XenDesktop
Systems Management
1 62 (15.90%) Terraform
2 39 (10.00%) Ansible
3 30 (7.69%) Kubernetes
4 27 (6.92%) FortiGate
5 21 (5.38%) Microsoft Intune
6 14 (3.59%) Progress Chef
7 11 (2.82%) Puppet
8 8 (2.05%) Grafana
8 8 (2.05%) ZABBIX
9 7 (1.79%) SCCM
10 5 (1.28%) Cisco Prime
11 4 (1.03%) Kibana
11 4 (1.03%) Single Sign-On
12 3 (0.77%) CASB
12 3 (0.77%) Nagios
12 3 (0.77%) Prometheus
12 3 (0.77%) SELinux
12 3 (0.77%) vRealize Orchestrator
13 2 (0.51%) SCOM
13 2 (0.51%) WSUS
Vendors
1 153 (39.23%) Cisco
2 105 (26.92%) Palo Alto
3 73 (18.72%) Microsoft
4 62 (15.90%) Fortinet
5 57 (14.62%) CheckPoint
6 45 (11.54%) VMware
7 35 (8.97%) F5
8 22 (5.64%) SolarWinds
9 18 (4.62%) Aruba
9 18 (4.62%) Meraki
10 17 (4.36%) Juniper
11 15 (3.85%) Splunk
12 14 (3.59%) Infoblox
13 11 (2.82%) Arista
13 11 (2.82%) Zscaler
14 10 (2.56%) Google
15 8 (2.05%) Imperva
15 8 (2.05%) Red Hat
15 8 (2.05%) SAP
15 8 (2.05%) Tenable