Legal Jobs with Work from Home Options

Legal
UK > Work from Home

The table below looks at the prevalence of the term Legal in remote or hybrid work. Included is a benchmarking guide to the salaries offered in vacancies that cited Legal over the 6 months leading up to 26 July 2024, comparing them to the same period in the previous two years.

6 months to
26 Jul 2024
Same period 2023 Same period 2022
Rank 77 121 147
Rank change year-on-year +44 +26 +29
Permanent jobs citing Legal 994 885 2,188
As % of all permanent jobs with a WFH option 3.56% 2.70% 2.79%
As % of the General category 5.84% 4.14% 4.22%
Number of salaries quoted 498 649 965
10th Percentile £29,629 £31,500 £32,500
25th Percentile £40,000 £45,000 £42,500
Median annual salary (50th Percentile) £55,000 £57,500 £55,000
Median % change year-on-year -4.35% +4.55% +5.29%
75th Percentile £70,000 £75,000 £80,000
90th Percentile £85,000 £87,500 £100,000
UK median annual salary £50,000 £55,000 £55,000
% change year-on-year -9.09% - +4.76%

All General Skills
Work from Home

Legal falls under the General Skills category. For comparison with the information above, the following table provides summary statistics for all permanent job vacancies with remote or hybrid options requiring common skills.

Permanent vacancies with a requirement for common skills 17,022 21,367 51,870
As % of all permanent jobs with a WFH option 60.93% 65.11% 66.05%
Number of salaries quoted 11,520 15,606 26,987
10th Percentile £32,500 £36,250 £35,000
25th Percentile £42,500 £46,570 £45,000
Median annual salary (50th Percentile) £57,500 £62,500 £60,000
Median % change year-on-year -8.00% +4.17% +7.14%
75th Percentile £77,500 £82,500 £80,000
90th Percentile £100,000 £102,500 £96,250
UK median annual salary £54,000 £60,000 £60,000
% change year-on-year -10.00% - +6.19%

Legal
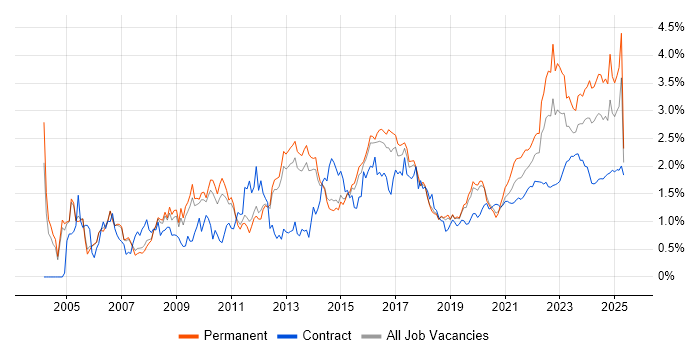
Trend for Jobs with a WFH Option

Job vacancies with a work from home option citing Legal as a proportion of all IT jobs advertised.

Legal trend for jobs with a WFH option

Legal
Salary Trend for Jobs with a WFH Option

3-month moving average salary quoted in job vacancies with a work from home option citing Legal.

Legal salary trend for jobs with a WFH option

Legal
Salary Histogram for Jobs with a WFH Option

Salary distribution for jobs with a work from home option citing Legal over the 6 months to 26 July 2024.

Legal salary histogram for jobs with a WFH option

Legal
Co-occurring Skills and Capabilities with WFH Options by Category

The follow tables expand on the table above by listing co-occurrences grouped by category. The same employment type, locality and period is covered with up to 20 co-occurrences shown in each of the following categories:

Application Platforms
1 35 (3.52%) SharePoint
2 24 (2.41%) Microsoft Exchange
3 16 (1.61%) CMS
4 5 (0.50%) Confluence
5 4 (0.40%) IIS
5 4 (0.40%) SAS
6 3 (0.30%) Apache Spark
6 3 (0.30%) WordPress
7 2 (0.20%) BizTalk Server
8 1 (0.10%) Documentum
Applications
1 99 (9.96%) Microsoft Office
2 84 (8.45%) Microsoft Excel
3 20 (2.01%) Microsoft PowerPoint
4 9 (0.91%) MS Visio
5 6 (0.60%) Spreadsheet
6 5 (0.50%) AutoCAD
6 5 (0.50%) SketchUp
7 3 (0.30%) Chatbot
8 2 (0.20%) Adobe Creative Suite
8 2 (0.20%) Microsoft Project
8 2 (0.20%) SPSS
9 1 (0.10%) Acrobat
9 1 (0.10%) InVision
9 1 (0.10%) Sketch
9 1 (0.10%) Zeplin
Business Applications
1 25 (2.52%) Elite 3E
2 17 (1.71%) Oracle ERP
3 15 (1.51%) NEC Housing
4 14 (1.41%) Dynamics CRM
5 12 (1.21%) iTrent
5 12 (1.21%) Oracle EBS
6 10 (1.01%) Infor SunSystems
7 8 (0.80%) PeopleSoft HCM
8 5 (0.50%) Relativity
9 4 (0.40%) Carpe Diem
9 4 (0.40%) SAP Payroll
10 3 (0.30%) Raiser’s Edge
10 3 (0.30%) SAP HR
10 3 (0.30%) SAP S/4HANA
11 2 (0.20%) BambooHR
11 2 (0.20%) Salesforce CRM
11 2 (0.20%) Visualfiles
12 1 (0.10%) Adobe Campaign
12 1 (0.10%) Oracle Payables
12 1 (0.10%) Oracle Procure-to-Pay
Cloud Services
1 165 (16.60%) Azure
2 76 (7.65%) Power Platform
3 75 (7.55%) Entra ID
4 73 (7.34%) Microsoft 365
5 67 (6.74%) AWS
6 32 (3.22%) SaaS
7 24 (2.41%) GCP
8 20 (2.01%) Azure DevOps
8 20 (2.01%) Dynamics 365
9 19 (1.91%) OCI
10 15 (1.51%) PowerApps
11 14 (1.41%) Azure Synapse Analytics
12 12 (1.21%) Azure Data Factory
13 11 (1.11%) Serverless
14 7 (0.70%) Azure Cosmos DB
14 7 (0.70%) Firebase
15 6 (0.60%) PaaS
15 6 (0.60%) WhatsApp
16 5 (0.50%) Cloud Computing
16 5 (0.50%) Collibra
Communications & Networking
1 24 (2.41%) Firewall
2 18 (1.81%) LAN
3 17 (1.71%) WAN
4 16 (1.61%) Intrusion Detection
5 13 (1.31%) Wireless
6 11 (1.11%) DHCP
6 11 (1.11%) VPN
7 10 (1.01%) Internet
7 10 (1.01%) Network Security
8 9 (0.91%) TCP/IP
9 8 (0.80%) IPsec
9 8 (0.80%) Skype
10 7 (0.70%) 5G
11 6 (0.60%) Broadband
11 6 (0.60%) DNS
11 6 (0.60%) OSPF
12 5 (0.50%) Remote Desktop
12 5 (0.50%) SD-WAN
13 4 (0.40%) BGP
13 4 (0.40%) NGFW
Database & Business Intelligence
1 55 (5.53%) Power BI
2 53 (5.33%) SQL Server
3 31 (3.12%) Data Warehouse
4 27 (2.72%) Relational Database
5 19 (1.91%) PostgreSQL
6 18 (1.81%) SQL Server Reporting Services
7 17 (1.71%) Data Lake
8 12 (1.21%) DB2
8 12 (1.21%) NoSQL
9 11 (1.11%) BusinessObjects
10 9 (0.91%) MySQL
11 7 (0.70%) Big Data
11 7 (0.70%) RDBMS
11 7 (0.70%) Tableau
12 6 (0.60%) DynamoDB
12 6 (0.60%) MongoDB
13 5 (0.50%) Ataccama
13 5 (0.50%) EDRMS
14 4 (0.40%) SQL Server Analysis Services
14 4 (0.40%) SQL Server Integration Services
Development Applications
1 15 (1.51%) Git
2 11 (1.11%) JIRA
3 8 (0.80%) Visual Studio
4 7 (0.70%) Cypress.io
5 6 (0.60%) GitLab
6 4 (0.40%) Jenkins
7 3 (0.30%) Axure RP
7 3 (0.30%) Eclipse
8 2 (0.20%) Appium
8 2 (0.20%) Atlassian Bamboo
8 2 (0.20%) Cucumber
8 2 (0.20%) JUnit
8 2 (0.20%) LoadRunner
8 2 (0.20%) NeoLoad
8 2 (0.20%) Selenium
8 2 (0.20%) SoapUI
8 2 (0.20%) TestNG
8 2 (0.20%) TestRail
8 2 (0.20%) WebDriver
9 1 (0.10%) Android Studio
General
1 367 (36.92%) Social Skills
2 326 (32.80%) Finance
3 190 (19.11%) Law
4 159 (16.00%) Analytical Skills
5 144 (14.49%) Retail
6 97 (9.76%) Marketing
7 76 (7.65%) Inclusion and Diversity
8 60 (6.04%) Banking
9 43 (4.33%) Influencing Skills
10 39 (3.92%) Organisational Skills
11 35 (3.52%) Public Sector
12 23 (2.31%) Local Government
13 17 (1.71%) Automotive
14 16 (1.61%) Police
15 15 (1.51%) Publishing
16 14 (1.41%) Documentation Skills
16 14 (1.41%) Pharmaceutical
17 13 (1.31%) Advertising
18 9 (0.91%) Manufacturing
18 9 (0.91%) Telecoms
Job Titles
1 323 (32.49%) Analyst
2 181 (18.21%) Senior
3 109 (10.97%) Lead
4 89 (8.95%) Business Analyst
5 72 (7.24%) Senior Analyst
6 61 (6.14%) Developer
7 50 (5.03%) Governance Analyst
8 43 (4.33%) IT Manager
9 39 (3.92%) Financial Analyst
10 36 (3.62%) Consultant
10 36 (3.62%) Lead Business Analyst
11 35 (3.52%) Project Manager
12 34 (3.42%) Business Analyst Team Leader
12 34 (3.42%) Team Leader
13 33 (3.32%) Software Engineer
14 27 (2.72%) Data Engineer
15 25 (2.52%) .NET Developer
15 25 (2.52%) Systems Analyst
16 22 (2.21%) Architect
17 18 (1.81%) Service Analyst
Libraries, Frameworks & Software Standards
1 60 (6.04%) HTML
2 45 (4.53%) .NET
3 36 (3.62%) CSS
4 32 (3.22%) React
5 22 (2.21%) Oracle Fusion
6 20 (2.01%) AngularJS
7 16 (1.61%) .NET Framework
7 16 (1.61%) Vue
8 15 (1.51%) XML
9 14 (1.41%) PySpark
10 11 (1.11%) .NET Core
11 10 (1.01%) REST
11 10 (1.01%) Tailwind CSS
12 9 (0.91%) Node.js
12 9 (0.91%) Twitter Bootstrap
13 8 (0.80%) Jest
13 8 (0.80%) SOAP
14 7 (0.70%) JSON
14 7 (0.70%) Svelte
14 7 (0.70%) Web Services
Miscellaneous
1 124 (12.47%) Management Information System
2 46 (4.63%) Algorithms
3 38 (3.82%) Data Structures
4 27 (2.72%) Product Ownership
5 21 (2.11%) Self-Motivation
6 20 (2.01%) Security Posture
7 19 (1.91%) Enterprise Software
7 19 (1.91%) Onboarding
8 18 (1.81%) Life Science
9 17 (1.71%) Public Cloud
10 16 (1.61%) Cyber Threat
10 16 (1.61%) Data Centre
11 13 (1.31%) Driving Licence
11 13 (1.31%) Greenfield Project
12 11 (1.11%) IoT
13 10 (1.01%) Mobile App
13 10 (1.01%) Renewable Energy
14 9 (0.91%) Robotics
15 8 (0.80%) Social Media
15 8 (0.80%) Virtual Team
Operating Systems
1 64 (6.44%) Windows
2 28 (2.82%) Windows 10
3 26 (2.62%) Windows Server
4 12 (1.21%) Android
4 12 (1.21%) Linux
5 11 (1.11%) Apple iOS
6 5 (0.50%) Windows Server 2016
7 4 (0.40%) Oracle Linux
8 3 (0.30%) Unix
8 3 (0.30%) Windows 8
8 3 (0.30%) Windows Server 2008
8 3 (0.30%) Windows Server 2012
9 2 (0.20%) Windows Server 2019
10 1 (0.10%) Mac OS X
Processes & Methodologies
1 215 (21.63%) Problem-Solving
2 213 (21.43%) Agile
3 210 (21.13%) Coaching
4 150 (15.09%) Information Security
5 146 (14.69%) Continuous Improvement
6 144 (14.49%) Cybersecurity
7 142 (14.29%) Roadmaps
8 137 (13.78%) ITIL
9 120 (12.07%) Project Management
10 118 (11.87%) Business Analysis
11 117 (11.77%) Mentoring
11 117 (11.77%) Process Improvement
12 109 (10.97%) Decision-Making
13 101 (10.16%) Disaster Recovery
14 98 (9.86%) Analytics
15 96 (9.66%) Logistics
16 95 (9.56%) SDLC
17 89 (8.95%) Impact Assessments
18 88 (8.85%) Business Intelligence
19 84 (8.45%) Data Management
Programming Languages
1 192 (19.32%) SQL
2 68 (6.84%) Python
3 65 (6.54%) PowerShell
4 47 (4.73%) C#
5 40 (4.02%) JavaScript
6 19 (1.91%) T-SQL
7 17 (1.71%) TypeScript
8 14 (1.41%) Java
9 9 (0.91%) Go
10 8 (0.80%) MATLAB
10 8 (0.80%) PHP
11 7 (0.70%) C++
11 7 (0.70%) R
12 6 (0.60%) Data Analysis Expressions
12 6 (0.60%) VB.NET
13 5 (0.50%) C
14 4 (0.40%) Scala
14 4 (0.40%) VBA
15 3 (0.30%) Bicep
15 3 (0.30%) Ruby
Qualifications
1 296 (29.78%) Degree
2 36 (3.62%) DBS Check
3 25 (2.52%) CISSP
4 24 (2.41%) Master's Degree
5 20 (2.01%) CISM
5 20 (2.01%) Security Cleared
6 16 (1.61%) Computer Science Degree
7 15 (1.51%) ACCA
7 15 (1.51%) MRICS
8 13 (1.31%) CISA
9 11 (1.11%) SC Cleared
10 9 (0.91%) ITIL Certification
11 8 (0.80%) Microsoft Certification
11 8 (0.80%) OSCP
12 7 (0.70%) MBA
13 6 (0.60%) CIMA
13 6 (0.60%) ISO 27001 Lead Auditor
14 5 (0.50%) ISO 27001 Lead Implementer
14 5 (0.50%) PMI Certification
15 4 (0.40%) PMP
Quality Assurance & Compliance
1 151 (15.19%) QA
2 57 (5.73%) ISO/IEC 27001
3 50 (5.03%) GDPR
4 23 (2.31%) Accessibility
5 21 (2.11%) GRC
6 18 (1.81%) Data Quality
6 18 (1.81%) SLA
7 16 (1.61%) ISO 22301
8 15 (1.51%) Cyber Essentials
8 15 (1.51%) NIST
9 13 (1.31%) ISO 9001
10 11 (1.11%) ISO 14001
11 9 (0.91%) NEBOSH
12 6 (0.60%) Cyber Essentials PLUS
12 6 (0.60%) PMO
13 5 (0.50%) PCI DSS
14 4 (0.40%) GLP
14 4 (0.40%) HIPAA
14 4 (0.40%) IFRS
14 4 (0.40%) NCSC
System Software
1 97 (9.76%) Active Directory
2 50 (5.03%) RACF
3 11 (1.11%) VMware Infrastructure
4 7 (0.70%) Hyper-V
5 6 (0.60%) Docker
6 3 (0.30%) Firmware
6 3 (0.30%) Terminal Services
7 2 (0.20%) VMware ESXi
8 1 (0.10%) Microsoft Virtual Server
8 1 (0.10%) Virtual Desktop
8 1 (0.10%) Virtual Servers
8 1 (0.10%) vSphere
Systems Management
1 10 (1.01%) Microsoft Intune
1 10 (1.01%) SCCM
1 10 (1.01%) SCOM
2 8 (0.80%) Terraform
3 7 (0.70%) Ansible
4 5 (0.50%) Kubernetes
5 3 (0.30%) Active Directory Federation Services
5 3 (0.30%) AirWatch
6 2 (0.20%) QRadar
7 1 (0.10%) FTK
7 1 (0.10%) SCOrch
7 1 (0.10%) Single Sign-On
7 1 (0.10%) vCenter Server
Vendors
1 298 (29.98%) Microsoft
2 53 (5.33%) Oracle
3 51 (5.13%) SAP
4 50 (5.03%) CyberArk
5 34 (3.42%) iManage
6 21 (2.11%) Google
7 18 (1.81%) Databricks
8 17 (1.71%) Intapp
9 16 (1.61%) Aderant
9 16 (1.61%) IBM
9 16 (1.61%) NEC
10 15 (1.51%) ServiceNow
10 15 (1.51%) VMware
11 13 (1.31%) Adobe
12 10 (1.01%) Infor
12 10 (1.01%) PeopleSoft
13 9 (0.91%) Salesforce
14 8 (0.80%) Hyperion
14 8 (0.80%) JD Edwards
15 7 (0.70%) DocuSign