Logistics Contracts with Work from Home Options

Logistics
UK > Work from Home

The table below provides summary statistics for contract job vacancies with an option to work from home (WFH) and a requirement for Logistics skills. Included is a benchmarking guide to the contractor rates offered in vacancies that have cited Logistics over the 6 months to 2 May 2024 with a comparison to the same period in the previous 2 years.

6 months to
2 May 2024
Same period 2023 Same period 2022
Rank 203 243 272
Rank change year-on-year +40 +29 +9
Contract jobs citing Logistics 148 248 431
As % of all contract jobs with a WFH option 0.97% 0.97% 0.97%
As % of the Processes & Methodologies category 1.10% 1.08% 1.06%
Number of daily rates quoted 87 148 253
10th Percentile £313 £312 £350
25th Percentile £413 £400 £445
Median daily rate (50th Percentile) £525 £500 £510
Median % change year-on-year +5.00% -1.96% +2.00%
75th Percentile £685 £600 £600
90th Percentile £838 £735 £679
UK median daily rate £525 £500 £525
% change year-on-year +5.00% -4.76% +7.69%
Number of hourly rates quoted 3 4 2
10th Percentile £66.04 £15.83 £35.66
25th Percentile £72.59 £15.96 £38.15
Median hourly rate £85.00 £46.03 £42.81
Median % change year-on-year +84.68% +7.52% -30.96%
75th Percentile £86.50 £83.13 £46.96
90th Percentile - £93.25 £49.15
UK median hourly rate £18.00 £10.63 £31.00
% change year-on-year +69.33% -65.71% -29.01%

All Process and Methodology Skills
Work from Home

Logistics is in the Processes and Methodologies category. The following table is for comparison with the above and provides summary statistics for all contract job vacancies with a WFH option and a requirement for process or methodology skills.

Contract vacancies with a requirement for process or methodology skills 13,413 23,039 40,643
As % of all contract jobs with a WFH option 87.92% 89.76% 91.17%
Number of daily rates quoted 8,959 16,290 29,502
10th Percentile £325 £363 £361
25th Percentile £425 £450 £431
Median daily rate (50th Percentile) £525 £540 £525
Median % change year-on-year -2.78% +2.86% +8.81%
75th Percentile £638 £650 £625
90th Percentile £750 £750 £719
UK median daily rate £525 £550 £528
% change year-on-year -4.55% +4.17% +8.31%
Number of hourly rates quoted 580 529 544
10th Percentile £15.17 £19.00 £13.58
25th Percentile £25.38 £30.54 £19.98
Median hourly rate £43.00 £55.00 £35.00
Median % change year-on-year -21.82% +57.14% +34.62%
75th Percentile £60.00 £68.75 £55.00
90th Percentile £75.25 £80.00 £67.35
UK median hourly rate £35.58 £36.00 £25.00
% change year-on-year -1.18% +44.00% -

Logistics
Trend for Jobs with a WFH Option

Job vacancies with a work from home option citing Logistics as a proportion of all IT jobs advertised.
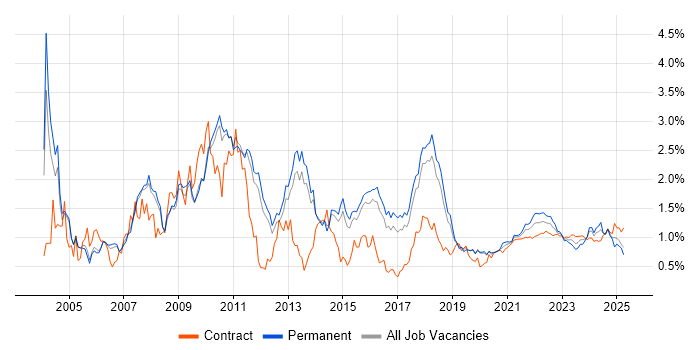
Logistics trend for jobs with a WFH option

Logistics
Daily Rate Trend for Jobs with a WFH Option

3-month moving average daily rate quoted in job vacancies with a work from home option citing Logistics.

Logistics daily rate for jobs with a WFH option

Logistics
Daily Rate Histogram for Jobs with a WFH Option

Daily rate distribution for jobs with a work from home option citing Logistics over the 6 months to 2 May 2024.

Logistics daily rate histogram for jobs with a WFH option

Logistics
Hourly Rate Trend for Jobs with a WFH Option

3-month moving average hourly rate quoted in job vacancies with a work from home option citing Logistics.

Logistics hourly rate for jobs with a WFH option

Logistics
Hourly Rate Histogram for Jobs with a WFH Option

Hourly rate distribution for jobs with a work from home option citing Logistics over the 6 months to 2 May 2024.

Logistics hourly rate histogram for jobs with a WFH option

Logistics
Co-occurring Skills and Capabilities with WFH Options by Category

The follow tables expand on the table above by listing co-occurrences grouped by category. The same employment type, locality and period is covered with up to 20 co-occurrences shown in each of the following categories:

Application Platforms
1 10 (6.76%) SharePoint
2 4 (2.70%) SAS
Applications
1 12 (8.11%) Microsoft Excel
2 8 (5.41%) Microsoft PowerPoint
3 7 (4.73%) Microsoft Office
4 2 (1.35%) MS Visio
5 1 (0.68%) Photoshop
Business Applications
1 24 (16.22%) SAP S/4HANA
2 9 (6.08%) SAP SD
3 7 (4.73%) SAP PM
3 7 (4.73%) SAP WM
4 6 (4.05%) SAP MM
5 4 (2.70%) SAP EWM
5 4 (2.70%) SAP FI
6 3 (2.03%) SAP ERP
7 2 (1.35%) SAP Forecasting and Replenishment
7 2 (1.35%) SAP Retail
8 1 (0.68%) OpenLink RightAngle
8 1 (0.68%) Oracle EBS R12
8 1 (0.68%) Oracle General Ledger
8 1 (0.68%) Oracle Procure-to-Pay
8 1 (0.68%) Salesforce CRM
8 1 (0.68%) SAP CO
8 1 (0.68%) SAP GTS
8 1 (0.68%) SAP HCM
8 1 (0.68%) SAP LE
8 1 (0.68%) SAP Travel Management
Cloud Services
1 9 (6.08%) Dynamics 365
2 6 (4.05%) Azure
2 6 (4.05%) Power Platform
3 5 (3.38%) AWS
4 4 (2.70%) SaaS
5 3 (2.03%) Microsoft 365
5 3 (2.03%) PaaS
5 3 (2.03%) SuccessFactors
5 3 (2.03%) WhatsApp
6 2 (1.35%) Azure Service Bus
7 1 (0.68%) Azure Functions
7 1 (0.68%) Boomi
7 1 (0.68%) Canva
7 1 (0.68%) GitHub
7 1 (0.68%) OCI
7 1 (0.68%) Oracle CX
7 1 (0.68%) PowerApps
7 1 (0.68%) Serverless
7 1 (0.68%) Slack
7 1 (0.68%) Snowflake
Communications & Networking
1 1 (0.68%) Intranet
1 1 (0.68%) SMS
Database & Business Intelligence
1 6 (4.05%) Power BI
2 4 (2.70%) Crystal Reports
3 2 (1.35%) Data Mining
3 2 (1.35%) NoSQL
3 2 (1.35%) SAP HANA
3 2 (1.35%) SQL Server
4 1 (0.68%) Amazon RDS
4 1 (0.68%) MongoDB
4 1 (0.68%) PostgreSQL
4 1 (0.68%) Power Query
4 1 (0.68%) SQL Server Analysis Services
4 1 (0.68%) SQL Server Integration Services
4 1 (0.68%) SQL Server Reporting Services
4 1 (0.68%) Tableau
4 1 (0.68%) Tableau Desktop
Development Applications
1 6 (4.05%) JIRA
2 5 (3.38%) Selenium
3 3 (2.03%) Jenkins
3 3 (2.03%) JUnit
3 3 (2.03%) REST Assured
3 3 (2.03%) TestNG
3 3 (2.03%) Visual Studio Team System
4 1 (0.68%) Git
4 1 (0.68%) GitLab
General
1 42 (28.38%) Social Skills
2 34 (22.97%) Finance
3 21 (14.19%) Analytical Skills
4 15 (10.14%) Manufacturing
5 7 (4.73%) Inclusion and Diversity
5 7 (4.73%) Influencing Skills
5 7 (4.73%) Presentation Skills
5 7 (4.73%) Retail
5 7 (4.73%) Telecoms
6 5 (3.38%) Documentation Skills
6 5 (3.38%) Marketing
7 3 (2.03%) Pharmaceutical
8 2 (1.35%) Automotive
8 2 (1.35%) Banking
8 2 (1.35%) Billing
8 2 (1.35%) Organisational Skills
9 1 (0.68%) Arabic Language
9 1 (0.68%) Cantonese Language
9 1 (0.68%) Czech Language
9 1 (0.68%) Public Sector
Job Titles
1 41 (27.70%) Consultant
2 25 (16.89%) SAP Consultant
3 16 (10.81%) Analyst
4 15 (10.14%) Senior
5 14 (9.46%) Functional Consultant
6 10 (6.76%) Project Manager
7 9 (6.08%) Senior Manager
8 8 (5.41%) Architect
8 8 (5.41%) Business Analyst
8 8 (5.41%) Developer
8 8 (5.41%) Lead
8 8 (5.41%) SAP SD Consultant
9 7 (4.73%) SAP Functional Consultant
10 6 (4.05%) Cutover Manager
10 6 (4.05%) Dynamics 365 Consultant
11 5 (3.38%) Solutions Architect
12 4 (2.70%) Programme Manager
12 4 (2.70%) SAP Manager
12 4 (2.70%) SAP WM Consultant
12 4 (2.70%) Security Specialist
Libraries, Frameworks & Software Standards
1 8 (5.41%) EDI
2 3 (2.03%) REST
2 3 (2.03%) SAP TM
3 2 (1.35%) .NET
3 2 (1.35%) IDoc
3 2 (1.35%) XML
4 1 (0.68%) AngularJS
4 1 (0.68%) ASP.NET
4 1 (0.68%) BAPI
4 1 (0.68%) Django
4 1 (0.68%) HTML
4 1 (0.68%) JSON
4 1 (0.68%) Middleware
4 1 (0.68%) NgRx
4 1 (0.68%) OAuth
4 1 (0.68%) OAuth2
4 1 (0.68%) Oracle Fusion
4 1 (0.68%) SAP Fiori
4 1 (0.68%) Web Services
Miscellaneous
1 8 (5.41%) Management Information System
2 4 (2.70%) FMCG
2 4 (2.70%) Legacy Systems
2 4 (2.70%) Robotics
3 3 (2.03%) Enterprise Software
3 3 (2.03%) Onboarding
3 3 (2.03%) Wiki
4 2 (1.35%) Renewable Energy
4 2 (1.35%) Solar Energy
4 2 (1.35%) Video Conferencing
5 1 (0.68%) Analytical Mindset
5 1 (0.68%) Blockchain
5 1 (0.68%) BYOD
5 1 (0.68%) Cyberattack
5 1 (0.68%) Data Centre
5 1 (0.68%) Data Protection Act
5 1 (0.68%) Driving Licence
5 1 (0.68%) Self-Motivation
5 1 (0.68%) Social Media
5 1 (0.68%) Web3
Operating Systems
1 4 (2.70%) Linux
2 1 (0.68%) Android
2 1 (0.68%) Apple iOS
2 1 (0.68%) Red Hat Enterprise Linux
2 1 (0.68%) Windows
2 1 (0.68%) Windows Server
2 1 (0.68%) Windows Server 2016
Processes & Methodologies
1 27 (18.24%) Migration
2 25 (16.89%) Problem-Solving
3 22 (14.86%) Project Management
4 21 (14.19%) ERP
5 20 (13.51%) Project Delivery
5 20 (13.51%) Stakeholder Management
6 18 (12.16%) Data Migration
7 15 (10.14%) Supply Chain Management
8 14 (9.46%) Agile
9 13 (8.78%) Business Analysis
9 13 (8.78%) Inventory Management
10 11 (7.43%) Change Management
10 11 (7.43%) User Acceptance Testing
11 10 (6.76%) Order Management
12 9 (6.08%) Integration Testing
12 9 (6.08%) Procure-to-Pay
12 9 (6.08%) Test Scripting
13 8 (5.41%) Analytics
13 8 (5.41%) Continuous Improvement
13 8 (5.41%) Workshop Facilitation
Programming Languages
1 15 (10.14%) SQL
2 7 (4.73%) C#
2 7 (4.73%) Java
3 4 (2.70%) Python
4 2 (1.35%) ABAP
5 1 (0.68%) C
5 1 (0.68%) C++
5 1 (0.68%) Data Analysis Expressions
5 1 (0.68%) PL/SQL
5 1 (0.68%) PowerShell
5 1 (0.68%) T-SQL
Qualifications
1 18 (12.16%) Degree
2 10 (6.76%) Security Cleared
3 8 (5.41%) SC Cleared
4 6 (4.05%) SAP Certification
5 4 (2.70%) Computer Science Degree
6 3 (2.03%) DV Cleared
6 3 (2.03%) ISTQB
6 3 (2.03%) PMI Certification
6 3 (2.03%) PMP
7 1 (0.68%) BPSS Clearance
7 1 (0.68%) CBAP
7 1 (0.68%) IIBA
7 1 (0.68%) ISEB
7 1 (0.68%) Microsoft Certification
Quality Assurance & Compliance
1 5 (3.38%) PMO
2 4 (2.70%) Cyber Essentials
2 4 (2.70%) Data Quality
2 4 (2.70%) GDPR
2 4 (2.70%) ISO/IEC 27001
2 4 (2.70%) ISO/IEC 27002 (supersedes ISO/IEC 17799)
2 4 (2.70%) QA
3 3 (2.03%) NIST
4 2 (1.35%) GRC
5 1 (0.68%) SLA
System Software
1 1 (0.68%) Active Directory
Systems Management
1 1 (0.68%) HP Quality Center
1 1 (0.68%) Jamf Pro
1 1 (0.68%) Kubernetes
1 1 (0.68%) Single Sign-On
1 1 (0.68%) Terraform
Vendors
1 57 (38.51%) SAP
2 21 (14.19%) Microsoft
3 9 (6.08%) Oracle
4 6 (4.05%) Ariba
5 4 (2.70%) IFS
6 3 (2.03%) IBM
6 3 (2.03%) Kofax
6 3 (2.03%) ReadSoft
7 2 (1.35%) IBM Sterling
7 2 (1.35%) Salesforce
7 2 (1.35%) ServiceNow
8 1 (0.68%) Epicor
8 1 (0.68%) iManage
8 1 (0.68%) Intapp
8 1 (0.68%) MuleSoft
8 1 (0.68%) Okta
8 1 (0.68%) OpenLink
8 1 (0.68%) Snow
8 1 (0.68%) Triple Point
8 1 (0.68%) webMethods