Machine Learning Contracts with Hybrid/Remote/WFH Options

Machine Learning (ML)
UK > Work from Home

The table below provides summary statistics for remote or hybrid contract work requiring Machine Learning skills. It includes a benchmarking guide to the contractor rates offered in vacancies that cited Machine Learning over the 6 months leading up to 4 August 2025, comparing them to the same period in the previous two years.

6 months to
4 Aug 2025
Same period 2024 Same period 2023
Rank 94 136 202
Rank change year-on-year +42 +66 -7
Contract jobs citing Machine Learning 279 221 257
As % of all contract jobs with a WFH option 2.75% 1.67% 1.15%
As % of the Processes & Methodologies category 3.00% 1.92% 1.29%
Number of daily rates quoted 178 144 194
10th Percentile £368 £366 £400
25th Percentile £456 £463 £476
Median daily rate (50th Percentile) £550 £588 £575
Median % change year-on-year -6.38% +2.17% -4.17%
75th Percentile £675 £725 £688
90th Percentile £806 £784 £860
UK median daily rate £550 £600 £575
% change year-on-year -8.33% +4.35% -4.17%
Number of hourly rates quoted 1 3 2
10th Percentile - £75.25 £78.75
25th Percentile £76.25 £75.63 £80.63
Median hourly rate £77.50 £77.50 £85.00
Median % change year-on-year - -8.82% +30.77%
75th Percentile £78.75 £79.38 £88.13
90th Percentile - £79.75 £89.25
UK median hourly rate £75.00 £46.18 £46.18
% change year-on-year +62.41% - +2.62%

All Process and Methodology Skills
Work from Home

Machine Learning falls under the Processes and Methodologies category. For comparison with the information above, the following table provides summary statistics for all contract job vacancies with remote or hybrid options requiring process or methodology skills.

Contract vacancies with a requirement for process or methodology skills 9,305 11,517 19,986
As % of all contract jobs with a WFH option 91.83% 87.24% 89.46%
Number of daily rates quoted 6,241 7,714 14,067
10th Percentile £325 £325 £350
25th Percentile £413 £425 £440
Median daily rate (50th Percentile) £508 £525 £538
Median % change year-on-year -3.33% -2.33% -1.38%
75th Percentile £625 £638 £650
90th Percentile £750 £750 £750
UK median daily rate £500 £525 £550
% change year-on-year -4.76% -4.55% -
Number of hourly rates quoted 281 402 474
10th Percentile £12.62 £17.52 £17.50
25th Percentile £18.54 £30.56 £26.00
Median hourly rate £34.48 £43.00 £50.00
Median % change year-on-year -19.81% -14.00% +11.11%
75th Percentile £65.00 £65.20 £67.50
90th Percentile £71.25 £75.00 £78.75
UK median hourly rate £25.15 £40.33 £42.50
% change year-on-year -37.63% -5.12% +60.38%

Machine Learning
Trend for Jobs with a WFH Option

Job vacancies with remote working options citing Machine Learning as a proportion of all IT jobs advertised.
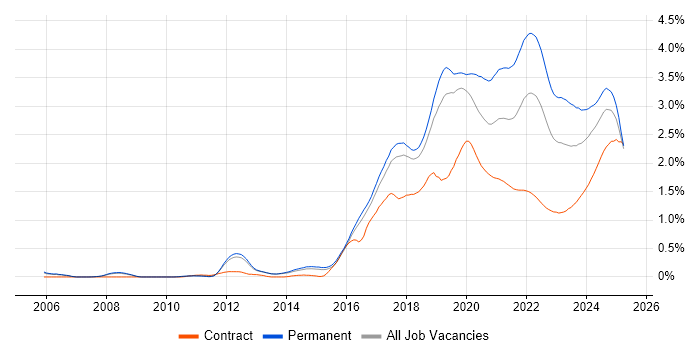
Machine Learning trend for jobs with Hybrid/Remote/WFH options

Machine Learning
Daily Rate Trend for Jobs with a WFH Option

3-month moving average daily rate quoted in job vacancies with remote working options citing Machine Learning.

Machine Learning daily rate for jobs with a WFH option

Machine Learning
Daily Rate Histogram for Jobs with a WFH Option

Daily rate distribution for jobs with remote working options citing Machine Learning over the 6 months to 4 August 2025.

Machine Learning daily rate histogram for jobs with a WFH option

Machine Learning
Hourly Rate Trend for Jobs with a WFH Option

3-month moving average hourly rate quoted in job vacancies with remote working options citing Machine Learning.

Machine Learning hourly rate for jobs with a WFH option

Machine Learning
Co-occurring Skills and Capabilities with WFH Options by Category

The follow tables expand on the table above by listing co-occurrences grouped by category. The same employment type, locality and period is covered with up to 20 co-occurrences shown in each of the following categories:

Application Platforms
1 36 (12.90%) Apache Spark
2 14 (5.02%) Apache Airflow
3 7 (2.51%) Apache
4 4 (1.43%) Confluence
4 4 (1.43%) Jupyter
5 1 (0.36%) ArcGIS
5 1 (0.36%) IBM Domino
5 1 (0.36%) Luigi
5 1 (0.36%) Red Hat Fuse
5 1 (0.36%) SAS
5 1 (0.36%) SharePoint
Applications
1 5 (1.79%) Chatbot
2 2 (0.72%) Microsoft Excel
2 2 (0.72%) Microsoft PowerPoint
3 1 (0.36%) GNU Octave
3 1 (0.36%) Microsoft Office
3 1 (0.36%) Microsoft Project
Business Applications
1 2 (0.72%) Distributed Ledger
1 2 (0.72%) SAP PM
2 1 (0.36%) Primavera
2 1 (0.36%) SAP S/4HANA
Cloud Services
1 113 (40.50%) Azure
2 106 (37.99%) AWS
3 44 (15.77%) GCP
4 26 (9.32%) GitHub
5 22 (7.89%) Azure Machine Learning
6 21 (7.53%) Azure DevOps
7 20 (7.17%) GitHub Actions
7 20 (7.17%) Serverless
8 17 (6.09%) Amazon SageMaker
8 17 (6.09%) AWS Lambda
9 16 (5.73%) Azure Data Factory
9 16 (5.73%) Power Platform
10 15 (5.38%) Azure Synapse Analytics
10 15 (5.38%) Snowflake
11 14 (5.02%) Vertex AI
12 12 (4.30%) dbt
13 11 (3.94%) Amazon S3
14 10 (3.58%) Cloud Computing
15 8 (2.87%) OpenShift
16 7 (2.51%) Amazon SQS
Communications & Networking
1 5 (1.79%) Firewall
2 3 (1.08%) HTTP
3 2 (0.72%) DNS
3 2 (0.72%) Intrusion Detection
3 2 (0.72%) LAN
3 2 (0.72%) LTE
3 2 (0.72%) MQTT
3 2 (0.72%) Network Security
3 2 (0.72%) WAN
4 1 (0.36%) Kerberos
4 1 (0.36%) NAS
4 1 (0.36%) VPN
Database & Business Intelligence
1 27 (9.68%) Big Data
2 23 (8.24%) Data Warehouse
3 16 (5.73%) NoSQL
3 16 (5.73%) Power BI
4 14 (5.02%) Hadoop
4 14 (5.02%) PostgreSQL
5 13 (4.66%) Data Lake
5 13 (4.66%) Tableau
6 12 (4.30%) MongoDB
7 10 (3.58%) BigQuery
8 9 (3.23%) Delta Lake
8 9 (3.23%) DynamoDB
9 6 (2.15%) Azure SQL Database
10 5 (1.79%) GIS
11 4 (1.43%) Flink
11 4 (1.43%) Geospatial Data
11 4 (1.43%) MySQL
11 4 (1.43%) Pinecone
12 3 (1.08%) Metadata
12 3 (1.08%) Weaviate
Development Applications
1 21 (7.53%) Git
2 19 (6.81%) Jenkins
3 16 (5.73%) MLflow
4 12 (4.30%) JIRA
5 11 (3.94%) GitLab
6 6 (2.15%) JUnit
6 6 (2.15%) SonarQube
7 5 (1.79%) Mockito
8 4 (1.43%) Gatling
8 4 (1.43%) JMeter
8 4 (1.43%) Snyk
9 3 (1.08%) Cypress.io
10 2 (0.72%) Bitbucket
11 1 (0.36%) CMake
11 1 (0.36%) Cucumber
11 1 (0.36%) ERwin
11 1 (0.36%) Postman
11 1 (0.36%) REST Assured
11 1 (0.36%) Visual Studio
General
1 83 (29.75%) Social Skills
2 48 (17.20%) Finance
3 37 (13.26%) Analytical Skills
4 31 (11.11%) Banking
5 24 (8.60%) Investment Banking
6 23 (8.24%) Marketing
7 21 (7.53%) Public Sector
8 8 (2.87%) Inclusion and Diversity
9 7 (2.51%) Organisational Skills
10 6 (2.15%) Advertising
10 6 (2.15%) Front Office
10 6 (2.15%) Influencing Skills
10 6 (2.15%) Legal
10 6 (2.15%) Retail
11 5 (1.79%) Pharmaceutical
12 4 (1.43%) Manufacturing
12 4 (1.43%) Telecoms
13 3 (1.08%) Presentation Skills
14 2 (0.72%) Games
14 2 (0.72%) Retail Banking
Job Titles
1 42 (15.05%) Data Scientist
2 41 (14.70%) Developer
3 39 (13.98%) Architect
4 34 (12.19%) Artificial Intelligence Engineer
5 30 (10.75%) Senior
6 23 (8.24%) Data Engineer
7 19 (6.81%) Python Developer
8 17 (6.09%) Lead
9 15 (5.38%) Artificial Intelligence Developer
10 13 (4.66%) Machine Learning Engineer
10 13 (4.66%) Python Engineer
11 11 (3.94%) Senior Data Scientist
11 11 (3.94%) Solutions Architect
12 10 (3.58%) Analyst
12 10 (3.58%) Cloud Architect
13 9 (3.23%) Azure Engineer
13 9 (3.23%) Data Architect
13 9 (3.23%) Product Manager
14 8 (2.87%) Consultant
14 8 (2.87%) Java Developer
Libraries, Frameworks & Software Standards
1 36 (12.90%) PyTorch
2 33 (11.83%) TensorFlow
3 30 (10.75%) Pandas
4 27 (9.68%) scikit-learn
5 22 (7.89%) React
6 19 (6.81%) Kafka
7 18 (6.45%) FastAPI
8 17 (6.09%) LangChain
9 16 (5.73%) NumPy
10 14 (5.02%) Django
11 13 (4.66%) RESTful
12 11 (3.94%) REST
13 9 (3.23%) Hugging Face
13 9 (3.23%) Spring
13 9 (3.23%) Spring Boot
14 8 (2.87%) .NET
14 8 (2.87%) Matplotlib
15 7 (2.51%) AWS CDK
15 7 (2.51%) GraphQL
16 6 (2.15%) PySpark
Miscellaneous
1 32 (11.47%) Algorithms
2 20 (7.17%) Cloud Native
2 20 (7.17%) Distributed Systems
3 15 (5.38%) AI Agents
4 11 (3.94%) Data Protection Act
5 8 (2.87%) Management Information System
5 8 (2.87%) Multi-touch
6 7 (2.51%) Product Ownership
7 6 (2.15%) Data Structures
7 6 (2.15%) Enterprise Software
7 6 (2.15%) Greenfield Project
7 6 (2.15%) Legacy Systems
7 6 (2.15%) Virtual Team
8 5 (1.79%) Digital Media
8 5 (1.79%) Hybrid Cloud
8 5 (1.79%) IoT
8 5 (1.79%) Marketing Technology
9 4 (1.43%) Distributed Computing
9 4 (1.43%) Reinsurance
10 3 (1.08%) Cyber Threat
Operating Systems
1 7 (2.51%) Linux
2 4 (1.43%) Windows
3 3 (1.08%) VMS
4 2 (0.72%) Android
4 2 (0.72%) Unix
5 1 (0.36%) Apple iOS
5 1 (0.36%) Red Hat Enterprise Linux
5 1 (0.36%) Ubuntu
Processes & Methodologies
1 199 (71.33%) Artificial Intelligence
2 116 (41.58%) Data Science
3 84 (30.11%) CI/CD
4 74 (26.52%) Analytics
5 69 (24.73%) LLM
6 68 (24.37%) DevOps
7 65 (23.30%) Agile
8 64 (22.94%) Problem-Solving
9 56 (20.07%) Generative AI
10 42 (15.05%) Computer Science
11 41 (14.70%) Data Pipeline
12 40 (14.34%) Data Engineering
13 38 (13.62%) MLOps
14 33 (11.83%) Business Intelligence
14 33 (11.83%) Decision-Making
15 30 (10.75%) Data Analysis
16 28 (10.04%) Infrastructure as Code
17 27 (9.68%) Statistical Modelling
18 26 (9.32%) Data Governance
18 26 (9.32%) Predictive Analytics
Programming Languages
1 164 (58.78%) Python
2 84 (30.11%) SQL
3 35 (12.54%) Java
4 31 (11.11%) R
4 31 (11.11%) TypeScript
5 20 (7.17%) JavaScript
6 10 (3.58%) C#
7 8 (2.87%) Scala
8 6 (2.15%) Bicep
9 5 (1.79%) Go
10 4 (1.43%) C++
10 4 (1.43%) PowerShell
11 3 (1.08%) Bash
11 3 (1.08%) C
12 2 (0.72%) Kusto Query Language
13 1 (0.36%) Kotlin
13 1 (0.36%) Rust
13 1 (0.36%) Shell Script
Qualifications
1 45 (16.13%) Degree
2 36 (12.90%) Security Cleared
3 35 (12.54%) SC Cleared
4 21 (7.53%) PhD
5 14 (5.02%) Master's Degree
6 12 (4.30%) AWS Certification
7 9 (3.23%) Computer Science Degree
8 8 (2.87%) Azure Certification
9 5 (1.79%) CISSP
10 3 (1.08%) BPSS Clearance
10 3 (1.08%) DV Cleared
10 3 (1.08%) MCP
11 2 (0.72%) AWS Certified Solutions Architect
11 2 (0.72%) CompTIA Security+
11 2 (0.72%) Numerate Degree
12 1 (0.36%) GCIA
12 1 (0.36%) GCIH
12 1 (0.36%) GIAC
12 1 (0.36%) ISO 27001 Lead Auditor
12 1 (0.36%) TOGAF Certification
Quality Assurance & Compliance
1 21 (7.53%) GDPR
2 19 (6.81%) Data Quality
3 10 (3.58%) ISO/IEC 27001
4 8 (2.87%) NIST
5 7 (2.51%) Accessibility
5 7 (2.51%) QA
6 4 (1.43%) Actionable Recommendations
6 4 (1.43%) California Consumer Privacy Act
7 2 (0.72%) EU AI Act
7 2 (0.72%) GRC
7 2 (0.72%) HIPAA
7 2 (0.72%) NCSC
7 2 (0.72%) NIST 800
8 1 (0.36%) PCI DSS
8 1 (0.36%) Sarbanes-Oxley
8 1 (0.36%) SNOMED CT
System Software
1 36 (12.90%) Docker
2 1 (0.36%) Active Directory
2 1 (0.36%) VMware Infrastructure
Systems Management
1 46 (16.49%) Kubernetes
2 29 (10.39%) Terraform
3 14 (5.02%) Ansible
4 9 (3.23%) Kubeflow
5 8 (2.87%) Prometheus
6 6 (2.15%) Grafana
7 3 (1.08%) Cilium
7 3 (1.08%) Rsyslog
7 3 (1.08%) SCOM
8 2 (0.72%) Argo
8 2 (0.72%) Kibana
9 1 (0.36%) Progress Chef
9 1 (0.36%) Puppet
9 1 (0.36%) QRadar
Vendors
1 41 (14.70%) Databricks
2 26 (9.32%) Microsoft
3 20 (7.17%) Google
4 15 (5.38%) OpenAI
5 6 (2.15%) SAP
6 4 (1.43%) NVIDIA
6 4 (1.43%) Oracle
6 4 (1.43%) ServiceNow
7 3 (1.08%) Foundry
7 3 (1.08%) Informatica
7 3 (1.08%) Palantir
7 3 (1.08%) Splunk
8 2 (0.72%) Autodesk
8 2 (0.72%) IBM
8 2 (0.72%) Qualtrics
8 2 (0.72%) Red Hat
8 2 (0.72%) Sage
8 2 (0.72%) VMware
9 1 (0.36%) Criteo
9 1 (0.36%) Refinitiv