Presentation Skills Contracts with Hybrid/Remote/WFH Options

Presentation Skills
UK > Work from Home

The table below looks at the prevalence of the term Presentation Skills in remote or hybrid contract work. Included is a benchmarking guide to the contractor rates offered in vacancies that cited Presentation Skills over the 6 months leading up to 6 May 2025, comparing them to the same period in the previous two years.

6 months to
6 May 2025
Same period 2024 Same period 2023
Rank 125 128 134
Rank change year-on-year +3 +6 +7
Contract jobs citing Presentation Skills 200 251 472
As % of all contract jobs with a WFH option 2.02% 1.66% 1.85%
As % of the General category 3.24% 2.82% 3.16%
Number of daily rates quoted 118 163 291
10th Percentile £287 £300 £363
25th Percentile £384 £413 £450
Median daily rate (50th Percentile) £500 £525 £525
Median % change year-on-year -4.76% - +0.96%
75th Percentile £588 £600 £606
90th Percentile £679 £688 £739
UK median daily rate £513 £520 £533
% change year-on-year -1.44% -2.48% +1.57%
Number of hourly rates quoted 6 5 16
10th Percentile £48.63 - £20.61
25th Percentile £62.19 £15.42 £29.38
Median hourly rate £65.00 £32.12 £55.00
Median % change year-on-year +102.40% -41.61% +101.83%
75th Percentile - £34.32 £65.00
90th Percentile £81.78 £52.73 -
UK median hourly rate £65.00 £37.18 £52.50
% change year-on-year +74.83% -29.18% +61.54%

All General Skills
Work from Home

Presentation Skills falls under the General Skills category. For comparison with the information above, the following table provides summary statistics for all contract job vacancies with remote or hybrid options requiring common skills.

Contract vacancies with a requirement for common skills 6,181 8,910 14,926
As % of all contract jobs with a WFH option 62.47% 58.80% 58.44%
Number of daily rates quoted 4,170 5,842 10,512
10th Percentile £330 £325 £363
25th Percentile £415 £425 £450
Median daily rate (50th Percentile) £525 £535 £550
Median % change year-on-year -1.87% -2.73% +4.76%
75th Percentile £650 £650 £675
90th Percentile £800 £775 £775
UK median daily rate £525 £525 £550
% change year-on-year - -4.55% +2.33%
Number of hourly rates quoted 180 473 342
10th Percentile £14.00 £14.01 £19.01
25th Percentile £18.12 £22.61 £26.00
Median hourly rate £31.91 £38.12 £50.00
Median % change year-on-year -16.30% -23.76% +56.99%
75th Percentile £64.81 £53.00 £67.50
90th Percentile £86.00 £72.50 £80.25
UK median hourly rate £27.50 £30.00 £32.50
% change year-on-year -8.33% -7.69% +47.73%

Presentation Skills
Trend for Jobs with a WFH Option

Job vacancies with remote working options citing Presentation Skills as a proportion of all IT jobs advertised.
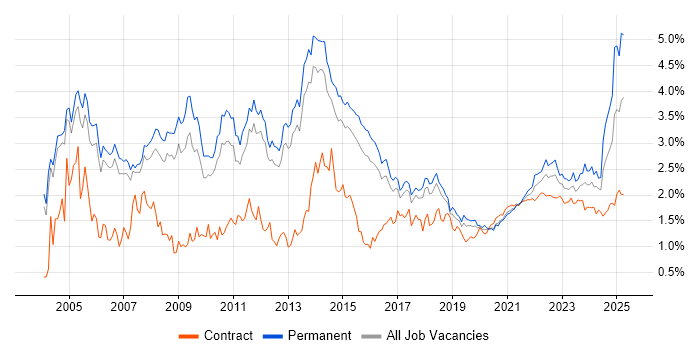
Presentation Skills trend for jobs with Hybrid/Remote/WFH options

Presentation Skills
Daily Rate Trend for Jobs with a WFH Option

3-month moving average daily rate quoted in job vacancies with remote working options citing Presentation Skills.

Presentation Skills daily rate for jobs with a WFH option

Presentation Skills
Daily Rate Histogram for Jobs with a WFH Option

Daily rate distribution for jobs with remote working options citing Presentation Skills over the 6 months to 6 May 2025.

Presentation Skills daily rate histogram for jobs with a WFH option

Presentation Skills
Hourly Rate Trend for Jobs with a WFH Option

3-month moving average hourly rate quoted in job vacancies with remote working options citing Presentation Skills.

Presentation Skills hourly rate for jobs with a WFH option

Presentation Skills
Hourly Rate Histogram for Jobs with a WFH Option

Hourly rate distribution for jobs with remote working options citing Presentation Skills over the 6 months to 6 May 2025.

Presentation Skills hourly rate histogram for jobs with a WFH option

Presentation Skills
Co-occurring Skills and Capabilities with WFH Options by Category

The follow tables expand on the table above by listing co-occurrences grouped by category. The same employment type, locality and period is covered with up to 20 co-occurrences shown in each of the following categories:

Application Platforms
1 9 (4.50%) SharePoint
2 5 (2.50%) Confluence
Applications
1 24 (12.00%) Microsoft PowerPoint
2 19 (9.50%) Microsoft Office
2 19 (9.50%) MS Visio
3 18 (9.00%) Microsoft Excel
4 7 (3.50%) Microsoft Project
5 1 (0.50%) Adobe After Effects
5 1 (0.50%) Adobe Illustrator
5 1 (0.50%) Chatbot
5 1 (0.50%) InfoPath
5 1 (0.50%) InVision
5 1 (0.50%) Photoshop
5 1 (0.50%) UserZoom
Business Applications
1 6 (3.00%) SAP S/4HANA
2 4 (2.00%) CA PPM
3 3 (1.50%) SAP MDG
3 3 (1.50%) SAP Retail
4 2 (1.00%) Dynamics CRM
4 2 (1.00%) Payment Gateway
4 2 (1.00%) Salesforce CRM
4 2 (1.00%) SAP CAR
4 2 (1.00%) SAP CO
4 2 (1.00%) SAP FI
4 2 (1.00%) SAP FI/CO
4 2 (1.00%) SAP IBP
4 2 (1.00%) SAP MM
4 2 (1.00%) Workfront
5 1 (0.50%) Oracle Assets
5 1 (0.50%) Oracle Cash Management
5 1 (0.50%) Oracle General Ledger
5 1 (0.50%) Oracle Payables
5 1 (0.50%) Oracle Receivables
5 1 (0.50%) Primavera
Cloud Services
1 30 (15.00%) Azure
2 23 (11.50%) Power Platform
3 20 (10.00%) AWS
4 11 (5.50%) GCP
5 9 (4.50%) Microsoft 365
6 7 (3.50%) Amazon Kinesis
6 7 (3.50%) Amazon S3
6 7 (3.50%) Serverless
6 7 (3.50%) Snowflake
7 6 (3.00%) AWS Lambda
8 5 (2.50%) PowerApps
9 4 (2.00%) Amazon CloudWatch
9 4 (2.00%) Amazon Glacier
9 4 (2.00%) Entra ID
9 4 (2.00%) IaaS
9 4 (2.00%) IBM Blueworks
9 4 (2.00%) SaaS
10 3 (1.50%) Amazon EMR
10 3 (1.50%) Azure Cosmos DB
10 3 (1.50%) Azure Synapse Analytics
Communications & Networking
1 6 (3.00%) Firewall
2 4 (2.00%) Ethernet
2 4 (2.00%) TCP/IP
3 3 (1.50%) Intrusion Detection
4 1 (0.50%) LAN
4 1 (0.50%) Network Security
4 1 (0.50%) SAN
4 1 (0.50%) SSL
4 1 (0.50%) Wireless
4 1 (0.50%) WLAN
Database & Business Intelligence
1 19 (9.50%) Power BI
2 8 (4.00%) Data Warehouse
3 6 (3.00%) Relational Database
3 6 (3.00%) Tableau
4 4 (2.00%) Data Lake
4 4 (2.00%) DynamoDB
5 3 (1.50%) Amazon Redshift
5 3 (1.50%) Azure SQL Database
5 3 (1.50%) NoSQL
6 2 (1.00%) Big Data
6 2 (1.00%) PostgreSQL
6 2 (1.00%) RDBMS
7 1 (0.50%) Amazon Athena
7 1 (0.50%) Amazon RDS
7 1 (0.50%) DB2
7 1 (0.50%) Informix
7 1 (0.50%) MySQL
7 1 (0.50%) Oracle Reports
7 1 (0.50%) SQL Server
Development Applications
1 9 (4.50%) JIRA
2 7 (3.50%) Jenkins
3 4 (2.00%) Eclipse
3 4 (2.00%) Visual Studio
4 3 (1.50%) Hudson
5 1 (0.50%) Axure RP
5 1 (0.50%) CMake
5 1 (0.50%) ERwin
5 1 (0.50%) Git
5 1 (0.50%) GitLab
5 1 (0.50%) MLflow
5 1 (0.50%) Selenium
5 1 (0.50%) SpecFlow
5 1 (0.50%) Zephyr
General
1 140 (70.00%) Social Skills
2 55 (27.50%) Finance
3 29 (14.50%) Analytical Skills
4 16 (8.00%) Public Sector
5 15 (7.50%) Marketing
6 14 (7.00%) Documentation Skills
7 10 (5.00%) Influencing Skills
8 8 (4.00%) Banking
9 7 (3.50%) Manufacturing
9 7 (3.50%) Organisational Skills
10 6 (3.00%) Retail
11 5 (2.50%) Arabic Language
11 5 (2.50%) General Ledger
11 5 (2.50%) Legal
12 4 (2.00%) Automotive
12 4 (2.00%) Czech Language
12 4 (2.00%) Military
13 3 (1.50%) Advertising
13 3 (1.50%) Back Office
13 3 (1.50%) Pharmaceutical
Job Titles
1 44 (22.00%) Analyst
2 35 (17.50%) Architect
3 26 (13.00%) Solutions Architect
4 17 (8.50%) Lead
4 17 (8.50%) Senior
5 16 (8.00%) Consultant
6 15 (7.50%) Business Analyst
7 13 (6.50%) Project Manager
8 10 (5.00%) Technical Architect
8 10 (5.00%) Technical Solutions Architect
9 8 (4.00%) Developer
9 8 (4.00%) Integration Architect
10 7 (3.50%) Cybersecurity Analyst
10 7 (3.50%) Data Analyst
10 7 (3.50%) Report Analyst
11 6 (3.00%) Insurance Business Analyst
11 6 (3.00%) Security Analyst
12 5 (2.50%) Change Analyst
12 5 (2.50%) Support Analyst
12 5 (2.50%) Trainer
Libraries, Frameworks & Software Standards
1 7 (3.50%) Kafka
1 7 (3.50%) RESTful
2 5 (2.50%) HTML
2 5 (2.50%) Web Services
3 4 (2.00%) ActiveMQ
3 4 (2.00%) CSS
3 4 (2.00%) Node.js
4 3 (1.50%) .NET
5 2 (1.00%) .NET Framework
5 2 (1.00%) ADO
5 2 (1.00%) AngularJS
5 2 (1.00%) Lightning Web Components
5 2 (1.00%) PyTorch
5 2 (1.00%) SAP Fiori
5 2 (1.00%) TensorFlow
6 1 (0.50%) CNTK
6 1 (0.50%) GraphQL
6 1 (0.50%) OpenTelemetry
6 1 (0.50%) OpenVINO
6 1 (0.50%) RxJS
Miscellaneous
1 13 (6.50%) Management Information System
2 10 (5.00%) Operational Technology
3 9 (4.50%) Product Ownership
4 8 (4.00%) Security Posture
5 6 (3.00%) Onboarding
6 5 (2.50%) NHS
6 5 (2.50%) PMI
6 5 (2.50%) Public Cloud
7 4 (2.00%) Cloud Native
7 4 (2.00%) Cyber Security Posture
7 4 (2.00%) Greenfield Project
8 3 (1.50%) Digital Media
8 3 (1.50%) Enterprise Software
8 3 (1.50%) Life Science
8 3 (1.50%) Reference Data
8 3 (1.50%) Security Operations Centre
8 3 (1.50%) Self-Motivation
9 2 (1.00%) CMDB
9 2 (1.00%) Motion Graphics
9 2 (1.00%) Social Media
Operating Systems
1 10 (5.00%) Linux
2 9 (4.50%) Windows
3 3 (1.50%) Android
4 2 (1.00%) Apple iOS
5 1 (0.50%) Data ONTAP
5 1 (0.50%) Unix
5 1 (0.50%) Windows Server
Processes & Methodologies
1 58 (29.00%) Agile
2 52 (26.00%) Problem-Solving
3 38 (19.00%) Stakeholder Management
4 29 (14.50%) Analytics
5 28 (14.00%) Project Management
6 26 (13.00%) Roadmaps
7 24 (12.00%) Decision-Making
8 22 (11.00%) Business Intelligence
8 22 (11.00%) CI/CD
8 22 (11.00%) Cybersecurity
9 19 (9.50%) Change Management
10 18 (9.00%) Project Delivery
11 17 (8.50%) Collaborative Working
11 17 (8.50%) Workshop Facilitation
12 15 (7.50%) User Acceptance Testing
13 14 (7.00%) Continuous Improvement
13 14 (7.00%) Data Analysis
13 14 (7.00%) Migration
13 14 (7.00%) Scaled Agile Framework
13 14 (7.00%) Visualisation
Programming Languages
1 24 (12.00%) SQL
2 21 (10.50%) Python
3 17 (8.50%) Java
4 10 (5.00%) JavaScript
5 6 (3.00%) C#
6 5 (2.50%) C++
7 4 (2.00%) Bicep
8 2 (1.00%) Bash
8 2 (1.00%) PowerShell
8 2 (1.00%) Scala
9 1 (0.50%) Apex Code
9 1 (0.50%) Korn
9 1 (0.50%) Kusto Query Language
9 1 (0.50%) Perl
9 1 (0.50%) PHP
9 1 (0.50%) R
9 1 (0.50%) TypeScript
9 1 (0.50%) VB
Qualifications
1 38 (19.00%) Degree
2 29 (14.50%) Security Cleared
3 25 (12.50%) SC Cleared
4 14 (7.00%) Master's Degree
5 9 (4.50%) PMI Certification
6 7 (3.50%) CISSP
7 6 (3.00%) Computer Science Degree
8 5 (2.50%) CISM
8 5 (2.50%) ITIL Certification
9 4 (2.00%) CISA
9 4 (2.00%) Microsoft Certification
9 4 (2.00%) PhD
9 4 (2.00%) PMP
10 3 (1.50%) Cisco Certification
10 3 (1.50%) DV Cleared
11 2 (1.00%) AWS Certification
11 2 (1.00%) AWS Certified Solutions Architect
11 2 (1.00%) BPSS Clearance
11 2 (1.00%) CCNA
11 2 (1.00%) CEH
Quality Assurance & Compliance
1 15 (7.50%) PMO
2 6 (3.00%) Data Quality
2 6 (3.00%) NIST
3 5 (2.50%) Accessibility
4 4 (2.00%) Disclosure Scotland
4 4 (2.00%) QA
5 3 (1.50%) Actionable Recommendations
5 3 (1.50%) GDPR
5 3 (1.50%) GRC
5 3 (1.50%) ISO/IEC 27001
6 2 (1.00%) NIST 800
7 1 (0.50%) EMIR
7 1 (0.50%) HIPAA
7 1 (0.50%) IFRS
7 1 (0.50%) IFRS 17
7 1 (0.50%) MiFID
7 1 (0.50%) PCI DSS
7 1 (0.50%) Sarbanes-Oxley
7 1 (0.50%) SOC 2
7 1 (0.50%) Solvency II
System Software
1 8 (4.00%) Docker
2 2 (1.00%) VMware Infrastructure
3 1 (0.50%) Tivoli Workload Scheduler
3 1 (0.50%) VMware NSX
Systems Management
1 7 (3.50%) Kubernetes
2 3 (1.50%) Terraform
3 2 (1.00%) Prometheus
4 1 (0.50%) Active Directory Federation Services
4 1 (0.50%) Grafana
4 1 (0.50%) Kibana
4 1 (0.50%) Kubeflow
4 1 (0.50%) Nagios
4 1 (0.50%) QRadar
4 1 (0.50%) TADDM
4 1 (0.50%) Tivoli
4 1 (0.50%) VxRail
Vendors
1 49 (24.50%) Microsoft
2 17 (8.50%) SAP
3 8 (4.00%) ServiceNow
4 6 (3.00%) IBM
5 5 (2.50%) Oracle
5 5 (2.50%) Salesforce
6 4 (2.00%) Broadcom
7 3 (1.50%) Cisco
7 3 (1.50%) Databricks
7 3 (1.50%) IFS
7 3 (1.50%) VMware
8 2 (1.00%) Google
8 2 (1.00%) OneTrust
8 2 (1.00%) Splunk
9 1 (0.50%) Atlassian
9 1 (0.50%) CA Agile Central
9 1 (0.50%) Dynatrace
9 1 (0.50%) Palo Alto
9 1 (0.50%) Qualys
9 1 (0.50%) Ribbon