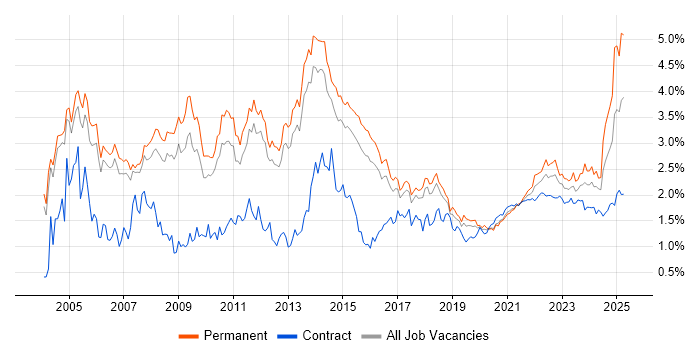
Presentation Skills Jobs with Hybrid/Remote/WFH Options

Presentation Skills
UK > Work from Home

The table below looks at the prevalence of the term Presentation Skills in remote or hybrid work. Included is a benchmarking guide to the salaries offered in vacancies that cited Presentation Skills over the 6 months leading up to 6 July 2025, comparing them to the same period in the previous two years.

6 months to
6 Jul 2025
Same period 2024 Same period 2023
Rank 78 131 150
Rank change year-on-year +53 +19 +8
Permanent jobs citing Presentation Skills 856 799 830
As % of all permanent jobs with a WFH option 4.15% 2.35% 2.30%
As % of the General category 5.41% 3.86% 3.54%
Number of salaries quoted 557 393 422
10th Percentile £40,000 £34,295 £41,325
25th Percentile - £42,500 £50,000
Median annual salary (50th Percentile) £47,683 £55,500 £65,000
Median % change year-on-year -14.08% -14.62% +8.33%
75th Percentile £48,750 £70,000 £85,000
90th Percentile £81,250 £84,964 £99,300
UK median annual salary £47,683 £55,000 £65,000
% change year-on-year -13.30% -15.38% +8.33%

All General Skills
Work from Home

Presentation Skills falls under the General Skills category. For comparison with the information above, the following table provides summary statistics for all permanent job vacancies with remote or hybrid options requiring common skills.

Permanent vacancies with a requirement for common skills 15,837 20,688 23,478
As % of all permanent jobs with a WFH option 76.78% 60.80% 65.09%
Number of salaries quoted 8,034 14,635 16,604
10th Percentile £25,087 £31,250 £36,250
25th Percentile £33,750 £41,252 £46,350
Median annual salary (50th Percentile) £55,000 £55,000 £62,500
Median % change year-on-year - -12.00% +4.17%
75th Percentile £75,000 £75,772 £82,500
90th Percentile £102,500 £97,500 £103,750
UK median annual salary £54,793 £52,500 £60,000
% change year-on-year +4.37% -12.50% -

Presentation Skills
Trend for Jobs with a WFH Option

Job vacancies with remote working options citing Presentation Skills as a proportion of all IT jobs advertised.

Presentation Skills trend for jobs with Hybrid/Remote/WFH options

Presentation Skills
Salary Trend for Jobs with a WFH Option

3-month moving average salary quoted in job vacancies with remote working options citing Presentation Skills.

Presentation Skills salary trend for jobs with a WFH option

Presentation Skills
Salary Histogram for Jobs with a WFH Option

Salary distribution for jobs with remote working options citing Presentation Skills over the 6 months to 6 July 2025.

Presentation Skills salary histogram for jobs with a WFH option

Presentation Skills
Co-occurring Skills and Capabilities with WFH Options by Category

The follow tables expand on the table above by listing co-occurrences grouped by category. The same employment type, locality and period is covered with up to 20 co-occurrences shown in each of the following categories:

Application Platforms
1 14 (1.64%) Microsoft Exchange
2 10 (1.17%) SharePoint
3 9 (1.05%) IIS
3 9 (1.05%) Tomcat
4 3 (0.35%) Apache Spark
5 2 (0.23%) Oracle Workflow
6 1 (0.12%) CMS
6 1 (0.12%) Confluence
6 1 (0.12%) Drupal
6 1 (0.12%) Moodle
6 1 (0.12%) Oracle SOA Suite
6 1 (0.12%) Totara
Applications
1 60 (7.01%) Microsoft Office
2 38 (4.44%) Microsoft Excel
3 36 (4.21%) Microsoft PowerPoint
4 10 (1.17%) Microsoft Project
5 7 (0.82%) MS Visio
6 4 (0.47%) Adobe XD
6 4 (0.47%) Spreadsheet
7 2 (0.23%) AutoCAD
7 2 (0.23%) Oracle Smart View
7 2 (0.23%) Simulink
7 2 (0.23%) Sketch
8 1 (0.12%) Adobe Illustrator
Business Applications
1 7 (0.82%) Salesforce CRM
2 5 (0.58%) CA PPM
2 5 (0.58%) Oracle ERP
3 4 (0.47%) Oracle Cash Management
3 4 (0.47%) Oracle General Ledger
3 4 (0.47%) Oracle Payables
3 4 (0.47%) Oracle Receivables
4 3 (0.35%) Dynamics CRM
4 3 (0.35%) Unit4 Business World
5 2 (0.23%) Oracle Assets
5 2 (0.23%) Oracle Financials
6 1 (0.12%) Carpe Diem
6 1 (0.12%) Dynamics GP
6 1 (0.12%) Elite 3E
6 1 (0.12%) FastStats
6 1 (0.12%) FastStats PeopleStage
6 1 (0.12%) SAP APO
6 1 (0.12%) SAP IBP
6 1 (0.12%) Sparx Enterprise Architect
6 1 (0.12%) Teamcenter
Cloud Services
1 58 (6.78%) SaaS
2 30 (3.50%) Azure
3 24 (2.80%) Power Platform
4 23 (2.69%) Microsoft 365
5 22 (2.57%) Power Automate
6 18 (2.10%) AWS
7 17 (1.99%) Microsoft Copilot
8 16 (1.87%) Entra ID
9 13 (1.52%) Dynamics 365
10 12 (1.40%) Azure DevOps
11 9 (1.05%) Google Analytics
11 9 (1.05%) OneDrive
12 8 (0.93%) Microsoft Purview
12 8 (0.93%) PowerApps
13 7 (0.82%) Figma
14 6 (0.70%) GCP
14 6 (0.70%) Smartsheet
15 5 (0.58%) Adobe Analytics
15 5 (0.58%) GitHub
15 5 (0.58%) OCI
Communications & Networking
1 45 (5.26%) Broadband
2 35 (4.09%) Ethernet
3 34 (3.97%) Wi-Fi
4 12 (1.40%) WAN
5 11 (1.29%) 5G
5 11 (1.29%) SD-WAN
6 9 (1.05%) DMARC
6 9 (1.05%) SSL
7 6 (0.70%) TCP/IP
8 5 (0.58%) DNS
8 5 (0.58%) IP Telephony
8 5 (0.58%) Network Security
9 4 (0.47%) HTTP
9 4 (0.47%) Internet
9 4 (0.47%) SMTP
10 3 (0.35%) Intranet
11 2 (0.23%) Modbus
11 2 (0.23%) Profibus
12 1 (0.12%) SAN
12 1 (0.12%) Unified Communications
Database & Business Intelligence
1 32 (3.74%) Tableau
2 16 (1.87%) Power BI
3 12 (1.40%) PostgreSQL
4 10 (1.17%) SQL Server
5 4 (0.47%) Data Warehouse
5 4 (0.47%) Oracle Database
5 4 (0.47%) Relational Database
6 3 (0.35%) Amazon Athena
6 3 (0.35%) Looker
6 3 (0.35%) Parquet
6 3 (0.35%) Spark SQL
7 2 (0.23%) Azure SQL Database
7 2 (0.23%) Data Lake
7 2 (0.23%) Data Mining
7 2 (0.23%) Metadata
7 2 (0.23%) RDBMS
8 1 (0.12%) GIS
8 1 (0.12%) NonStop SQL
8 1 (0.12%) Power Query
Development Applications
1 28 (3.27%) Git
2 12 (1.40%) JIRA
3 6 (0.70%) GitLab
4 4 (0.47%) Subversion
5 3 (0.35%) Axure RP
5 3 (0.35%) Balsamiq
5 3 (0.35%) Jenkins
General
1 302 (35.28%) Social Skills
2 130 (15.19%) Finance
3 94 (10.98%) Analytical Skills
4 79 (9.23%) Marketing
5 57 (6.66%) Telecoms
6 52 (6.07%) Retail
7 30 (3.50%) Organisational Skills
8 27 (3.15%) Inclusion and Diversity
8 27 (3.15%) Law
9 26 (3.04%) Legal
10 22 (2.57%) Influencing Skills
11 20 (2.34%) Public Sector
12 14 (1.64%) Czech Language
13 10 (1.17%) Electronics
14 9 (1.05%) Back Office
15 8 (0.93%) Billing
16 7 (0.82%) Military
17 6 (0.70%) Advertising
17 6 (0.70%) Games
17 6 (0.70%) Publishing
Job Titles
1 439 (51.29%) Systems Engineer
2 100 (11.68%) Senior
3 79 (9.23%) Development Manager
4 78 (9.11%) Business Development Manager
4 78 (9.11%) Business Manager
5 55 (6.43%) Analyst
6 45 (5.26%) Consultant
7 27 (3.15%) IT Manager
8 26 (3.04%) Data Analyst
9 22 (2.57%) IT Development Manager
10 21 (2.45%) Senior Analyst
10 21 (2.45%) Senior Manager
11 20 (2.34%) Lead
12 17 (1.99%) IT Services Manager
12 17 (1.99%) New Business Development Manager
13 15 (1.75%) Administrator
14 14 (1.64%) Business Analyst
14 14 (1.64%) Project Manager
15 13 (1.52%) Product Manager
16 12 (1.40%) Senior Data Analyst
Libraries, Frameworks & Software Standards
1 14 (1.64%) REST
2 11 (1.29%) SOAP
3 10 (1.17%) JSON
4 9 (1.05%) XML
5 6 (0.70%) CSS
5 6 (0.70%) HTML
6 3 (0.35%) PySpark
6 3 (0.35%) XGBoost
7 2 (0.23%) Oracle Fusion
8 1 (0.12%) AngularJS
8 1 (0.12%) Django
8 1 (0.12%) Flask
8 1 (0.12%) Kafka
8 1 (0.12%) React
8 1 (0.12%) Vue
Miscellaneous
1 48 (5.61%) Social Media
2 47 (5.49%) Self-Motivation
3 28 (3.27%) Enterprise Software
4 20 (2.34%) Management Information System
5 15 (1.75%) GNSS
5 15 (1.75%) Product Ownership
6 12 (1.40%) FPGA
7 11 (1.29%) Onboarding
7 11 (1.29%) Self-Driving Car
8 8 (0.93%) Data Centre
9 7 (0.82%) Algorithms
10 6 (0.70%) PMI
11 5 (0.58%) NHS
11 5 (0.58%) Private Cloud
11 5 (0.58%) Tandem
12 4 (0.47%) Analytical Mindset
12 4 (0.47%) Derivative
12 4 (0.47%) Foreign Exchange (FX)
12 4 (0.47%) MicroBlaze
13 3 (0.35%) Educational Technology
Operating Systems
1 23 (2.69%) Windows
2 22 (2.57%) Linux
3 16 (1.87%) Unix
4 4 (0.47%) Windows Server
5 3 (0.35%) Red Hat Enterprise Linux
6 2 (0.23%) Android
6 2 (0.23%) Apple iOS
6 2 (0.23%) Mac OS
6 2 (0.23%) Windows Server 2016
Processes & Methodologies
1 530 (61.92%) Agile
2 460 (53.74%) Cybersecurity
3 442 (51.64%) UML
4 439 (51.29%) MODAF
4 439 (51.29%) Systems Engineering
5 437 (51.05%) SysML
6 115 (13.43%) Problem-Solving
7 105 (12.27%) CRM
8 91 (10.63%) Business Development
9 77 (9.00%) Project Management
10 76 (8.88%) B2B
11 67 (7.83%) Lead Generation
12 66 (7.71%) Decision-Making
13 57 (6.66%) Analytics
13 57 (6.66%) B2B Sales
14 56 (6.54%) Stakeholder Management
15 53 (6.19%) Roadmaps
16 49 (5.72%) Mentoring
17 46 (5.37%) Contract Negotiation
18 42 (4.91%) Presales
Programming Languages
1 446 (52.10%) MATLAB
2 59 (6.89%) SQL
3 50 (5.84%) Python
4 16 (1.87%) JavaScript
5 13 (1.52%) C++
6 12 (1.40%) Java
7 9 (1.05%) PowerShell
7 9 (1.05%) VBA
8 6 (0.70%) C
9 5 (0.58%) Bash
10 2 (0.23%) Fortran
10 2 (0.23%) Go
10 2 (0.23%) Shell Script
11 1 (0.12%) COBOL
11 1 (0.12%) Data Analysis Expressions
11 1 (0.12%) PHP
11 1 (0.12%) R
Qualifications
1 536 (62.62%) Degree
2 437 (51.05%) BPSS Clearance
3 34 (3.97%) DBS Check
4 31 (3.62%) Security Cleared
5 23 (2.69%) Master's Degree
6 20 (2.34%) MRICS
7 18 (2.10%) SC Cleared
8 12 (1.40%) ACCA
8 12 (1.40%) CIMA
9 11 (1.29%) DV Cleared
10 8 (0.93%) Microsoft Certification
10 8 (0.93%) PMI Certification
11 6 (0.70%) Computer Science Degree
12 5 (0.58%) MBA
13 4 (0.47%) Chartered Engineer
14 3 (0.35%) ITIL Certification
14 3 (0.35%) PMP
15 2 (0.23%) Azure Certification
15 2 (0.23%) CTC Cleared
15 2 (0.23%) PhD
Quality Assurance & Compliance
1 21 (2.45%) PMO
2 15 (1.75%) QA
3 9 (1.05%) ISO/IEC 27001
4 8 (0.93%) Data Quality
4 8 (0.93%) SLA
5 6 (0.70%) Accessibility
6 5 (0.58%) P3O
7 4 (0.47%) GRC
8 3 (0.35%) WCAG
9 2 (0.23%) IEC 61131
10 1 (0.12%) Actionable Recommendations
10 1 (0.12%) COBIT
10 1 (0.12%) GAAP
10 1 (0.12%) GMP
10 1 (0.12%) ISO 15022
10 1 (0.12%) ISO 20022
10 1 (0.12%) NEBOSH
System Software
1 12 (1.40%) Firmware
2 10 (1.17%) Active Directory
3 4 (0.47%) Docker
3 4 (0.47%) Embedded Firmware
4 2 (0.23%) Veritas Cluster Server
5 1 (0.12%) VMware Infrastructure
Systems Management
1 16 (1.87%) Microsoft Intune
2 9 (1.05%) Single Sign-On
3 5 (0.58%) Automic
4 3 (0.35%) Active Directory Federation Services
4 3 (0.35%) Kibana
4 3 (0.35%) Kubernetes
4 3 (0.35%) Nagios
4 3 (0.35%) Prometheus
5 2 (0.23%) Ansible
6 1 (0.12%) SCCM
Vendors
1 100 (11.68%) Microsoft
2 56 (6.54%) Salesforce
3 29 (3.39%) Oracle
4 24 (2.80%) Databricks
5 22 (2.57%) Adobe
6 17 (1.99%) Google
7 10 (1.17%) TikTok
8 9 (1.05%) SAP
9 7 (0.82%) HubSpot
9 7 (0.82%) ServiceNow
10 6 (0.70%) Broadcom
11 5 (0.58%) Pegasus
11 5 (0.58%) Planview
11 5 (0.58%) VMware
12 4 (0.47%) Omniture
13 3 (0.35%) Commvault
13 3 (0.35%) Informatica
13 3 (0.35%) Red Hat
13 3 (0.35%) Salesforce Marketing Cloud
13 3 (0.35%) Splunk