Risk Management Contracts with Hybrid/Remote/WFH Options

Risk Management
UK > Work from Home

The table below provides summary statistics for remote or hybrid contract work requiring Risk Management skills. It includes a benchmarking guide to the contractor rates offered in vacancies that cited Risk Management over the 6 months leading up to 5 May 2025, comparing them to the same period in the previous two years.

6 months to
5 May 2025
Same period 2024 Same period 2023
Rank 62 66 94
Rank change year-on-year +4 +28 +13
Contract jobs citing Risk Management 353 458 638
As % of all contract jobs with a WFH option 3.60% 3.02% 2.50%
As % of the Processes & Methodologies category 3.95% 3.44% 2.78%
Number of daily rates quoted 227 314 435
10th Percentile £371 £352 £400
25th Percentile £450 £450 £475
Median daily rate (50th Percentile) £575 £543 £600
Median % change year-on-year +5.99% -9.58% +9.09%
75th Percentile £744 £666 £738
90th Percentile £875 £818 £838
UK median daily rate £575 £550 £600
% change year-on-year +4.55% -8.33% +9.09%
Number of hourly rates quoted 6 17 15
10th Percentile £50.00 £35.00 £39.57
25th Percentile £63.75 £51.25 £40.43
Median hourly rate £79.25 £60.00 £60.00
Median % change year-on-year +32.08% - +14.33%
75th Percentile £86.60 - £78.13
90th Percentile £87.05 £71.87 £87.50
UK median hourly rate £64.00 £50.00 £10.63
% change year-on-year +28.00% +370.37% -59.89%

All Process and Methodology Skills
Work from Home

Risk Management falls under the Processes and Methodologies category. For comparison with the information above, the following table provides summary statistics for all contract job vacancies with remote or hybrid options requiring process or methodology skills.

Contract vacancies with a requirement for process or methodology skills 8,943 13,319 22,924
As % of all contract jobs with a WFH option 91.20% 87.90% 89.76%
Number of daily rates quoted 6,147 8,917 16,193
10th Percentile £340 £325 £363
25th Percentile £419 £425 £450
Median daily rate (50th Percentile) £525 £525 £540
Median % change year-on-year - -2.78% +2.86%
75th Percentile £638 £638 £650
90th Percentile £763 £750 £750
UK median daily rate £520 £525 £550
% change year-on-year -0.95% -4.55% +3.77%
Number of hourly rates quoted 223 575 527
10th Percentile £13.92 £15.17 £18.67
25th Percentile £19.00 £24.63 £30.00
Median hourly rate £39.04 £42.50 £55.00
Median % change year-on-year -8.14% -22.73% +57.14%
75th Percentile £67.00 £60.00 £68.75
90th Percentile £75.00 £75.15 £80.25
UK median hourly rate £29.00 £35.95 £35.80
% change year-on-year -19.33% +0.42% +43.20%

Risk Management
Trend for Jobs with a WFH Option

Job vacancies with remote working options citing Risk Management as a proportion of all IT jobs advertised.
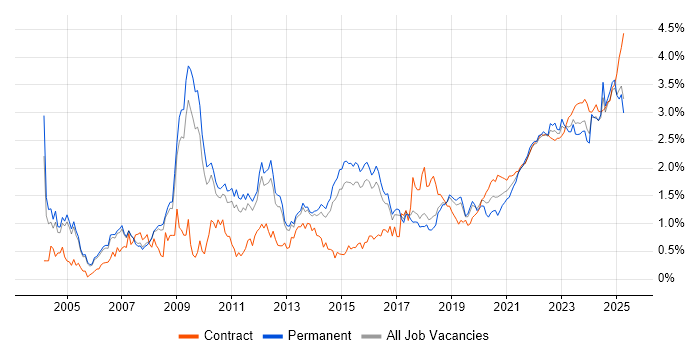
Risk Management trend for jobs with Hybrid/Remote/WFH options

Risk Management
Daily Rate Trend for Jobs with a WFH Option

3-month moving average daily rate quoted in job vacancies with remote working options citing Risk Management.

Risk Management daily rate for jobs with a WFH option

Risk Management
Daily Rate Histogram for Jobs with a WFH Option

Daily rate distribution for jobs with remote working options citing Risk Management over the 6 months to 5 May 2025.

Risk Management daily rate histogram for jobs with a WFH option

Risk Management
Hourly Rate Trend for Jobs with a WFH Option

3-month moving average hourly rate quoted in job vacancies with remote working options citing Risk Management.

Risk Management hourly rate for jobs with a WFH option

Risk Management
Hourly Rate Histogram for Jobs with a WFH Option

Hourly rate distribution for jobs with remote working options citing Risk Management over the 6 months to 5 May 2025.

Risk Management hourly rate histogram for jobs with a WFH option

Risk Management
Co-occurring Skills and Capabilities with WFH Options by Category

The follow tables expand on the table above by listing co-occurrences grouped by category. The same employment type, locality and period is covered with up to 20 co-occurrences shown in each of the following categories:

Application Platforms
1 17 (4.82%) Apache Airflow
2 8 (2.27%) SharePoint
3 6 (1.70%) Confluence
4 5 (1.42%) Microsoft Exchange
5 2 (0.57%) SAS
6 1 (0.28%) Apache Spark
6 1 (0.28%) ArcGIS
6 1 (0.28%) JBoss
6 1 (0.28%) WebSphere
Applications
1 14 (3.97%) Microsoft Project
2 8 (2.27%) Microsoft Excel
2 8 (2.27%) Microsoft Office
3 7 (1.98%) Microsoft PowerPoint
4 2 (0.57%) MS Visio
5 1 (0.28%) Revit
Business Applications
1 13 (3.68%) Endur
2 8 (2.27%) SAP S/4HANA
3 5 (1.42%) Dynamics CRM
4 4 (1.13%) SAP Oil and Gas
5 2 (0.57%) Actimize
5 2 (0.57%) NEC Housing
5 2 (0.57%) OPENHousing
5 2 (0.57%) Oracle ERP
5 2 (0.57%) Oracle General Ledger
5 2 (0.57%) Primavera
5 2 (0.57%) SAP GRC
6 1 (0.28%) Kondor
6 1 (0.28%) Oracle Assets
6 1 (0.28%) Oracle Cash Management
6 1 (0.28%) Oracle Financials
6 1 (0.28%) Oracle Payables
6 1 (0.28%) Oracle Receivables
6 1 (0.28%) SAP EHS
6 1 (0.28%) SAP FSCM
6 1 (0.28%) SAP PM
Cloud Services
1 50 (14.16%) Azure
2 46 (13.03%) AWS
3 30 (8.50%) GCP
4 17 (4.82%) dbt
5 9 (2.55%) Cloud Computing
5 9 (2.55%) Microsoft 365
5 9 (2.55%) Power Platform
6 8 (2.27%) Azure Sentinel
7 7 (1.98%) Azure DevOps
8 6 (1.70%) Dynamics 365
8 6 (1.70%) SaaS
9 5 (1.42%) Entra ID
9 5 (1.42%) Power Automate
10 4 (1.13%) PowerApps
11 3 (0.85%) Azure AKS
11 3 (0.85%) Snowflake
12 2 (0.57%) Apigee
12 2 (0.57%) AWS CloudFormation
12 2 (0.57%) Azure Key Vault
12 2 (0.57%) Virtual Private Cloud
Communications & Networking
1 15 (4.25%) Firewall
2 7 (1.98%) Network Security
3 3 (0.85%) 5G
3 3 (0.85%) LAN
3 3 (0.85%) VPN
3 3 (0.85%) WAN
4 2 (0.57%) BGP
4 2 (0.57%) Cisco ISE
4 2 (0.57%) DNS
4 2 (0.57%) Internet
4 2 (0.57%) Intrusion Detection
4 2 (0.57%) S/MIME
4 2 (0.57%) SD-WAN
4 2 (0.57%) SSL
4 2 (0.57%) TCP/IP
5 1 (0.28%) HTTP
5 1 (0.28%) OSPF
5 1 (0.28%) Structured Cabling
5 1 (0.28%) Wi-Fi
5 1 (0.28%) Wireless
Database & Business Intelligence
1 22 (6.23%) PostgreSQL
2 17 (4.82%) Amazon Athena
2 17 (4.82%) Apache Arrow
2 17 (4.82%) Apache Iceberg
2 17 (4.82%) Dremio
3 13 (3.68%) SQL Server
4 9 (2.55%) Power BI
5 6 (1.70%) Data Warehouse
6 5 (1.42%) SQL Server Reporting Services
7 4 (1.13%) Relational Database
7 4 (1.13%) SQL Server Integration Services
8 3 (0.85%) Data Mining
9 2 (0.57%) Amazon RDS
9 2 (0.57%) Data Lake
9 2 (0.57%) DataStage
9 2 (0.57%) Oracle Database
9 2 (0.57%) RDBMS
9 2 (0.57%) Tableau
10 1 (0.28%) Big Data
10 1 (0.28%) Looker
Development Applications
1 30 (8.50%) JIRA
2 3 (0.85%) Visual Studio
3 2 (0.57%) Git
3 2 (0.57%) JUnit
3 2 (0.57%) Selenium
4 1 (0.28%) Cucumber
4 1 (0.28%) GitLab
4 1 (0.28%) Jenkins
4 1 (0.28%) LoadRunner
4 1 (0.28%) MSTest
4 1 (0.28%) NUnit
4 1 (0.28%) Postman
4 1 (0.28%) Ranorex
4 1 (0.28%) SonarQube
4 1 (0.28%) Zephyr
General
1 149 (42.21%) Social Skills
2 132 (37.39%) Finance
3 60 (17.00%) Analytical Skills
4 58 (16.43%) Banking
5 28 (7.93%) Front Office
6 26 (7.37%) Investment Banking
6 26 (7.37%) Public Sector
7 19 (5.38%) Legal
8 16 (4.53%) Influencing Skills
9 11 (3.12%) Inclusion and Diversity
9 11 (3.12%) Retail Banking
10 9 (2.55%) Presentation Skills
11 8 (2.27%) Local Government
11 8 (2.27%) Manufacturing
12 7 (1.98%) Telecoms
13 6 (1.70%) Law
13 6 (1.70%) Retail
14 5 (1.42%) Documentation Skills
14 5 (1.42%) Financial Institution
15 3 (0.85%) Agriculture
Job Titles
1 49 (13.88%) Project Manager
2 40 (11.33%) Developer
3 38 (10.76%) Analyst
4 35 (9.92%) Senior
5 34 (9.63%) Architect
6 33 (9.35%) Consultant
7 21 (5.95%) Lead
8 20 (5.67%) AWS Developer
8 20 (5.67%) IT Manager
9 19 (5.38%) Python Engineer
10 18 (5.10%) Programme Manager
11 17 (4.82%) AWS Engineer
11 17 (4.82%) AWS Software Engineer
11 17 (4.82%) Developer/Software Engineer
11 17 (4.82%) Python Developer
11 17 (4.82%) Software Engineer
12 14 (3.97%) Business Analyst
12 14 (3.97%) Security Consultant
13 13 (3.68%) Senior Manager
14 11 (3.12%) Test Manager
Libraries, Frameworks & Software Standards
1 19 (5.38%) React
2 17 (4.82%) AngularJS
2 17 (4.82%) Node.js
2 17 (4.82%) NumPy
2 17 (4.82%) Pandas
2 17 (4.82%) SciPy
2 17 (4.82%) Vue
3 8 (2.27%) REST
4 7 (1.98%) SailPoint
5 6 (1.70%) SOAP
5 6 (1.70%) Web Services
6 4 (1.13%) Kafka
7 3 (0.85%) .NET
7 3 (0.85%) XML
8 2 (0.57%) JSON
8 2 (0.57%) Murex MxML
8 2 (0.57%) Oracle Fusion
8 2 (0.57%) RFC 2544
8 2 (0.57%) TensorFlow
9 1 (0.28%) Elastic Stack
Miscellaneous
1 45 (12.75%) Management Information System
2 24 (6.80%) Fixed Income
3 15 (4.25%) Foreign Exchange (FX)
4 14 (3.97%) Security Posture
5 13 (3.68%) Equities
6 12 (3.40%) Derivative
7 11 (3.12%) Data Centre
7 11 (3.12%) Market Risk
8 9 (2.55%) Credit Risk
8 9 (2.55%) Operational Technology
9 8 (2.27%) Distributed Systems
9 8 (2.27%) Life Science
9 8 (2.27%) Product Ownership
10 7 (1.98%) Analytical Mindset
10 7 (1.98%) Onboarding
11 6 (1.70%) Data Protection Act
11 6 (1.70%) PMI
11 6 (1.70%) Renewable Energy
12 5 (1.42%) Greenfield Project
12 5 (1.42%) NHS
Operating Systems
1 11 (3.12%) Windows
2 7 (1.98%) Linux
3 4 (1.13%) Windows Server
4 3 (0.85%) Unix
5 2 (0.57%) Red Hat Enterprise Linux
6 1 (0.28%) Android
6 1 (0.28%) Apple iOS
6 1 (0.28%) Windows 10
6 1 (0.28%) Windows 7
6 1 (0.28%) Windows Server 2012
6 1 (0.28%) zOS
Processes & Methodologies
1 100 (28.33%) Agile
2 86 (24.36%) Stakeholder Management
3 85 (24.08%) Problem-Solving
4 82 (23.23%) Project Management
5 54 (15.30%) Stakeholder Engagement
6 45 (12.75%) Cybersecurity
7 40 (11.33%) Continuous Improvement
7 40 (11.33%) Information Security
8 37 (10.48%) Decision-Making
9 36 (10.20%) Project Delivery
10 33 (9.35%) Change Management
11 28 (7.93%) Computer Science
12 27 (7.65%) Scrum
13 26 (7.37%) Roadmaps
14 25 (7.08%) Analytics
14 25 (7.08%) Regulatory Compliance
15 24 (6.80%) Collaborative Culture
16 23 (6.52%) Fintech
16 23 (6.52%) ITIL
16 23 (6.52%) Migration
Programming Languages
1 45 (12.75%) Python
2 34 (9.63%) SQL
3 31 (8.78%) JavaScript
4 27 (7.65%) TypeScript
5 23 (6.52%) Java
6 11 (3.12%) PowerShell
7 8 (2.27%) C#
8 5 (1.42%) C++
9 3 (0.85%) Jython
10 2 (0.57%) Bash
10 2 (0.57%) PHP
10 2 (0.57%) VB
11 1 (0.28%) Assembly Language
11 1 (0.28%) CLIST
11 1 (0.28%) JCL
11 1 (0.28%) R
11 1 (0.28%) REXX
11 1 (0.28%) Ruby
11 1 (0.28%) Smalltalk
11 1 (0.28%) T-SQL
Qualifications
1 51 (14.45%) Degree
2 32 (9.07%) Security Cleared
3 27 (7.65%) SC Cleared
4 26 (7.37%) PMI Certification
5 25 (7.08%) PMP
6 22 (6.23%) CISSP
7 16 (4.53%) Computer Science Degree
8 15 (4.25%) CISM
8 15 (4.25%) Master's Degree
9 14 (3.97%) CISA
10 7 (1.98%) Azure Certification
11 6 (1.70%) CRISC
11 6 (1.70%) DV Cleared
12 5 (1.42%) CEH
12 5 (1.42%) Microsoft Certification
13 3 (0.85%) AWS Certification
13 3 (0.85%) Cisco Certification
13 3 (0.85%) ISO 27001 Lead Auditor
13 3 (0.85%) Numerate Degree
14 2 (0.57%) CCNP
Quality Assurance & Compliance
1 29 (8.22%) NIST
2 23 (6.52%) ISO/IEC 27001
3 22 (6.23%) GDPR
4 20 (5.67%) Sarbanes-Oxley
5 19 (5.38%) GRC
6 18 (5.10%) QA
7 12 (3.40%) PMO
8 11 (3.12%) COBIT
9 10 (2.83%) HIPAA
10 9 (2.55%) Data Quality
10 9 (2.55%) PCI DSS
11 7 (1.98%) MiFID
12 5 (1.42%) COSO
12 5 (1.42%) ITGC
13 4 (1.13%) Basel II
13 4 (1.13%) ISO/IEC 20000
13 4 (1.13%) NCSC
13 4 (1.13%) SOC 2
14 3 (0.85%) Basel III
14 3 (0.85%) EMIR
System Software
1 8 (2.27%) Active Directory
2 2 (0.57%) Docker
3 1 (0.28%) Time Sharing Option
3 1 (0.28%) VMware Infrastructure
Systems Management
1 6 (1.70%) Kubernetes
2 3 (0.85%) Amdocs OSS
2 3 (0.85%) HP ALM
3 2 (0.57%) Microsoft Intune
3 2 (0.57%) Terraform
4 1 (0.28%) FortiGate
4 1 (0.28%) HP Quality Center
4 1 (0.28%) Nessus
4 1 (0.28%) OMEGAMON
Vendors
1 36 (10.20%) Microsoft
2 21 (5.95%) SAP
3 19 (5.38%) ServiceNow
4 16 (4.53%) Oracle
5 6 (1.70%) Cisco
5 6 (1.70%) Google
5 6 (1.70%) OpenLink
6 5 (1.42%) Qualys
6 5 (1.42%) Sybase
7 4 (1.13%) Bloomberg
7 4 (1.13%) CyberArk
7 4 (1.13%) Databricks
7 4 (1.13%) HP
7 4 (1.13%) Planview
8 3 (0.85%) Amdocs
8 3 (0.85%) Ciena
8 3 (0.85%) ForgeRock
8 3 (0.85%) NEC
8 3 (0.85%) Nokia
8 3 (0.85%) Okta