TCP/IP Contracts with Hybrid/Remote/WFH Options

Transmission Control Protocol/Internet Protocol (TCP/IP)
UK > Work from Home

The table below provides summary statistics for remote or hybrid contract work requiring TCP/IP skills. It includes a benchmarking guide to the contractor rates offered in vacancies that cited TCP/IP over the 6 months leading up to 3 July 2025, comparing them to the same period in the previous two years.

6 months to
3 Jul 2025
Same period 2024 Same period 2023
Rank 187 236 271
Rank change year-on-year +49 +35 0
Contract jobs citing TCP/IP 125 106 199
As % of all contract jobs with a WFH option 1.24% 0.72% 0.83%
As % of the Communications & Networking category 11.32% 6.87% 7.07%
Number of daily rates quoted 80 69 135
10th Percentile £362 £219 £263
25th Percentile £455 £350 £363
Median daily rate (50th Percentile) £563 £500 £450
Median % change year-on-year +12.50% +11.11% -10.00%
75th Percentile £678 £575 £640
90th Percentile £838 £623 £740
UK median daily rate £500 £475 £479
% change year-on-year +5.26% -0.84% +0.84%
Number of hourly rates quoted 11 5 7
10th Percentile £61.25 £20.40 £18.50
25th Percentile £63.13 £23.25 £20.50
Median hourly rate £65.00 £65.00 £25.00
Median % change year-on-year - +160.00% -8.26%
75th Percentile - - £46.88
90th Percentile - - £65.00
UK median hourly rate £62.50 £65.00 £55.91
% change year-on-year -3.85% +16.26% +17.70%

All Communications and Computer Networking Skills
Work from Home

TCP/IP falls under the Communications and Computer Networking category. For comparison with the information above, the following table provides summary statistics for all contract job vacancies with remote or hybrid options requiring communications or computer networking skills.

Contract vacancies with a requirement for communications or computer networking skills 1,104 1,543 2,814
As % of all contract jobs with a WFH option 10.98% 10.51% 11.80%
Number of daily rates quoted 681 998 1,857
10th Percentile £313 £300 £325
25th Percentile £400 £413 £418
Median daily rate (50th Percentile) £500 £525 £520
Median % change year-on-year -4.76% +0.96% +1.96%
75th Percentile £600 £624 £638
90th Percentile £700 £700 £725
UK median daily rate £480 £500 £506
% change year-on-year -4.00% -1.19% +1.20%
Number of hourly rates quoted 36 71 106
10th Percentile £14.20 £12.75 £19.00
25th Percentile £40.50 £14.27 £31.25
Median hourly rate £63.00 £45.00 £52.50
Median % change year-on-year +40.00% -14.29% +10.53%
75th Percentile £65.25 £65.00 £70.00
90th Percentile £70.16 £87.46 £79.19
UK median hourly rate £42.00 £45.00 £21.00
% change year-on-year -6.67% +114.29% -27.74%

TCP/IP
Trend for Jobs with a WFH Option

Job vacancies with remote working options citing TCP/IP as a proportion of all IT jobs advertised.
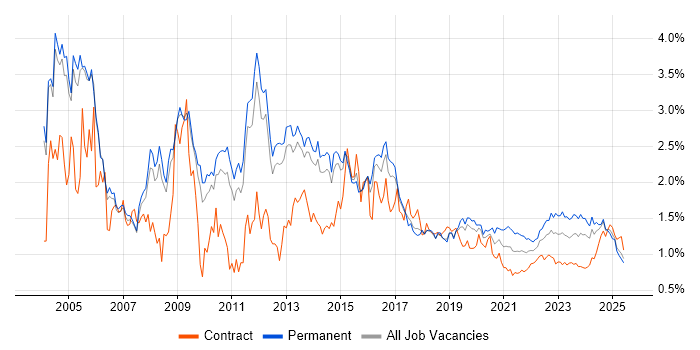
TCP/IP trend for jobs with Hybrid/Remote/WFH options

TCP/IP
Daily Rate Trend for Jobs with a WFH Option

3-month moving average daily rate quoted in job vacancies with remote working options citing TCP/IP.

TCP/IP daily rate for jobs with a WFH option

TCP/IP
Daily Rate Histogram for Jobs with a WFH Option

Daily rate distribution for jobs with remote working options citing TCP/IP over the 6 months to 3 July 2025.

TCP/IP daily rate histogram for jobs with a WFH option

TCP/IP
Hourly Rate Trend for Jobs with a WFH Option

3-month moving average hourly rate quoted in job vacancies with remote working options citing TCP/IP.

TCP/IP hourly rate for jobs with a WFH option

TCP/IP
Hourly Rate Histogram for Jobs with a WFH Option

Hourly rate distribution for jobs with remote working options citing TCP/IP over the 6 months to 3 July 2025.

TCP/IP hourly rate histogram for jobs with a WFH option

TCP/IP
Co-occurring Skills and Capabilities with WFH Options by Category

The follow tables expand on the table above by listing co-occurrences grouped by category. The same employment type, locality and period is covered with up to 20 co-occurrences shown in each of the following categories:

Application Platforms
1 10 (8.00%) Confluence
2 5 (4.00%) Microsoft Exchange
3 4 (3.20%) SharePoint
4 2 (1.60%) IIS
5 1 (0.80%) Apache
5 1 (0.80%) nginx
Applications
1 7 (5.60%) Microsoft Office
2 3 (2.40%) Microsoft PowerPoint
3 2 (1.60%) MS Visio
Business Applications
1 1 (0.80%) Dynamics CRM
Cloud Services
1 43 (34.40%) Azure
2 41 (32.80%) AWS
3 29 (23.20%) AWS CloudFormation
4 19 (15.20%) GCP
5 18 (14.40%) PaaS
5 18 (14.40%) SaaS
6 17 (13.60%) IaaS
7 13 (10.40%) GitHub
8 12 (9.60%) Amazon EKS
9 10 (8.00%) Amazon EC2
10 6 (4.80%) Azure Monitor
11 4 (3.20%) Azure DevOps
11 4 (3.20%) Azure Sentinel
11 4 (3.20%) Microsoft 365
12 3 (2.40%) GitHub Actions
13 2 (1.60%) AWS Lambda
13 2 (1.60%) Azure AKS
13 2 (1.60%) Azure Machine Learning
13 2 (1.60%) Azure Synapse Analytics
13 2 (1.60%) OneDrive
Communications & Networking
1 72 (57.60%) DNS
2 47 (37.60%) DHCP
2 47 (37.60%) Firewall
3 39 (31.20%) BGP
4 35 (28.00%) OSPF
5 34 (27.20%) HTTP
6 28 (22.40%) VPN
7 21 (16.80%) LAN
8 19 (15.20%) Network Security
9 18 (14.40%) VLAN
10 17 (13.60%) WAN
11 16 (12.80%) HTTPS
12 14 (11.20%) SSL
13 13 (10.40%) Wireless
14 11 (8.80%) Ethernet
15 10 (8.00%) Internet
16 9 (7.20%) TACACS
17 7 (5.60%) SMTP
18 5 (4.00%) 4G
18 5 (4.00%) EIGRP
Database & Business Intelligence
1 12 (9.60%) Amazon RDS
2 10 (8.00%) Amazon Aurora
3 7 (5.60%) SQL Server
4 3 (2.40%) NoSQL
5 2 (1.60%) Apache Cassandra
5 2 (1.60%) DynamoDB
5 2 (1.60%) MariaDB
5 2 (1.60%) PostgreSQL
5 2 (1.60%) Power BI
6 1 (0.80%) DB2
6 1 (0.80%) Elasticsearch
6 1 (0.80%) MongoDB
6 1 (0.80%) MySQL
6 1 (0.80%) Relational Database
6 1 (0.80%) Sybase ASE
Development Applications
1 13 (10.40%) Jenkins
2 11 (8.80%) Eclipse
2 11 (8.80%) Visual Studio
3 10 (8.00%) JIRA
4 7 (5.60%) Git
5 3 (2.40%) Sonatype Nexus
6 2 (1.60%) GitLab
7 1 (0.80%) Bitbucket
7 1 (0.80%) Postman
7 1 (0.80%) Subversion
7 1 (0.80%) TeamCity
General
1 49 (39.20%) Social Skills
2 19 (15.20%) Military
3 16 (12.80%) Finance
4 11 (8.80%) Presentation Skills
5 7 (5.60%) Analytical Skills
5 7 (5.60%) Marketing
6 5 (4.00%) Banking
7 3 (2.40%) Financial Institution
7 3 (2.40%) Front Office
7 3 (2.40%) Local Government
7 3 (2.40%) Public Sector
8 2 (1.60%) Investment Banking
9 1 (0.80%) Law
9 1 (0.80%) Legal
9 1 (0.80%) Police
9 1 (0.80%) Retail
9 1 (0.80%) Telecoms
Job Titles
1 21 (16.80%) Architect
1 21 (16.80%) Senior
2 17 (13.60%) Cloud Architect
2 17 (13.60%) Network Engineer
3 16 (12.80%) Cloud Native Architect
3 16 (12.80%) Technical Architect
4 11 (8.80%) DevOps Engineer
4 11 (8.80%) Software Engineer
5 10 (8.00%) C# Software Engineer
5 10 (8.00%) Infrastructure Engineer
5 10 (8.00%) Security Architect
6 9 (7.20%) Network Security Architect
7 8 (6.40%) AWS Architect
7 8 (6.40%) C++ Software Engineer
7 8 (6.40%) Developer
7 8 (6.40%) Lead
7 8 (6.40%) Security Technical Architect
7 8 (6.40%) Senior DevOps
7 8 (6.40%) Senior DevOps Engineer
7 8 (6.40%) Windows Engineer
Libraries, Frameworks & Software Standards
1 13 (10.40%) Elastic Stack
2 12 (9.60%) Node.js
2 12 (9.60%) Web Services
3 4 (3.20%) .NET
3 4 (3.20%) FIX Protocol
4 3 (2.40%) FpML
4 3 (2.40%) Middleware
5 2 (1.60%) JSON
5 2 (1.60%) OpenTelemetry
5 2 (1.60%) YAML
6 1 (0.80%) LDAP
6 1 (0.80%) REST
Miscellaneous
1 17 (13.60%) Data Centre
2 16 (12.80%) Cloud Native
3 6 (4.80%) Distributed Systems
4 5 (4.00%) Security Operations Centre
4 5 (4.00%) Self-Motivation
5 4 (3.20%) Algorithms
5 4 (3.20%) Data Structures
5 4 (3.20%) Enterprise Storage
5 4 (3.20%) Foreign Exchange (FX)
5 4 (3.20%) SCADA
5 4 (3.20%) Security Posture
6 3 (2.40%) Derivative
6 3 (2.40%) Fixed Income
6 3 (2.40%) Management Information System
6 3 (2.40%) Private Cloud
7 2 (1.60%) Clustering
7 2 (1.60%) Cyber Threat
7 2 (1.60%) Enterprise Software
7 2 (1.60%) Mainframe
7 2 (1.60%) Renewable Energy
Operating Systems
1 46 (36.80%) Linux
2 40 (32.00%) Windows
3 13 (10.40%) Windows Server
4 10 (8.00%) Red Hat Enterprise Linux
5 6 (4.80%) Windows Server 2019
6 5 (4.00%) Ubuntu
7 4 (3.20%) Unix
7 4 (3.20%) Windows Server 2003
7 4 (3.20%) Windows Server 2016
8 3 (2.40%) CentOS
9 2 (1.60%) Debian
9 2 (1.60%) Mac OS X
9 2 (1.60%) SUSE
9 2 (1.60%) Windows 10
9 2 (1.60%) Windows Server 2012
9 2 (1.60%) zOS
10 1 (0.80%) Apple iOS
10 1 (0.80%) Mac OS
10 1 (0.80%) Oracle Linux
10 1 (0.80%) Solaris
Processes & Methodologies
1 33 (26.40%) Infrastructure as Code
2 27 (21.60%) Agile
3 24 (19.20%) CI/CD
3 24 (19.20%) Continuous Integration
4 22 (17.60%) DevOps
5 20 (16.00%) Problem-Solving
6 18 (14.40%) Test Automation
7 17 (13.60%) Configuration Management
8 16 (12.80%) Sprint Planning
9 15 (12.00%) Computer Science
9 15 (12.00%) Containerisation
9 15 (12.00%) Infrastructure Engineering
10 14 (11.20%) ITIL
11 13 (10.40%) High Availability
12 12 (9.60%) Incident Management
12 12 (9.60%) Mentoring
13 11 (8.80%) Software Engineering
13 11 (8.80%) TDD
13 11 (8.80%) Unit Testing
13 11 (8.80%) Visualisation
Programming Languages
1 26 (20.80%) Python
2 18 (14.40%) Bicep
2 18 (14.40%) C#
3 16 (12.80%) C++
4 12 (9.60%) JavaScript
5 11 (8.80%) PowerShell
6 7 (5.60%) Bash
7 6 (4.80%) Java
8 5 (4.00%) SQL
9 4 (3.20%) Perl
10 3 (2.40%) Kusto Query Language
10 3 (2.40%) Shell Script
11 2 (1.60%) Go
11 2 (1.60%) JCL
11 2 (1.60%) VBScript
12 1 (0.80%) C
12 1 (0.80%) PHP
Qualifications
1 29 (23.20%) Security Cleared
2 28 (22.40%) SC Cleared
3 18 (14.40%) Cisco Certification
3 18 (14.40%) Degree
4 12 (9.60%) CCNP
5 10 (8.00%) CCNA
6 7 (5.60%) Computer Science Degree
7 2 (1.60%) (ISC)2 CCSP
7 2 (1.60%) CCSP
7 2 (1.60%) CEH
7 2 (1.60%) CISSP
7 2 (1.60%) ITIL Certification
7 2 (1.60%) JNCIA
7 2 (1.60%) JNCIS
7 2 (1.60%) MCP
8 1 (0.80%) DV Cleared
8 1 (0.80%) GCIH
8 1 (0.80%) MCSA
8 1 (0.80%) MCSE
8 1 (0.80%) MOS
Quality Assurance & Compliance
1 4 (3.20%) GDPR
2 2 (1.60%) QA
3 1 (0.80%) Actionable Recommendations
3 1 (0.80%) ISO/IEC 27001
3 1 (0.80%) NIST
3 1 (0.80%) PCI DSS
3 1 (0.80%) Sarbanes-Oxley
3 1 (0.80%) SOC 2
System Software
1 15 (12.00%) Docker
2 11 (8.80%) Active Directory
3 10 (8.00%) VMware Infrastructure
4 6 (4.80%) vSphere
5 5 (4.00%) Hyper-V
6 4 (3.20%) VMware ESXi
7 2 (1.60%) Virtual Machines
8 1 (0.80%) Virtual Desktop
Systems Management
1 37 (29.60%) Terraform
2 22 (17.60%) Ansible
3 18 (14.40%) Kubernetes
4 15 (12.00%) Grafana
4 15 (12.00%) Prometheus
4 15 (12.00%) Puppet
5 12 (9.60%) Progress Chef
6 9 (7.20%) FortiGate
7 5 (4.00%) Tivoli
8 4 (3.20%) NetBackup
9 3 (2.40%) Red Hat Satellite
9 3 (2.40%) SCCM
10 2 (1.60%) Failover Clustering
10 2 (1.60%) Packer
10 2 (1.60%) Tivoli NetView
10 2 (1.60%) WSUS
11 1 (0.80%) EMC NetWorker
11 1 (0.80%) HP Data Protector
11 1 (0.80%) Netcool
11 1 (0.80%) Tivoli Storage Manager
Vendors
1 39 (31.20%) Cisco
2 35 (28.00%) Palo Alto
3 32 (25.60%) Microsoft
4 23 (18.40%) Red Hat
4 23 (18.40%) VMware
5 22 (17.60%) CheckPoint
6 19 (15.20%) Fortinet
7 8 (6.40%) Juniper
8 7 (5.60%) Citrix
8 7 (5.60%) Oracle
9 5 (4.00%) Dell
9 5 (4.00%) HP
9 5 (4.00%) SolarWinds
10 4 (3.20%) 3PAR
10 4 (3.20%) ServiceNow
10 4 (3.20%) Splunk
10 4 (3.20%) Veeam
10 4 (3.20%) Veritas
11 3 (2.40%) CyberArk
11 3 (2.40%) F5