User Acceptance Testing Jobs with Hybrid/Remote/WFH Options

User Acceptance Testing (UAT)
UK > Work from Home

The table below provides summary statistics for permanent remote or hybrid work requiring User Acceptance Testing skills. It includes a benchmarking guide to the annual salaries offered in vacancies that cited User Acceptance Testing over the 6 months leading up to 2 May 2025, comparing them to the same period in the previous two years.

6 months to
2 May 2025
Same period 2024 Same period 2023
Rank 284 305 268
Rank change year-on-year +21 -37 +22
Permanent jobs citing User Acceptance Testing 131 329 537
As % of all permanent jobs with a WFH option 0.88% 0.97% 1.26%
As % of the Processes & Methodologies category 0.94% 1.06% 1.31%
Number of salaries quoted 93 263 313
10th Percentile £31,500 £39,750 £37,500
25th Percentile £46,250 £43,500 £44,500
Median annual salary (50th Percentile) £62,500 £55,000 £57,500
Median % change year-on-year +13.64% -4.35% +6.48%
75th Percentile £75,000 £62,500 £64,750
90th Percentile £86,000 £74,750 £76,059
UK median annual salary £60,000 £55,000 £55,000
% change year-on-year +9.09% - -

All Process and Methodology Skills
Work from Home

User Acceptance Testing falls under the Processes and Methodologies category. For comparison with the information above, the following table provides summary statistics for all permanent job vacancies with remote or hybrid options requiring process or methodology skills.

Permanent vacancies with a requirement for process or methodology skills 13,938 31,020 41,026
As % of all permanent jobs with a WFH option 93.13% 91.65% 96.09%
Number of salaries quoted 9,733 23,575 28,496
10th Percentile £30,000 £33,800 £37,500
25th Percentile £45,000 £42,500 £47,500
Median annual salary (50th Percentile) £60,000 £57,500 £62,500
Median % change year-on-year +4.35% -8.00% +4.17%
75th Percentile £77,500 £75,000 £82,500
90th Percentile £102,500 £95,000 £100,000
UK median annual salary £57,500 £55,000 £61,500
% change year-on-year +4.55% -10.57% +2.50%

User Acceptance Testing
Trend for Jobs with a WFH Option

Job vacancies with remote working options citing User Acceptance Testing as a proportion of all IT jobs advertised.
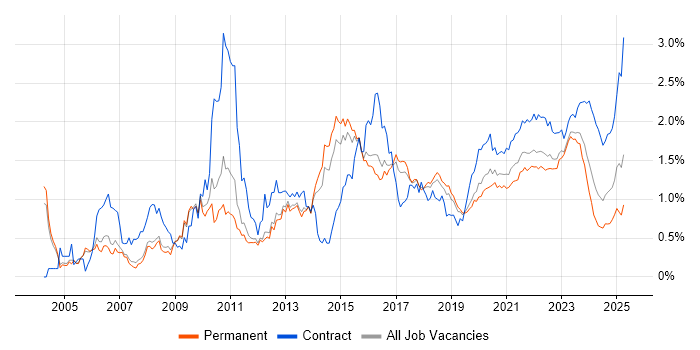
User Acceptance Testing trend for jobs with Hybrid/Remote/WFH options

User Acceptance Testing
Salary Trend for Jobs with a WFH Option

3-month moving average salary quoted in job vacancies with remote working options citing User Acceptance Testing.

User Acceptance Testing salary trend for jobs with a WFH option

User Acceptance Testing
Salary Histogram for Jobs with a WFH Option

Salary distribution for jobs with remote working options citing User Acceptance Testing over the 6 months to 2 May 2025.

User Acceptance Testing salary histogram for jobs with a WFH option

User Acceptance Testing
Co-occurring Skills and Capabilities with WFH Options by Category

The follow tables expand on the table above by listing co-occurrences grouped by category. The same employment type, locality and period is covered with up to 20 co-occurrences shown in each of the following categories:

Application Platforms
1 3 (2.29%) CMS
1 3 (2.29%) Oracle Workflow
1 3 (2.29%) Umbraco
2 2 (1.53%) SharePoint
3 1 (0.76%) Confluence
3 1 (0.76%) Moodle
3 1 (0.76%) Totara
3 1 (0.76%) WordPress
Applications
1 7 (5.34%) Microsoft Excel
2 5 (3.82%) Spreadsheet
3 3 (2.29%) Microsoft Office
3 3 (2.29%) Trello
4 2 (1.53%) Oracle Smart View
5 1 (0.76%) Microsoft PowerPoint
5 1 (0.76%) MS Visio
5 1 (0.76%) Sketch
Business Applications
1 7 (5.34%) Aladdin
2 3 (2.29%) Dynamics CRM
3 2 (1.53%) Dynamics AX
3 2 (1.53%) Dynamics NAV
3 2 (1.53%) NEC Housing
3 2 (1.53%) NetSuite
3 2 (1.53%) Oracle Assets
3 2 (1.53%) Oracle Cash Management
3 2 (1.53%) Oracle ERP
3 2 (1.53%) Oracle Financials
3 2 (1.53%) Oracle General Ledger
3 2 (1.53%) Oracle Payables
3 2 (1.53%) Oracle Receivables
3 2 (1.53%) SAP Business One
4 1 (0.76%) Magento
4 1 (0.76%) Oracle EBS
4 1 (0.76%) Oracle EBS R12
4 1 (0.76%) Oracle Procure-to-Pay
4 1 (0.76%) SAP Payroll
4 1 (0.76%) SAP S/4HANA
Cloud Services
1 19 (14.50%) Azure
2 14 (10.69%) Azure DevOps
2 14 (10.69%) Power Platform
3 10 (7.63%) SaaS
4 6 (4.58%) Dynamics 365
5 4 (3.05%) Microsoft 365
6 3 (2.29%) Google Docs
6 3 (2.29%) OpenShift
6 3 (2.29%) Slack
7 2 (1.53%) Azure Data Factory
7 2 (1.53%) Azure Stack
7 2 (1.53%) OCI
7 2 (1.53%) PaaS
7 2 (1.53%) Snowflake
8 1 (0.76%) AWS
8 1 (0.76%) GCP
8 1 (0.76%) GitHub
8 1 (0.76%) Salesforce Sales Cloud
8 1 (0.76%) Salesforce Service Cloud
8 1 (0.76%) SuccessFactors
Communications & Networking
1 2 (1.53%) Firewall
1 2 (1.53%) Internet
1 2 (1.53%) LAN
1 2 (1.53%) WAN
1 2 (1.53%) Wi-Fi
Database & Business Intelligence
1 12 (9.16%) Power BI
1 12 (9.16%) SQL Server
2 5 (3.82%) Data Warehouse
2 5 (3.82%) Oracle Database
3 3 (2.29%) PostgreSQL
3 3 (2.29%) Tableau
4 2 (1.53%) NoSQL
5 1 (0.76%) Data Mining
5 1 (0.76%) Geospatial Data
5 1 (0.76%) GIS
5 1 (0.76%) MySQL
5 1 (0.76%) Relational Database
5 1 (0.76%) Spatial Data
Development Applications
1 13 (9.92%) JIRA
2 6 (4.58%) Selenium
3 4 (3.05%) Jenkins
4 3 (2.29%) MSTest
4 3 (2.29%) NUnit
4 3 (2.29%) SpecFlow
4 3 (2.29%) TeamCity
5 2 (1.53%) Cypress.io
5 2 (1.53%) JMeter
5 2 (1.53%) Postman
6 1 (0.76%) Gatling
6 1 (0.76%) GitLab
6 1 (0.76%) JUnit
6 1 (0.76%) LoadRunner
6 1 (0.76%) Locust
6 1 (0.76%) LSMW
6 1 (0.76%) MSI
6 1 (0.76%) TestRail
6 1 (0.76%) Visual Studio Code
6 1 (0.76%) YouTrack
General
1 58 (44.27%) Social Skills
2 49 (37.40%) Finance
3 15 (11.45%) Inclusion and Diversity
4 13 (9.92%) Analytical Skills
4 13 (9.92%) Presentation Skills
5 12 (9.16%) Front Office
5 12 (9.16%) Law
6 10 (7.63%) Banking
7 9 (6.87%) Back Office
8 8 (6.11%) Legal
8 8 (6.11%) Organisational Skills
9 7 (5.34%) Documentation Skills
10 6 (4.58%) Retail
11 5 (3.82%) Local Government
12 4 (3.05%) Influencing Skills
12 4 (3.05%) Public Sector
13 3 (2.29%) Environmental Health
13 3 (2.29%) General Ledger
13 3 (2.29%) Private Banking
13 3 (2.29%) Retail Banking
Job Titles
1 48 (36.64%) Analyst
2 17 (12.98%) Senior
3 16 (12.21%) Business Analyst
4 13 (9.92%) Test Manager
5 10 (7.63%) Financial Analyst
5 10 (7.63%) Lead
5 10 (7.63%) Test Analyst
6 9 (6.87%) Consultant
7 8 (6.11%) Business Manager
7 8 (6.11%) Developer
7 8 (6.11%) Senior Analyst
8 7 (5.34%) Finance Business Analyst
8 7 (5.34%) Fixed Income Business Analyst
8 7 (5.34%) Implementation Consultant
8 7 (5.34%) Support Analyst
9 6 (4.58%) Applications Support
9 6 (4.58%) Coordinator
9 6 (4.58%) Finance Manager
9 6 (4.58%) Project Coordinator
9 6 (4.58%) Project Manager
Libraries, Frameworks & Software Standards
1 11 (8.40%) .NET
2 5 (3.82%) HTML
2 5 (3.82%) REST
3 4 (3.05%) AngularJS
3 4 (3.05%) CSS
3 4 (3.05%) JSON
4 3 (2.29%) .NET Core
4 3 (2.29%) CSS3
4 3 (2.29%) Electron
4 3 (2.29%) Highcharts JS
4 3 (2.29%) HTML5
4 3 (2.29%) LESS
4 3 (2.29%) NgRx
4 3 (2.29%) Oracle Fusion
4 3 (2.29%) Reactive Extensions
4 3 (2.29%) RxJS
4 3 (2.29%) WPF
5 2 (1.53%) Blazor
5 2 (1.53%) Lightning Web Components
5 2 (1.53%) RESTful
Miscellaneous
1 14 (10.69%) Derivative
2 10 (7.63%) Fixed Income
2 10 (7.63%) Management Information System
3 7 (5.34%) Foreign Exchange (FX)
3 7 (5.34%) Hedge funds
4 5 (3.82%) Enterprise Software
5 4 (3.05%) NHS
5 4 (3.05%) Self-Motivation
5 4 (3.05%) Video Conferencing
6 3 (2.29%) Analytical Mindset
6 3 (2.29%) Cloud Native
6 3 (2.29%) Credit Derivative
6 3 (2.29%) Equities
6 3 (2.29%) Virtual Team
7 2 (1.53%) Driving Licence
7 2 (1.53%) FMCG
7 2 (1.53%) Onboarding
7 2 (1.53%) PMI
7 2 (1.53%) Smart Energy
8 1 (0.76%) Product Ownership
Operating Systems
1 8 (6.11%) Windows
2 4 (3.05%) Linux
2 4 (3.05%) Unix
3 2 (1.53%) Windows Vista
Processes & Methodologies
1 45 (34.35%) Agile
2 31 (23.66%) Problem-Solving
3 25 (19.08%) Test Automation
4 20 (15.27%) Test Strategy
5 19 (14.50%) Continuous Improvement
5 19 (14.50%) DevOps
5 19 (14.50%) Stakeholder Management
6 18 (13.74%) Business Intelligence
7 16 (12.21%) Business Analysis
7 16 (12.21%) Process Improvement
7 16 (12.21%) Regression Testing
8 15 (11.45%) Test Scripting
9 14 (10.69%) Analytics
9 14 (10.69%) Change Management
9 14 (10.69%) ERP
9 14 (10.69%) Project Management
10 13 (9.92%) Mentoring
10 13 (9.92%) Time Management
11 12 (9.16%) Manual Testing
11 12 (9.16%) SDLC
Programming Languages
1 30 (22.90%) SQL
2 17 (12.98%) Python
3 9 (6.87%) JavaScript
4 7 (5.34%) C#
5 5 (3.82%) T-SQL
6 4 (3.05%) Java
6 4 (3.05%) TypeScript
7 3 (2.29%) Data Analysis Expressions
8 2 (1.53%) Apex Code
9 1 (0.76%) PowerShell
9 1 (0.76%) SAPscript
Qualifications
1 14 (10.69%) Degree
2 7 (5.34%) ISTQB
3 3 (2.29%) ISTQB Foundation Certification
3 3 (2.29%) Microsoft Certification
3 3 (2.29%) SC Cleared
3 3 (2.29%) Security Cleared
4 2 (1.53%) BPSS Clearance
4 2 (1.53%) CBAP
4 2 (1.53%) Computer Science Degree
4 2 (1.53%) CTC Cleared
4 2 (1.53%) MCP
4 2 (1.53%) PMI Certification
5 1 (0.76%) Azure Certification
5 1 (0.76%) CISSP
5 1 (0.76%) ITIL Certification
5 1 (0.76%) ITIL Foundation Certificate
5 1 (0.76%) Oracle Certification
5 1 (0.76%) PMP
Quality Assurance & Compliance
1 23 (17.56%) QA
2 10 (7.63%) PMO
3 9 (6.87%) Data Quality
4 8 (6.11%) Accessibility
5 2 (1.53%) GDPR
5 2 (1.53%) SLA
Systems Management
1 1 (0.76%) HP Quality Center
1 1 (0.76%) Terraform
Vendors
1 20 (15.27%) Microsoft
2 17 (12.98%) Oracle
3 12 (9.16%) SAP
4 7 (5.34%) BISAM
5 5 (3.82%) Google
5 5 (3.82%) Salesforce
6 3 (2.29%) Databricks
7 2 (1.53%) Infor
7 2 (1.53%) NEC
7 2 (1.53%) Sun
8 1 (0.76%) Aderant
8 1 (0.76%) Capita
8 1 (0.76%) iManage
8 1 (0.76%) Mapbox
8 1 (0.76%) Murex
8 1 (0.76%) Splunk