Web Services Contracts with Hybrid/Remote/WFH Options

Web Services
UK > Work from Home

The table below provides summary statistics for remote or hybrid contract work requiring Web Services skills. It includes a benchmarking guide to the contractor rates offered in vacancies that cited Web Services over the 6 months leading up to 22 June 2025, comparing them to the same period in the previous two years.

6 months to
22 Jun 2025
Same period 2024 Same period 2023
Rank 150 122 199
Rank change year-on-year -28 +77 -72
Contract jobs citing Web Services 175 255 297
As % of all contract jobs with a WFH option 1.79% 1.73% 1.25%
As % of the Libraries, Frameworks & Software Standards category 6.68% 6.80% 5.01%
Number of daily rates quoted 116 169 191
10th Percentile £358 £408 £413
25th Percentile £402 £475 £463
Median daily rate (50th Percentile) £500 £550 £550
Median % change year-on-year -9.09% - +1.85%
75th Percentile £641 £638 £638
90th Percentile £769 £688 £738
UK median daily rate £500 £550 £550
% change year-on-year -9.09% - -
Number of hourly rates quoted 9 5 2
10th Percentile £61.25 £41.60 £52.58
25th Percentile - £50.00 £54.56
Median hourly rate £65.00 £65.00 £59.75
Median % change year-on-year - +8.79% -3.04%
75th Percentile - - £65.56
90th Percentile - - £67.93
UK median hourly rate £65.00 £65.00 £75.00
% change year-on-year - -13.33% +15.38%

All Software Libraries and Frameworks
Work from Home

Web Services falls under the Software Libraries and Frameworks category. For comparison with the information above, the following table provides summary statistics for all contract job vacancies with remote or hybrid options requiring technical specification, industry standards, software libraries and framework skills.

Contract vacancies with a requirement for technical specification, industry standards, software libraries and framework skills 2,619 3,750 5,929
As % of all contract jobs with a WFH option 26.78% 25.39% 24.93%
Number of daily rates quoted 1,881 2,629 4,440
10th Percentile £358 £350 £384
25th Percentile £418 £435 £450
Median daily rate (50th Percentile) £525 £538 £538
Median % change year-on-year -2.33% - -2.27%
75th Percentile £650 £655 £652
90th Percentile £825 £825 £751
UK median daily rate £513 £538 £550
% change year-on-year -4.65% -2.27% -
Number of hourly rates quoted 33 94 76
10th Percentile £38.08 £24.68 £25.75
25th Percentile £61.25 - £45.94
Median hourly rate £65.00 £43.00 £63.25
Median % change year-on-year +51.16% -32.02% +26.50%
75th Percentile £68.00 £62.00 £74.06
90th Percentile £84.50 £72.50 £79.50
UK median hourly rate £55.00 £55.00 £65.00
% change year-on-year - -15.38% +25.30%

Web Services
Trend for Jobs with a WFH Option

Job vacancies with remote working options citing Web Services as a proportion of all IT jobs advertised.
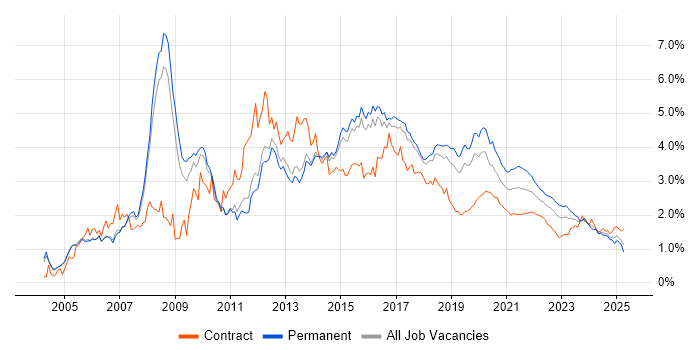
Web Services trend for jobs with Hybrid/Remote/WFH options

Web Services
Daily Rate Trend for Jobs with a WFH Option

3-month moving average daily rate quoted in job vacancies with remote working options citing Web Services.

Web Services daily rate for jobs with a WFH option

Web Services
Daily Rate Histogram for Jobs with a WFH Option

Daily rate distribution for jobs with remote working options citing Web Services over the 6 months to 22 June 2025.

Web Services daily rate histogram for jobs with a WFH option

Web Services
Hourly Rate Trend for Jobs with a WFH Option

3-month moving average hourly rate quoted in job vacancies with remote working options citing Web Services.

Web Services hourly rate for jobs with a WFH option

Web Services
Co-occurring Skills and Capabilities with WFH Options by Category

The follow tables expand on the table above by listing co-occurrences grouped by category. The same employment type, locality and period is covered with up to 20 co-occurrences shown in each of the following categories:

Application Platforms
1 8 (4.57%) SharePoint
2 7 (4.00%) Confluence
3 6 (3.43%) WordPress
4 5 (2.86%) CMS
4 5 (2.86%) Drupal
5 4 (2.29%) Apache
5 4 (2.29%) Microsoft Exchange
6 3 (1.71%) WebSphere
7 2 (1.14%) CICS
7 2 (1.14%) IIS
7 2 (1.14%) JBoss
7 2 (1.14%) Oracle Workflow
7 2 (1.14%) WebSphere Application Server
8 1 (0.57%) OpenEdge
8 1 (0.57%) Oracle Service Bus
8 1 (0.57%) Oracle SOA Suite
8 1 (0.57%) Tomcat
Applications
1 3 (1.71%) Microsoft Office
2 1 (0.57%) Microsoft Excel
Business Applications
1 6 (3.43%) Dynamics CRM
2 5 (2.86%) Oracle EBS
2 5 (2.86%) Workday HCM
3 2 (1.14%) Oracle ERP
3 2 (1.14%) Oracle Payroll
3 2 (1.14%) Salesforce CRM
3 2 (1.14%) SAP S/4HANA
4 1 (0.57%) Oracle Applications
4 1 (0.57%) Oracle EBS R12
4 1 (0.57%) Remedy ITSM
4 1 (0.57%) SAP PLM
4 1 (0.57%) UltiPro
Cloud Services
1 46 (26.29%) Azure
2 30 (17.14%) AWS
3 14 (8.00%) Amazon SQS
4 11 (6.29%) SaaS
5 10 (5.71%) Power Platform
6 9 (5.14%) Azure DevOps
6 9 (5.14%) GitHub
6 9 (5.14%) OCI
6 9 (5.14%) Serverless
7 8 (4.57%) Amazon ECS
7 8 (4.57%) AWS KMS
7 8 (4.57%) Dynamics 365
7 8 (4.57%) Route 53
8 7 (4.00%) GCP
8 7 (4.00%) PaaS
9 6 (3.43%) Amazon EC2
10 5 (2.86%) Amazon S3
10 5 (2.86%) AWS CloudFormation
10 5 (2.86%) Azure Sentinel
10 5 (2.86%) Microsoft 365
Communications & Networking
1 16 (9.14%) HTTP
2 11 (6.29%) TCP/IP
3 10 (5.71%) Ethernet
4 6 (3.43%) Internet
4 6 (3.43%) SSL
5 5 (2.86%) Kerberos
6 3 (1.71%) Firewall
6 3 (1.71%) IPsec
7 1 (0.57%) DHCP
7 1 (0.57%) DMZ
7 1 (0.57%) DNS
7 1 (0.57%) POP3
7 1 (0.57%) SMTP
7 1 (0.57%) VPN
Database & Business Intelligence
1 20 (11.43%) SQL Server
2 19 (10.86%) PostgreSQL
3 10 (5.71%) DynamoDB
3 10 (5.71%) Relational Database
4 9 (5.14%) Amazon RDS
5 8 (4.57%) Power BI
5 8 (4.57%) SAP HANA
6 7 (4.00%) Oracle Database
6 7 (4.00%) SQL Server Integration Services
7 6 (3.43%) Amazon Aurora
7 6 (3.43%) MongoDB
7 6 (3.43%) MS Access
7 6 (3.43%) MySQL
7 6 (3.43%) NoSQL
8 4 (2.29%) SQL Server Reporting Services
9 3 (1.71%) DB2
9 3 (1.71%) Oracle BI Publisher
9 3 (1.71%) Oracle Reports
9 3 (1.71%) Redis
10 2 (1.14%) Elasticsearch
Development Applications
1 33 (18.86%) Git
2 22 (12.57%) JIRA
3 20 (11.43%) Jenkins
4 18 (10.29%) Maven
5 14 (8.00%) JUnit
5 14 (8.00%) Visual Studio
6 12 (6.86%) Eclipse
7 9 (5.14%) SonarQube
8 7 (4.00%) Bitbucket Server
8 7 (4.00%) GitLab
8 7 (4.00%) Mockito
9 6 (3.43%) Selenium
9 6 (3.43%) Subversion
10 5 (2.86%) git-flow
10 5 (2.86%) IntelliJ
10 5 (2.86%) NUnit
10 5 (2.86%) Postman
10 5 (2.86%) Team Foundation Server
11 4 (2.29%) MSTest
11 4 (2.29%) REST Assured
General
1 65 (37.14%) Social Skills
2 43 (24.57%) Finance
3 30 (17.14%) Analytical Skills
4 19 (10.86%) Banking
5 13 (7.43%) Presentation Skills
6 10 (5.71%) Military
6 10 (5.71%) Public Sector
6 10 (5.71%) Telecoms
7 4 (2.29%) Billing
8 3 (1.71%) Front Office
8 3 (1.71%) Retail
9 2 (1.14%) Documentation Skills
9 2 (1.14%) Electronics
9 2 (1.14%) Law
9 2 (1.14%) Manufacturing
9 2 (1.14%) Marketing
9 2 (1.14%) Wholesale Banking
10 1 (0.57%) Investment Banking
10 1 (0.57%) Organisational Skills
10 1 (0.57%) Police
Job Titles
1 82 (46.86%) Developer
2 25 (14.29%) Senior
3 21 (12.00%) Architect
4 15 (8.57%) Software Engineer
5 14 (8.00%) C# Developer
6 12 (6.86%) Analyst
6 12 (6.86%) C++ Developer
6 12 (6.86%) Java Developer
7 11 (6.29%) C++/C# Developer
8 10 (5.71%) Lead
8 10 (5.71%) SAP Developer
8 10 (5.71%) ServiceNow Architect
9 9 (5.14%) C# Software Engineer
10 8 (4.57%) .NET Developer
10 8 (4.57%) ABAP Developer
10 8 (4.57%) Security Engineer
10 8 (4.57%) Senior Developer
11 7 (4.00%) Dynamics 365 Developer
11 7 (4.00%) Solutions Architect
11 7 (4.00%) Test Analyst
Libraries, Frameworks & Software Standards
1 55 (31.43%) REST
2 45 (25.71%) SOAP
3 37 (21.14%) RESTful
4 36 (20.57%) HTML
5 30 (17.14%) CSS
6 27 (15.43%) .NET
7 26 (14.86%) AngularJS
8 22 (12.57%) Spring
9 20 (11.43%) Node.js
10 19 (10.86%) Kafka
10 19 (10.86%) Spring Boot
10 19 (10.86%) WCF
11 16 (9.14%) XML
12 15 (8.57%) JSON
12 15 (8.57%) Middleware
13 13 (7.43%) .NET Core
13 13 (7.43%) Ajax
13 13 (7.43%) ASP.NET
14 12 (6.86%) Hibernate
15 11 (6.29%) JPA
Miscellaneous
1 13 (7.43%) Foreign Exchange (FX)
2 11 (6.29%) Legacy Applications
3 10 (5.71%) CMDB
4 7 (4.00%) Distributed Systems
5 6 (3.43%) Legacy Systems
6 5 (2.86%) Mainframe
7 4 (2.29%) Frameworx
7 4 (2.29%) Legacy Code
7 4 (2.29%) Self-Motivation
7 4 (2.29%) TM Forum
8 3 (1.71%) Data Structures
8 3 (1.71%) Derivative
8 3 (1.71%) Distributed Denial-of-Service
8 3 (1.71%) Equity Derivative
8 3 (1.71%) N-Tier
8 3 (1.71%) Onboarding
9 2 (1.14%) Client/Server
9 2 (1.14%) Equities
9 2 (1.14%) NHS
9 2 (1.14%) VSAM
Operating Systems
1 25 (14.29%) Windows
2 23 (13.14%) Linux
3 18 (10.29%) Unix
4 2 (1.14%) Windows 10
4 2 (1.14%) Windows Server
5 1 (0.57%) AIX
5 1 (0.57%) Android
5 1 (0.57%) CentOS
5 1 (0.57%) Ubuntu
5 1 (0.57%) zOS
Processes & Methodologies
1 86 (49.14%) Agile
2 42 (24.00%) DevOps
3 37 (21.14%) Microservices
4 36 (20.57%) CI/CD
5 34 (19.43%) Problem-Solving
6 33 (18.86%) Scrum
7 30 (17.14%) TDD
8 25 (14.29%) Analytics
9 24 (13.71%) Continuous Integration
9 24 (13.71%) Test Automation
10 20 (11.43%) Unit Testing
11 19 (10.86%) Validation
12 18 (10.29%) ITSM
12 18 (10.29%) OO
12 18 (10.29%) Software Engineering
13 17 (9.71%) SDLC
14 15 (8.57%) Continuous Delivery
14 15 (8.57%) CRM
14 15 (8.57%) MVC
14 15 (8.57%) Service Management
Programming Languages
1 54 (30.86%) JavaScript
2 50 (28.57%) SQL
3 40 (22.86%) C#
4 35 (20.00%) Java
5 22 (12.57%) C++
6 11 (6.29%) Python
7 10 (5.71%) TypeScript
8 9 (5.14%) ABAP
8 9 (5.14%) PowerShell
9 8 (4.57%) PL/SQL
9 8 (4.57%) T-SQL
10 5 (2.86%) Bash
11 4 (2.29%) Groovy
11 4 (2.29%) PHP
11 4 (2.29%) Shell Script
12 3 (1.71%) COBOL
12 3 (1.71%) JCL
12 3 (1.71%) Kotlin
12 3 (1.71%) REXX
13 2 (1.14%) C
Qualifications
1 34 (19.43%) Security Cleared
2 31 (17.71%) SC Cleared
3 15 (8.57%) Degree
4 11 (6.29%) BPSS Clearance
5 8 (4.57%) CISM
5 8 (4.57%) CISSP
6 2 (1.14%) Computer Science Degree
6 2 (1.14%) DV Cleared
6 2 (1.14%) ISTQB
6 2 (1.14%) Microsoft Certification
7 1 (0.57%) Azure Certification
7 1 (0.57%) ISEB
7 1 (0.57%) ISTQB Foundation Certification
7 1 (0.57%) ITIL Foundation Certificate
7 1 (0.57%) MCAD
7 1 (0.57%) MCPD
7 1 (0.57%) MCSD
Quality Assurance & Compliance
1 14 (8.00%) QA
2 5 (2.86%) ISO/IEC 27001
3 4 (2.29%) GDPR
4 3 (1.71%) WCAG
5 2 (1.14%) COBIT
5 2 (1.14%) HL7
5 2 (1.14%) PERC
6 1 (0.57%) Accessibility
6 1 (0.57%) Disclosure Scotland
System Software
1 22 (12.57%) Docker
2 3 (1.71%) Active Directory
2 3 (1.71%) Postfix
2 3 (1.71%) RACF
Systems Management
1 10 (5.71%) Kubernetes
2 7 (4.00%) Single Sign-On
3 5 (2.86%) Ansible
4 3 (1.71%) Grafana
4 3 (1.71%) Microsoft Intune
4 3 (1.71%) Packer
4 3 (1.71%) Progress Chef
4 3 (1.71%) Prometheus
4 3 (1.71%) Puppet
4 3 (1.71%) Terraform
5 1 (0.57%) CA Wily
5 1 (0.57%) Kibana
Vendors
1 36 (20.57%) Microsoft
2 34 (19.43%) Oracle
3 27 (15.43%) ServiceNow
4 15 (8.57%) SAP
5 7 (4.00%) Salesforce
6 6 (3.43%) CA Agile Central
6 6 (3.43%) Citrix
7 5 (2.86%) Workday
8 4 (2.29%) Atlassian
8 4 (2.29%) Splunk
8 4 (2.29%) Zend
9 3 (1.71%) Dynatrace
9 3 (1.71%) Google
9 3 (1.71%) Jaspersoft
9 3 (1.71%) Snow
10 2 (1.14%) Databricks
10 2 (1.14%) HP
10 2 (1.14%) IBM
10 2 (1.14%) Siebel
10 2 (1.14%) UiPath