
NCSC Job Trends in London

National Cyber Security Centre (NCSC)
England > London

The table below provides summary statistics and salary benchmarking for jobs advertised in London requiring NCSC skills. It covers permanent job vacancies from the 6 months leading up to 13 October 2026, with comparisons to the same periods in the previous two years.

6 months to
13 Oct 2026
Same period 2025 Same period 2024
Rank 367 312 416
Rank change year-on-year -55 +104 -5
Permanent jobs citing NCSC 76 77 33
As % of all permanent jobs in London 0.29% 0.66% 0.18%
As % of the Quality Assurance & Compliance category 2.19% 3.26% 1.12%
Number of salaries quoted 45 18 15
10th Percentile £59,750 £64,509 £48,750
25th Percentile - £70,000 £52,500
Median annual salary (50th Percentile) £75,000 £77,250 £74,425
Median % change year-on-year -2.91% +3.80% -6.97%
75th Percentile £86,500 £82,188 £77,500
90th Percentile £96,500 £84,600 £85,000
England median annual salary £75,000 £70,000 £61,500
% change year-on-year +7.14% +13.82% -12.14%

All Quality Assurance and Compliance Skills
London

NCSC falls under the Quality Assurance and Compliance category. For comparison with the information above, the following table provides summary statistics for all permanent job vacancies requiring quality assurance or compliance skills in London.

Permanent vacancies with a requirement for quality assurance or compliance skills 3,469 2,360 2,945
As % of all permanent jobs advertised in London 13.32% 20.24% 16.20%
Number of salaries quoted 2,108 1,484 1,564
10th Percentile £41,250 £41,250 £45,000
25th Percentile £53,438 £55,000 £57,000
Median annual salary (50th Percentile) £72,500 £70,000 £75,000
Median % change year-on-year +3.57% -6.67% +7.14%
75th Percentile £91,250 £90,000 £95,000
90th Percentile £110,375 £108,750 £120,000
England median annual salary £55,000 £56,000 £59,500
% change year-on-year -1.79% -5.88% -0.83%

NCSC
Job Vacancy Trend in London

Historical trend showing the proportion of permanent IT job postings citing NCSC relative to all permanent IT jobs advertised in London.
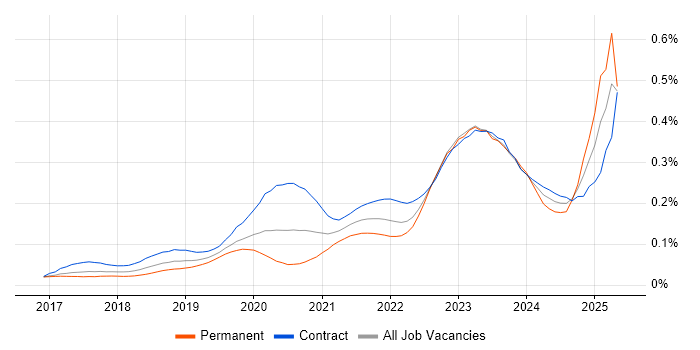
NCSC job vacancy trend in London

NCSC
Salary Trend in London

Salary distribution trend for jobs in London citing NCSC.
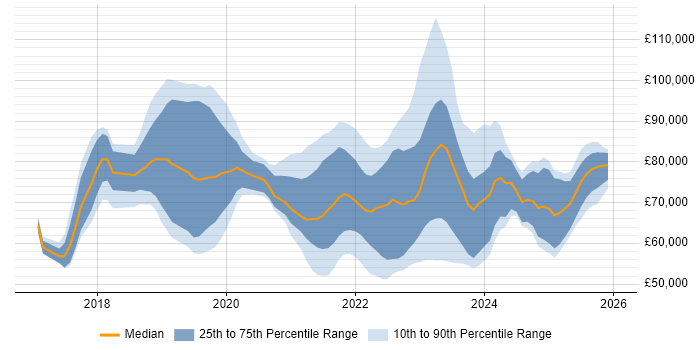
Salary distribution trend for jobs in London citing NCSC

NCSC
Salary Histogram in London

Salary distribution for jobs citing NCSC in London over the 6 months to 13 October 2026.

Salary histogram for NCSC in London

NCSC
Job Locations in London

The table below looks at the demand and provides a guide to the median salaries quoted in IT jobs citing NCSC within the London region over the 6 months to 13 October 2026. The 'Rank Change' column provides an indication of the change in demand within each location based on the same 6 month period last year.

Location Rank Change
on Same Period
Last Year
Matching
Permanent
IT Job Ads
Median Salary
Past 6 Months
Median Salary
% Change
on Same Period
Last Year
Live
Jobs
West London -23 8 £62,621 - 1
Central London +6 6 £72,500 -9.38% 11
NCSC
England

NCSC
Co-Occurring Skills & Capabilities in London by Category

The following tables expand on the one above by listing co-occurrences grouped by category. They cover the same employment type, locality and period, with up to 20 co-occurrences shown in each category:

Application Platforms
1 1 (1.32%) IIS
Cloud Services
1 29 (38.16%) Azure
2 28 (36.84%) AWS
3 22 (28.95%) GCP
4 5 (6.58%) Entra ID
5 4 (5.26%) Microsoft 365
6 3 (3.95%) Azure Sentinel
7 2 (2.63%) Microsoft Purview
8 1 (1.32%) Amazon ECS
8 1 (1.32%) Amazon EKS
8 1 (1.32%) Amazon GuardDuty
8 1 (1.32%) Azure ExpressRoute
8 1 (1.32%) Azure Monitor
8 1 (1.32%) GitHub
8 1 (1.32%) GitHub Copilot
8 1 (1.32%) OpenShift
Communications & Networking
1 25 (32.89%) Network Security
2 6 (7.89%) TCP/IP
3 2 (2.63%) Firewall
4 1 (1.32%) VPN
4 1 (1.32%) WAN
Development Applications
1 1 (1.32%) Burp Suite
General
1 36 (47.37%) Public Sector
2 32 (42.11%) Social Skills
3 24 (31.58%) Inclusion and Diversity
4 16 (21.05%) Law
5 13 (17.11%) Analytical Skills
6 10 (13.16%) Finance
7 9 (11.84%) Legal
8 6 (7.89%) Influencing Skills
8 6 (7.89%) Retail
9 4 (5.26%) Aviation
10 3 (3.95%) Local Government
10 3 (3.95%) Telecoms
11 1 (1.32%) Banking
11 1 (1.32%) Billing
11 1 (1.32%) Brand Awareness
11 1 (1.32%) Manufacturing
11 1 (1.32%) Pharmaceutical
Job Titles
1 31 (40.79%) Architect
2 28 (36.84%) Security Architect
3 13 (17.11%) Consultant
4 12 (15.79%) Security Consultant
5 11 (14.47%) Senior
6 8 (10.53%) Senior Consultant
7 7 (9.21%) Cybersecurity Manager
7 7 (9.21%) Security Manager
7 7 (9.21%) Senior Security Consultant
8 6 (7.89%) Cybersecurity Consultant
9 5 (6.58%) Lead
9 5 (6.58%) Risk Manager
10 4 (5.26%) Analyst
10 4 (5.26%) Cybersecurity Analyst
10 4 (5.26%) Risk Analyst
10 4 (5.26%) Risk Consultant
10 4 (5.26%) Security Analyst
10 4 (5.26%) Security Risk Analyst
11 3 (3.95%) Head of Compliance
11 3 (3.95%) Security Officer
Libraries, Frameworks & Software Standards
1 3 (3.95%) Terraform
Miscellaneous
1 15 (19.74%) Cyber Threat
1 15 (19.74%) Management Information System
2 10 (13.16%) Operational Technology
3 7 (9.21%) PKI
4 4 (5.26%) Cyber Defence
4 4 (5.26%) Security Operations Centre
4 4 (5.26%) Security Posture
5 3 (3.95%) Analytical Mindset
6 2 (2.63%) Enterprise Cloud
6 2 (2.63%) Life Science
6 2 (2.63%) Public Cloud
6 2 (2.63%) Self-Motivation
7 1 (1.32%) Blog
7 1 (1.32%) Data Centre
7 1 (1.32%) Industrial Internet of Things
7 1 (1.32%) NHS
7 1 (1.32%) SCADA
7 1 (1.32%) Social Media
7 1 (1.32%) Web Conferencing
Operating Systems
1 2 (2.63%) Linux
1 2 (2.63%) Windows
2 1 (1.32%) Kali Linux
Processes & Methodologies
1 50 (65.79%) Cybersecurity
2 41 (53.95%) Security Architecture
3 35 (46.05%) Agile
4 28 (36.84%) TOGAF
5 27 (35.53%) OWASP
6 26 (34.21%) Risk Management
7 25 (32.89%) Cloud Security
8 24 (31.58%) Architectural Patterns
8 24 (31.58%) SABSA
8 24 (31.58%) Stakeholder Engagement
8 24 (31.58%) Threat Modelling
9 21 (27.63%) Risk Assessment
10 18 (23.68%) Information Security
11 16 (21.05%) Identity Access Management
12 15 (19.74%) Technology Strategy
13 14 (18.42%) Community of Practice
13 14 (18.42%) Problem-Solving
13 14 (18.42%) Risk Analysis
14 13 (17.11%) Regulatory Compliance
15 12 (15.79%) Stakeholder Management
Programming Languages
1 2 (2.63%) Bash
1 2 (2.63%) Bicep
1 2 (2.63%) Python
2 1 (1.32%) Kusto Query Language
2 1 (1.32%) PowerShell
Qualifications
1 52 (68.42%) CISSP
2 47 (61.84%) Security Cleared
3 41 (53.95%) CISM
4 35 (46.05%) SC Cleared
5 26 (34.21%) Degree
6 15 (19.74%) CISA
7 12 (15.79%) CREST Certified
8 9 (11.84%) CRISC
9 7 (9.21%) ISO 27001 Lead Auditor
9 7 (9.21%) ISO 27001 Lead Implementer
10 6 (7.89%) CESG Certified Professional
11 5 (6.58%) Master's Degree
12 4 (5.26%) CEH
12 4 (5.26%) CISMP
12 4 (5.26%) OSCP
13 3 (3.95%) Azure Certification
13 3 (3.95%) DV Cleared
13 3 (3.95%) TOGAF Certification
14 2 (2.63%) CIPD
14 2 (2.63%) CompTIA Security+
Quality Assurance & Compliance
1 59 (77.63%) NIST
2 57 (75.00%) ISO/IEC 27001
3 24 (31.58%) GRC
4 20 (26.32%) GDPR
5 18 (23.68%) HMG Security Policy Framework
6 13 (17.11%) ISO/IEC 27005
7 8 (10.53%) PCI DSS
8 6 (7.89%) Cyber Essentials
9 3 (3.95%) COBIT
9 3 (3.95%) Cyber Essentials PLUS
9 3 (3.95%) ISO/IEC 27002 (supersedes ISO/IEC 17799)
10 1 (1.32%) IASME
10 1 (1.32%) RMADS
10 1 (1.32%) SOC 2
System Software
1 1 (1.32%) Active Directory
1 1 (1.32%) Docker
1 1 (1.32%) VMware Infrastructure
Systems Management
1 2 (2.63%) Kubernetes
2 1 (1.32%) Ansible
2 1 (1.32%) Nessus
2 1 (1.32%) Nmap
Vendors
1 10 (13.16%) Microsoft
2 7 (9.21%) Google
3 5 (6.58%) Workday
4 2 (2.63%) Darktrace
4 2 (2.63%) Remedy
5 1 (1.32%) ForgeRock
5 1 (1.32%) Okta
5 1 (1.32%) Ping Identity
5 1 (1.32%) Qualys
5 1 (1.32%) Red Hat
5 1 (1.32%) VMware